[](https://CRAN.R-project.org/package=moveVis)
[](https://CRAN.R-project.org/package=moveVis)
[](https://cran.r-project.org/web/checks/check_results_moveVis.html)
[](https://travis-ci.org/16EAGLE/moveVis)
[](https://ci.appveyor.com/project/16EAGLE/moveVis)
[](https://codecov.io/gh/16EAGLE/moveVis)
[](https://CRAN.R-project.org/package=moveVis)
## Introduction
`moveVis` provides tools to visualize movement data (e.g. from GPS tracking) and temporal changes of environmental data (e.g. from remote sensing) by creating video animations. It works with `move` and `raster` class inputs and turns them into `ggplot2` frames that can be further customized. `moveVis` uses `gifski` (wrapping the gifski cargo crate) and `av` (binding to FFmpeg) to render frames into animated GIF or video files.
A peer-reviewed open-access paper accompanying `moveVis` has been published in *Methods in Ecology and Evolution*.
[](https://CRAN.R-project.org/package=moveVis)
[](https://CRAN.R-project.org/package=moveVis)
[](https://cran.r-project.org/web/checks/check_results_moveVis.html)
[](https://travis-ci.org/16EAGLE/moveVis)
[](https://ci.appveyor.com/project/16EAGLE/moveVis)
[](https://codecov.io/gh/16EAGLE/moveVis)
[](https://CRAN.R-project.org/package=moveVis)
## Introduction
`moveVis` provides tools to visualize movement data (e.g. from GPS tracking) and temporal changes of environmental data (e.g. from remote sensing) by creating video animations. It works with `move` and `raster` class inputs and turns them into `ggplot2` frames that can be further customized. `moveVis` uses `gifski` (wrapping the gifski cargo crate) and `av` (binding to FFmpeg) to render frames into animated GIF or video files.
A peer-reviewed open-access paper accompanying `moveVis` has been published in *Methods in Ecology and Evolution*.
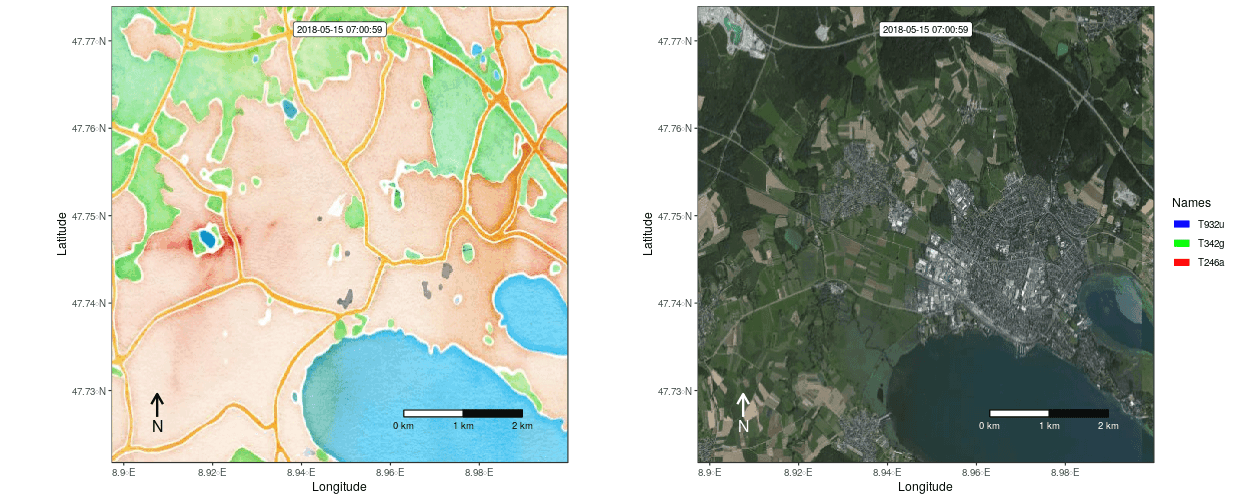
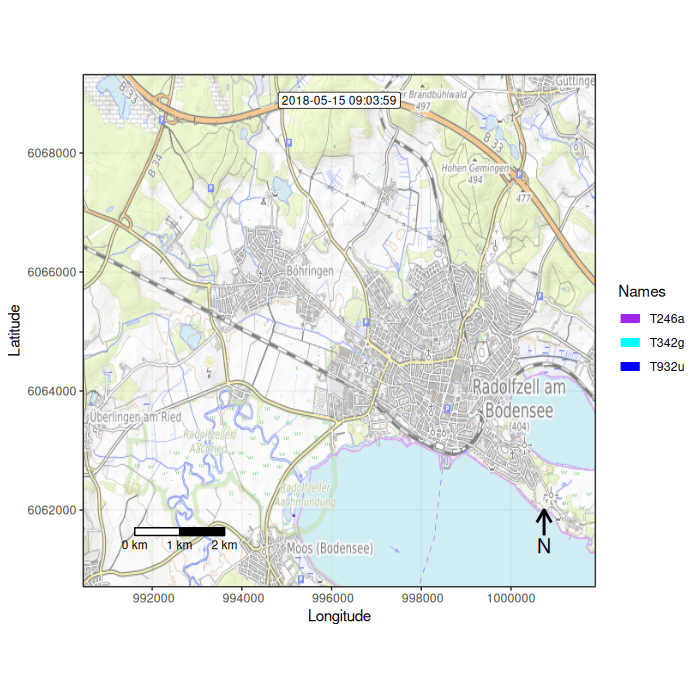
Figure 1: Example movement tracks nearby Lake of Constance on top of a OSM watercolor and a mapbox satellite base map
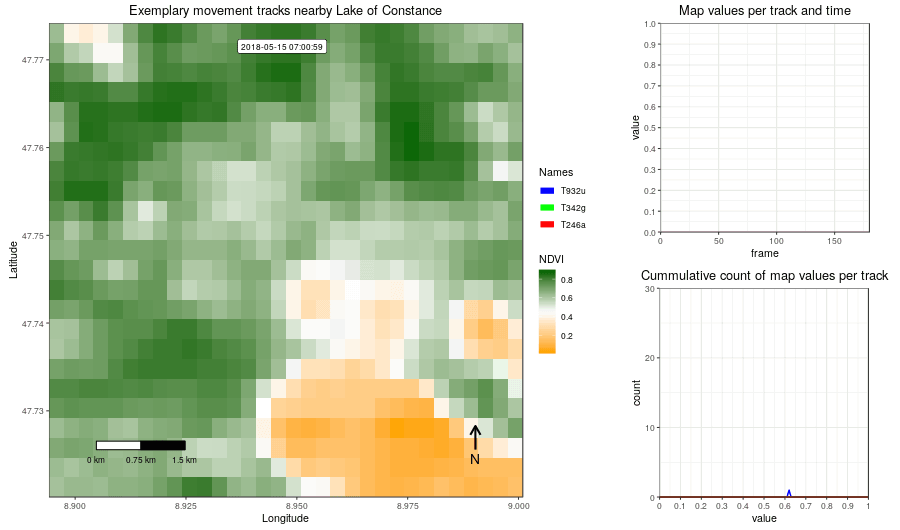
Figure 2: Example movement tracks nearby Lake of Constance and a gradient base layer faded over time
## Installation With version 0.10.0, the package has been rewritten from the ground up with the goal to make it easier to customize the appearance of movement animations. Thus, the logic of the package, its functions and their syntax have changed. The latest stable version of `moveVis` can be installed from CRAN: ```r install.packages("moveVis") ``` The development version can be installed from GitHub: ```r devtools::install_github("16EAGLE/moveVis") ``` Code written for `moveVis` version <=0.9.9 will not work with newer versions, but it is quite simple and thus highly recommended to switch to the new syntax due to a variety of advantages. `moveVis` version <=0.9.9 can still be downloaded here and installed manually: ```r setwd("your/download/directory") install.packages("moveVis-0.9.9.tar.gz", repos = NULL) ``` ## Function overview `moveVis` includes the following functions, sorted by the order they would be applied to create an animation from movement and environmental data: #### Preparing movement tracks * `df2move()` converts a `data.frame` into a `move` or `moveStack` object. This is useful if you do not usually work with the `move` classes and your tracks are present as `data.frames`. * `align_move()` aligns single and multi-individual movement data to a uniform time scale with a uniform temporal resolution needed for creating an animation from it. Use this function to prepare your movement data for animation depending on the temporal resolution that suits your data. * `subset_move()` subsets a `move` or `moveStack` by a given time span. This is useful if you want to create a movement animation of only a temporal subset of your data, e.g. a particular day. #### Creating frames * `get_maptypes()` returns a character vector of available map types that can be used with `frames_spatial()`. `moveVis` supports OpenStreetMap and Mapbox basemap imagery. Alternatively, you can provide custom imagery to `frames_spatial()`. * `frames_spatial()` creates a list of `ggplot2` maps displaying movement. Each object represents a single frame. Each frame can be viewed or modified individually. The returned list of frames can be animated using `animate_frames()`. * `frames_graph()` creates a list of `ggplot2` graphs displaying movement-environment interaction. Each object represents a single frame. Each frame can be viewed or modified individually. The returned list of frames can be animated using `animate_frames()`. #### Adapting frames * `add_gg()` adds `ggplot2` functions (e.g. to add layers such as points, polygons, lines, or to change scales etc.) to the animation frames created with `frames_spatial()` or `frames_graph()`. Instead of creating your own `ggplot2` functions, you can use one of the other `moveVis` `add_``functions: * `add_labels()` adds character labels such as title or axis labels to animation frames created with `frames_spatial()` or `frames_graph()`. * `add_scalebar()` adds a scalebar to the animation frames created with `frames_spatial()` or `frames_graph()`. * `add_northarrow()` adds a north arrow to the animation frames created with `frames_spatial()` or `frames_graph()`. * `add_progress()` adds a progress bar to animation frames created with `frames_spatial()` or `frames_graph()`. * `add_timestamps()` adds timestamps to animation frames created with `frames_spatial()` or `frames_graph()`. * `add_text()` adds static or dynamically changing text to the animation frames created with `frames_spatial()` or `frames_graph()`. * `add_colourscale()` adjusts the colour scales of the animation frames created with `frames_spatial()` and custom map imagery using the `r_list` argument. * `join_frames()` side-by-side joins the `ggplot2` objects of two or more frames lists of equal lengths into a single list of `ggplot2` objects per frame using `cowplot::plot_grid`. This is useful if you want to side-by-side combine spatial frames returned by `frames_spatial()` with graph frames returned by `frames_graph()`. * `get_frametimes()` extracts the timestamps associated with each frame of a list of frames created using `frames_spatial()` or `frames_graph()` and returns them as a vector. #### Animating frames (as GIF or video) * `suggest_formats()` returns a selection of suggested file formats that can be used with `out_file` of `animate_frames()` on your system. * `animate_frames()` creates an animation from a list of frames computed with `frames_spatial()`, `frames_graph()` or `join_frames()`. #### Viewing movement tracks * `view_spatial()` displays movement tracks on an interactive `mapview` or `leaflet` map. #### Processing settings * `use_multicore()` enables multi-core usage for computational expensive processing steps. * `use_disk()` enables the usage of disk space for creating frames, which can prevent memory overload when creating frames for very large animations. ## Get started The following example shows how to make a simple animation using a default base map by first aligning your movement data to a uniform time scale, creating a list of `ggplot2` frames and turning these frames into an animated `GIF`: ```R library(moveVis) library(move) data("move_data", package = "moveVis") # move class object # if your tracks are present as data.frames, see df2move() for conversion # align move_data to a uniform time scale m <- align_move(move_data, res = 240, digit = 0, unit = "secs") # create spatial frames with a OpenStreetMap watercolour map frames <- frames_spatial(m, path_colours = c("red", "green", "blue"), map_service = "osm", map_type = "watercolor", alpha = 0.5) %>% add_labels(x = "Longitude", y = "Latitude") %>% # add some customizations, such as axis labels add_northarrow() %>% add_scalebar() %>% add_timestamps(m, type = "label") %>% add_progress() frames[[100]] # preview one of the frames, e.g. the 100th frame # animate frames animate_frames(frames, out_file = "moveVis.gif") ```