# Client-side debugging
This guide will walk you through the necessary steps to debug client-side code in a CEP extension.
## Contents
1. [Prerequisites](#prerequisites)
1. [Set the Debug Mode](#set-the-debug-mode)
1. [Create a `.debug` File](#create-a-debug-file)
1. [Write Contents for the `.debug` File](#write-contents-for-the-debug-file)
1. [Debugging in Chrome](#debugging-in-chrome)
1. [Troubleshooting common issues](#troubleshooting-common-issues)
1. [Getting a "not properly signed" alert](#getting-a-not-properly-signed-alert)
1. [Getting a blank debug console](#getting-a-blank-debug-console)
1. [Next Steps](#next-steps)
1. [Other Resources](#other-resources)
## Prerequisites
This guide will assume that you have completed all steps in the [Getting Started with CEP Extensions Guide](../readme.md).
## Set the Debug Mode
First, set the following Adobe preference to prevent your host application (Photoshop, InDesign, etc.) from throwing alerts about unsigned extensions. The [HTML Extension Cookbook](https://github.com/Adobe-CEP/CEP-Resources/blob/master/CEP_8.x/Documentation/CEP%208.0%20HTML%20Extension%20Cookbook.md) section on [Debugging Unsigned Extensions](https://github.com/Adobe-CEP/CEP-Resources/blob/master/CEP_8.x/Documentation/CEP%208.0%20HTML%20Extension%20Cookbook.md#debugging-unsigned-extensions) explains this process:
> Windows: Open regedit > HKEY_CURRENT_USER/Software/Adobe/CSXS.8, then add a new entry `PlayerDebugMode` of type “`string`” with the value of “`1`”.
> Mac: In the Terminal, type: `defaults write com.adobe.CSXS.8 PlayerDebugMode 1`
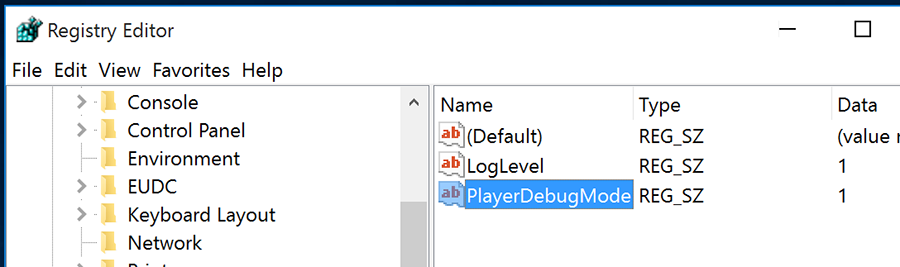 *On Windows, Regedit is located in (C:\Windows\regedit). You can access it using CMD, too.*
*On macOS, Terminal is located in (Applications > Utilities > Terminal).*
## Create a `.debug` File
Next, create a `.debug` file for your extension. The `.debug` file needs to be at the top level of your extension’s folder.
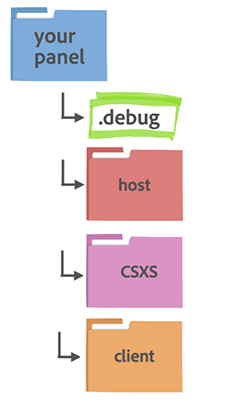
The `.debug` file must be a hidden file in order to work. The `.` at the front of the file name will make it hidden. The easiest way to create this file is to use the code editing tool of your choice (like Sublime Text or Brackets) to create a new file named `.debug`.
To see your hidden files on Mac, as of MacOS Sierra, you can use the `Command Shift +` shortcut.
To see your hidden files on Windows 10, you can expand your view options in a File Explorer window and check the Hidden Files box.
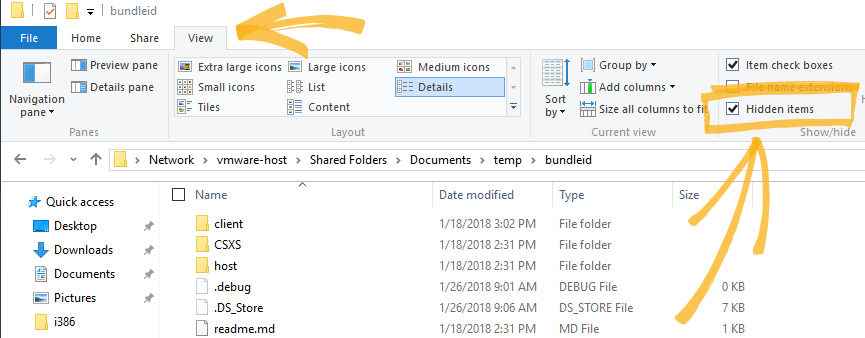*How to see your hidden files in Windows 10.*
## Write Contents for the `.debug` File
The `.debug` file must include the following elements (see notes **#1-2** below):
```html
```
1. The Extension ID in this `.debug` file above must match the Extenstion ID in your `manifest.xml` file (see [our Getting Started Guide](https://github.com/Adobe-CEP/Getting-Started-guides/blob/master/readme.md) for more information).
1. List the _Host IDs_ for each app your extension supports, with a corresponding port of your choosing for debugging. In this example, we've listed the Host IDs for Photoshop. [The full list of host application ports is available in the CEP Cookbook](https://github.com/Adobe-CEP/CEP-Resources/blob/master/CEP_8.x/Documentation/CEP%208.0%20HTML%20Extension%20Cookbook.md).
## Debugging in Chrome
Open Chrome and go to `http://localhost:8088/` or whichever port you set in your `.debug` file in the previous section.
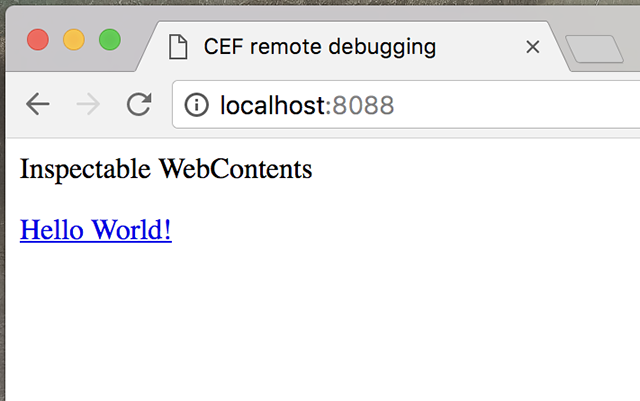
*CEF Remote Debugging in Chrome*
If your panel is working, you’ll see the name of your extension as a link you can click on, as seen in the image above. The link will take you to the JavaScript Console within Chromium DevTools. The JavaScript Console is where, among other things, you will see your extension's log and error output.
*The JavaScript Console in Chrome*
In the example below, the `console.log()` message is “I can’t believe you clicked!”. The message originates from the `