Preliminaries
%matplotlib inline
import pandas as pd
import matplotlib.pyplot as plt
import numpy as np
Create dataframe
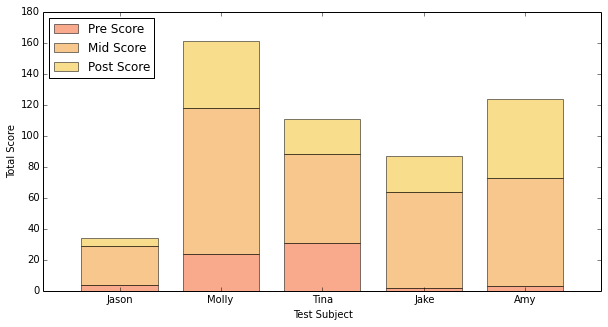
raw_data = {'first_name': ['Jason', 'Molly', 'Tina', 'Jake', 'Amy'],
        'pre_score': [4, 24, 31, 2, 3],
        'mid_score': [25, 94, 57, 62, 70],
        'post_score': [5, 43, 23, 23, 51]}
df = pd.DataFrame(raw_data, columns = ['first_name', 'pre_score', 'mid_score', 'post_score'])
df
|
first_name |
pre_score |
mid_score |
post_score |
| 0 |
Jason |
4 |
25 |
5 |
| 1 |
Molly |
24 |
94 |
43 |
| 2 |
Tina |
31 |
57 |
23 |
| 3 |
Jake |
2 |
62 |
23 |
| 4 |
Amy |
3 |
70 |
51 |
Make plot
# Create the general blog and the "subplots" i.e. the bars
f, ax1 = plt.subplots(1, figsize=(10,5))

# Set the bar width
bar_width = 0.75

# positions of the left bar-boundaries
bar_l = [i+1 for i in range(len(df['pre_score']))]

# positions of the x-axis ticks (center of the bars as bar labels)
tick_pos = [i+(bar_width/2) for i in bar_l]

# Create a bar plot, in position bar_1
ax1.bar(bar_l,
        # using the pre_score data
        df['pre_score'],
        # set the width
        width=bar_width,
        # with the label pre score
        label='Pre Score',
        # with alpha 0.5
        alpha=0.5,
        # with color
        color='#F4561D')

# Create a bar plot, in position bar_1
ax1.bar(bar_l,
        # using the mid_score data
        df['mid_score'],
        # set the width
        width=bar_width,
        # with pre_score on the bottom
        bottom=df['pre_score'],
        # with the label mid score
        label='Mid Score',
        # with alpha 0.5
        alpha=0.5,
        # with color
        color='#F1911E')

# Create a bar plot, in position bar_1
ax1.bar(bar_l,
        # using the post_score data
        df['post_score'],
        # set the width
        width=bar_width,
        # with pre_score and mid_score on the bottom
        bottom=[i+j for i,j in zip(df['pre_score'],df['mid_score'])],
        # with the label post score
        label='Post Score',
        # with alpha 0.5
        alpha=0.5,
        # with color
        color='#F1BD1A')

# set the x ticks with names
plt.xticks(tick_pos, df['first_name'])

# Set the label and legends
ax1.set_ylabel("Total Score")
ax1.set_xlabel("Test Subject")
plt.legend(loc='upper left')

# Set a buffer around the edge
plt.xlim([min(tick_pos)-bar_width, max(tick_pos)+bar_width])