Bar Graph
# load the ggplot2 library
library(ggplot2)
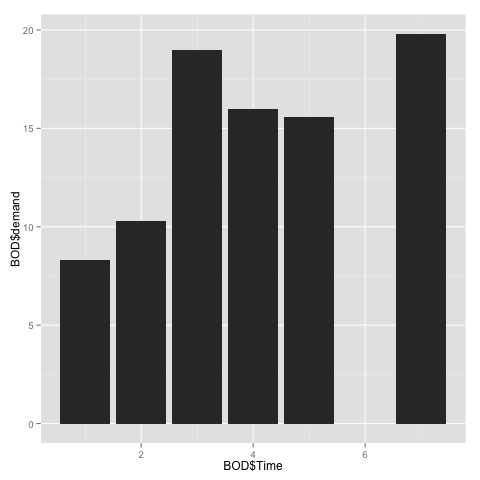
# plot BOD$Time and BOD$demand
qplot(BOD$Time, BOD$demand, geom="bar", stat="identity")
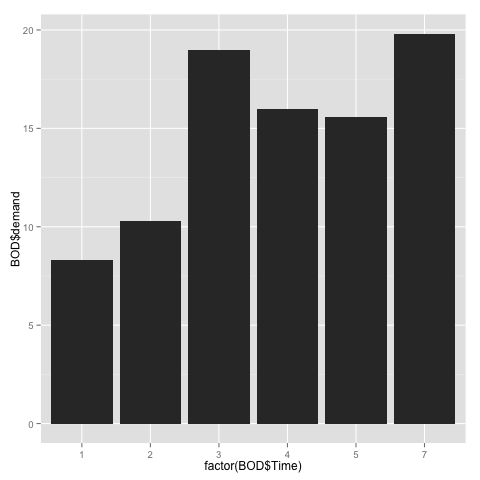
# Convert the x variable to a factor, so that it is treated as discrete
qplot(factor(BOD$Time), BOD$demand, geom="bar", stat="identity")