Line Plot With Multiple Lines
Original source: r graphics cookbook
# load the gcookbook package for the data
library(gcookbook)

# load the ggplot2 package
library(ggplot2)

# load plyr package
library(plyr)

# reset the graphing device
dev.off()
null device
          1
# summarize the ToothGrowth data
tg <- ddply(ToothGrowth, c("supp", "dose"), summarise, length=mean(len))
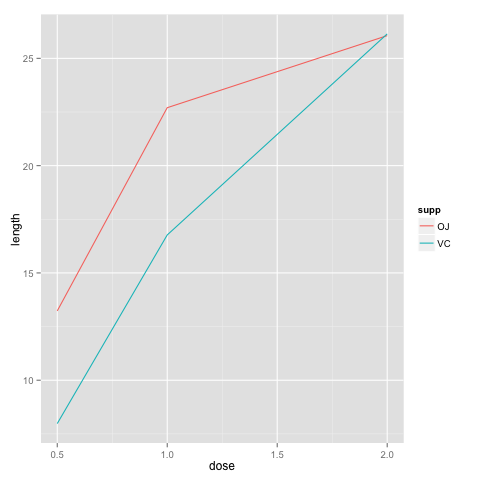
# create a ggplot with lines colored by the tg$supp variable
ggplot(tg, aes(x=dose, y=length, colour=supp)) +
  geom_line()
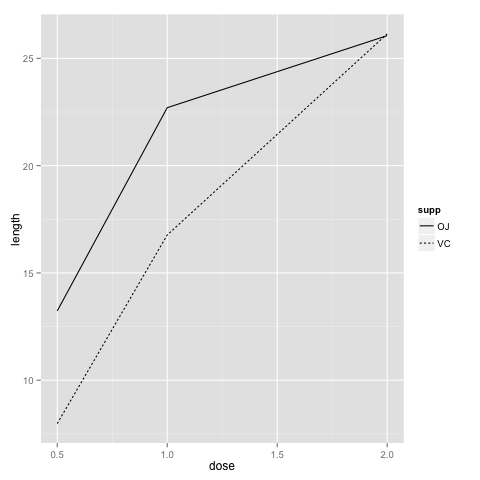
# create a ggplot with line-types determined by the tg$supp variable
ggplot(tg, aes(x=dose, y=length, linetype=supp)) +
  geom_line()