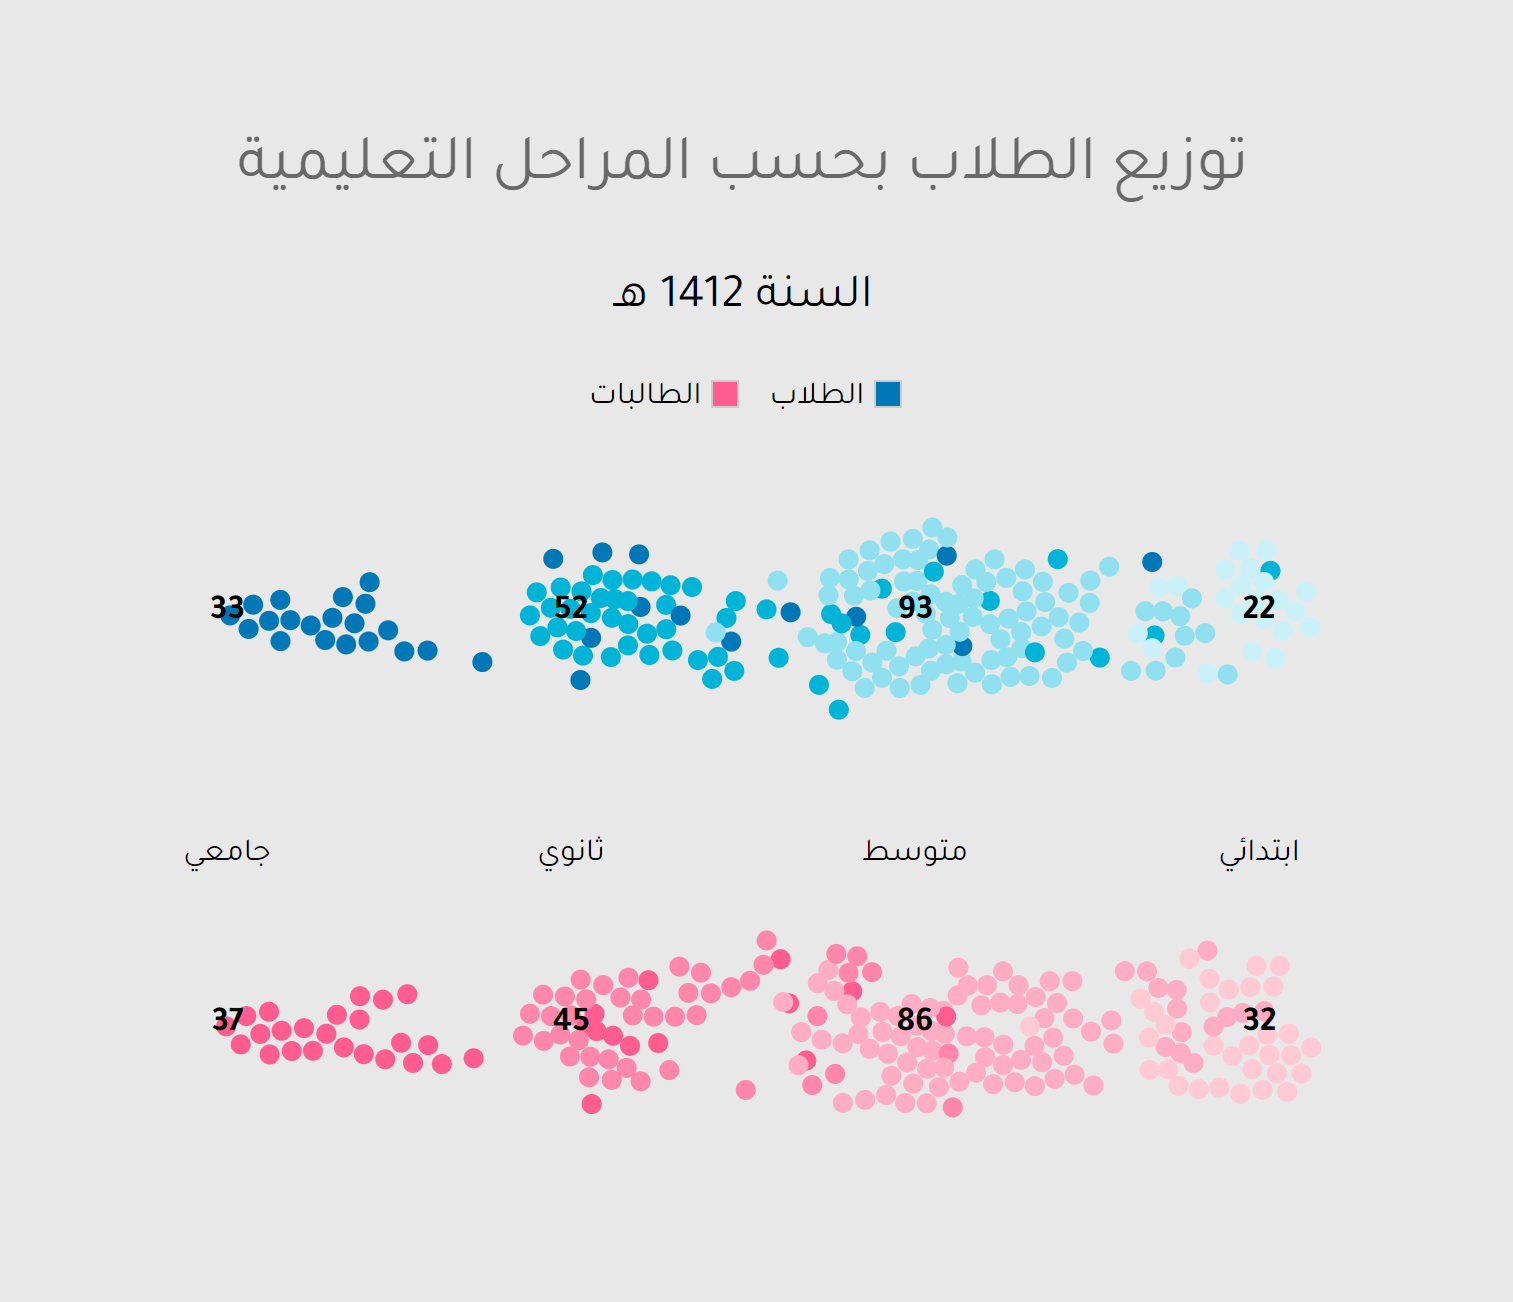
Education Stages Simulation
A simulation of the trend of educational stages attainment of a population visualized as a force-directed graph to form a collection of bubbles (students) that move/transition from an educational stage to another overtime.

Status Change Chart
D3.js
This moving bubbles chart with simulated forces helps to convey a status/stage change that happens overtime. The animation on the left plays out the real timelines of males and their changing stages in education since 1400 against those of females.
What I did
- Data Analysis
- UI Design & Dev
Tools
- HTML5/CSS3
- D3.js
Data
- Mock data!
Client
- Personal Project