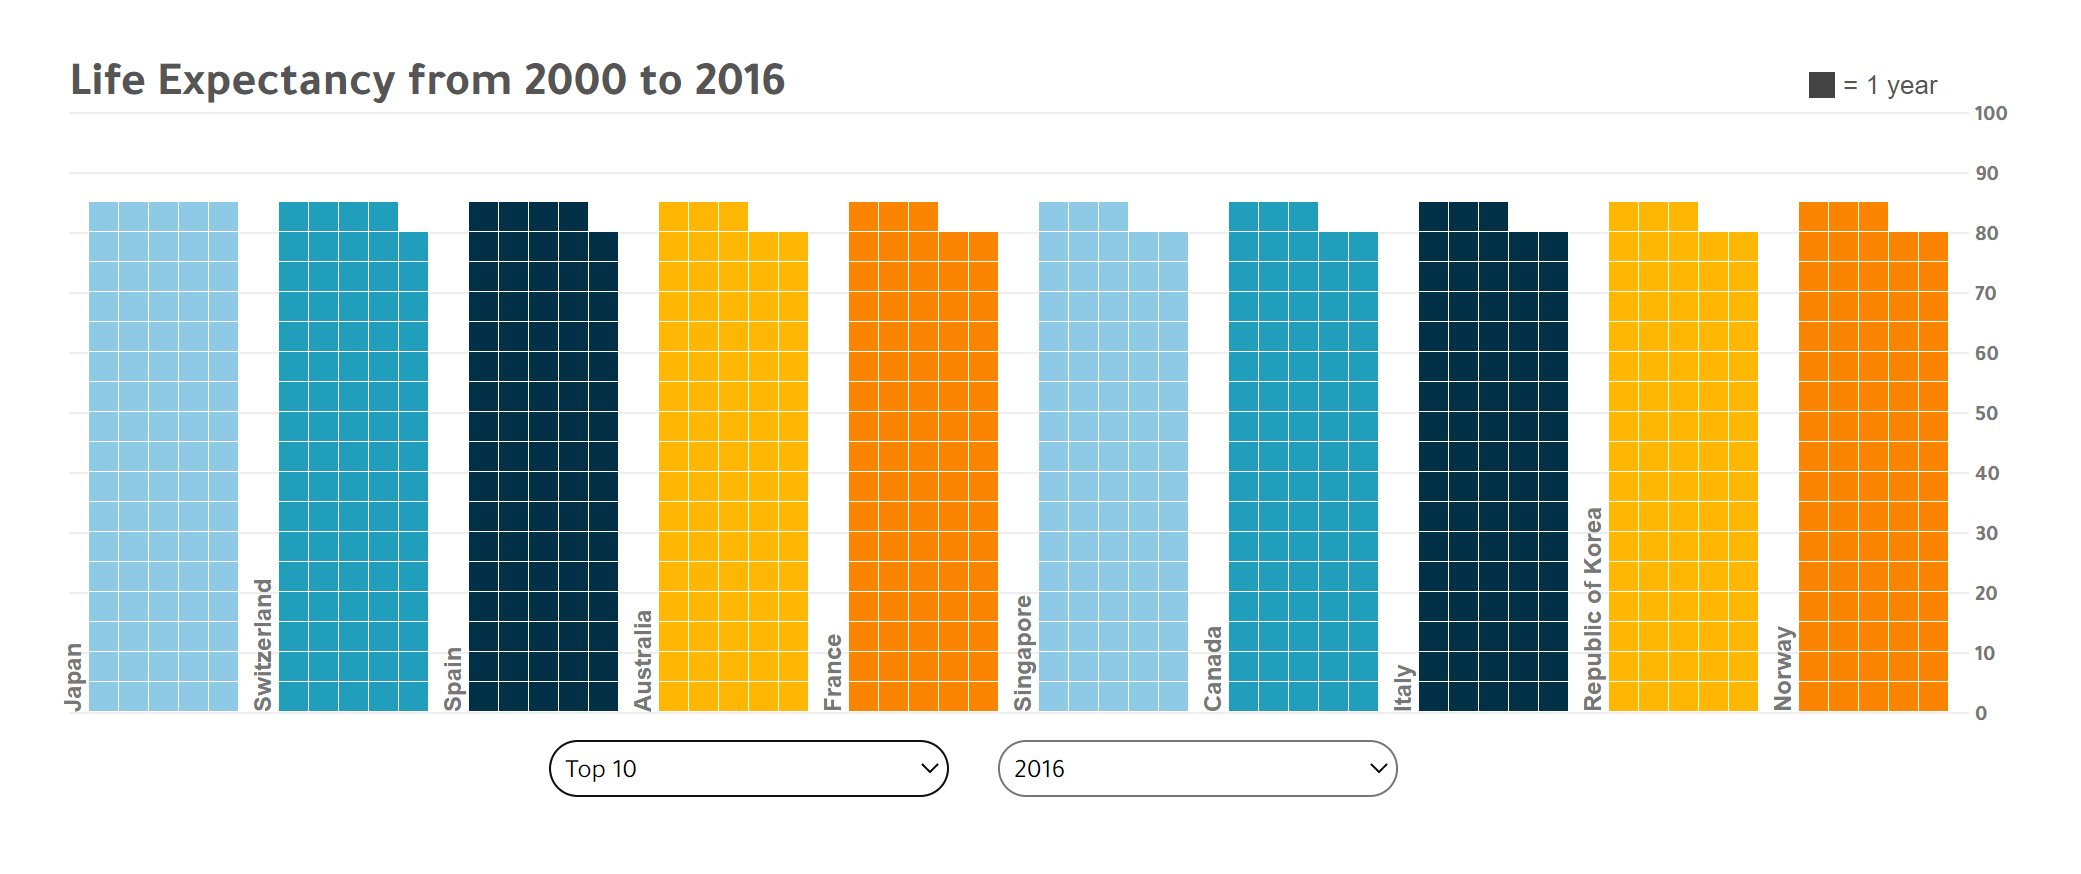
Life Expectancy

Animated Tiled Bar Chart
D3.js
In this bar chart, a bar is split into smaller cells where each cell represents a single item; a single year in a person’s lifetime. This allows you to read values more precisely by counting the cells.
What I did
- UI Dev
Tools
- HTML5/CSS3
- D3.js
Data
Client
- Personal Project