---
template: overrides/blogs.html
tags:
- python
---
# 好用的Python包
!!! info
作者:Void,发布于2021-08-03,阅读时间:约10分钟,微信公众号文章链接:[:fontawesome-solid-link:](https://mp.weixin.qq.com/s/FdsPsRgO9unQW-aK_6RoIA)
## 1 引言
Python之所以好用,很大程度上是由于它可以方便地调用实现各种功能的包(调包侠本人)。
如常用的Pandas,Numpy等可能是数据科学从业者每天需要打交道的对象。不止于此,本文将基于自己的实际使用经验,介绍一些小众而又好用的Python的包,让你在使用Python的过程中如虎添翼。
## 2 好用的Python包
### 2.1 tqdm
[tqdm](https://github.com/tqdm/tqdm)是一个小巧的、显示循环进度条的工具。不知你是否有这样的体验:你写了一段复杂的循环,满心欢喜地点击运行,然而除了看到程序一直在运行,你永远不知道这个循环要跑多久,你甚至不知道它是否真的在运行,或是kernel已经挂了。
有了tqdm,你只需要在循环的迭代器上加上它,你就可以看到进度条、每个循环所花的时间以及预估的总时间等。
```Python
for i in tqdm(range(100)):
sleep(0.01)
```
 值得一提的是,tqdm也可以作用于DataFrame的apply(groupby)。
```Python
import numpy as np
import pandas as pd
from tqdm.auto import tqdm
df = pd.DataFrame(np.random.randint(0, 100, (100000, 6)))
tqdm.pandas(desc="my bar!")
df.progress_apply(lambda x: x**2)
```
### 2.2 dateutil
在关于时间格式的处理中,我很喜欢使用[dateutil](https://dateutil.readthedocs.io/en/stable/parser.html)这个包中的parse方法。
它可以根据不同格式的时间输入很智能的给出标准化的时间输出。
```Python
from dateutil.parser import parse
In: parse('22nd,July,2009')
Out: datetime.datetime(2009, 7, 22, 0, 0)
In: parse('2018-04-20')
Out: datetime.datetime(2018, 4, 20, 0, 0)
In: parse('20180420')
Out: datetime.datetime(2018,4,20,0,0)
```
### 2.3 line_profiler和memory_profiler
[line_profiler](https://github.com/pyutils/line_profiler)和[memory_profiler](https://github.com/pythonprofilers/memory_profiler)分别是用来监控代码运行时间以及内存消耗的分析器。它可以很直观地显示某行或是某个函数执行时间过长或是占用过多的内存,以便我们优化代码。
它们的使用也比较简单。只需要在要考察的函数外面加上装饰器。
对于memory_profiler:
创建example.py
```python
@profile
def my_func():
a = [1] * (10 ** 6)
b = [2] * (2 * 10 ** 7)
del b
return a
if __name__ == '__main__':
my_func()
```
然后在命令行中运行:
```
python -m memory_profiler example.py
```
输出结果如下所示:
```
Line # Mem usage Increment Occurrences Line Contents
============================================================
3 38.816 MiB 38.816 MiB 1 @profile
4 def my_func():
5 46.492 MiB 7.676 MiB 1 a = [1] * (10 ** 6)
6 199.117 MiB 152.625 MiB 1 b = [2] * (2 * 10 ** 7)
7 46.629 MiB -152.488 MiB 1 del b
8 46.629 MiB 0.000 MiB 1 return a
```
对于line_profiler:
创建脚本
```python
@profile
def slow_function(a, b, c):
...
```
然后在命令行中运行:
```
python -m line_profiler script_to_profile.py.lprof
```
输出结果如下所示:
```
Pystone(1.1) time for 50000 passes = 2.48
This machine benchmarks at 20161.3 pystones/second
Wrote profile results to pystone.py.lprof
Timer unit: 1e-06 s
File: pystone.py
Function: Proc2 at line 149
Total time: 0.606656 s
Line # Hits Time Per Hit % Time Line Contents
==============================================================
149 @profile
150 def Proc2(IntParIO):
151 50000 82003 1.6 13.5 IntLoc = IntParIO + 10
152 50000 63162 1.3 10.4 while 1:
153 50000 69065 1.4 11.4 if Char1Glob == 'A':
154 50000 66354 1.3 10.9 IntLoc = IntLoc - 1
155 50000 67263 1.3 11.1 IntParIO = IntLoc - IntGlob
156 50000 65494 1.3 10.8 EnumLoc = Ident1
157 50000 68001 1.4 11.2 if EnumLoc == Ident1:
158 50000 63739 1.3 10.5 break
159 50000 61575 1.2 10.1 return IntParIO
```
### 2.4 plotly
Python画图的包有很多,如matplotlib,seaborn,plotly等等。其中,[Plotly](https://plotly.com/)以可交互性独树一帜。
你可以很方便地放大、缩小某一局部或者是选择你感兴趣的某条曲线。它的使用也很简单:
```python
import plotly.express as px
df = px.data.gapminder().query("country=='Canada'")
fig = px.line(df, x="year", y="lifeExp", title='Life expectancy in Canada')
fig.show()
```
值得一提的是,tqdm也可以作用于DataFrame的apply(groupby)。
```Python
import numpy as np
import pandas as pd
from tqdm.auto import tqdm
df = pd.DataFrame(np.random.randint(0, 100, (100000, 6)))
tqdm.pandas(desc="my bar!")
df.progress_apply(lambda x: x**2)
```
### 2.2 dateutil
在关于时间格式的处理中,我很喜欢使用[dateutil](https://dateutil.readthedocs.io/en/stable/parser.html)这个包中的parse方法。
它可以根据不同格式的时间输入很智能的给出标准化的时间输出。
```Python
from dateutil.parser import parse
In: parse('22nd,July,2009')
Out: datetime.datetime(2009, 7, 22, 0, 0)
In: parse('2018-04-20')
Out: datetime.datetime(2018, 4, 20, 0, 0)
In: parse('20180420')
Out: datetime.datetime(2018,4,20,0,0)
```
### 2.3 line_profiler和memory_profiler
[line_profiler](https://github.com/pyutils/line_profiler)和[memory_profiler](https://github.com/pythonprofilers/memory_profiler)分别是用来监控代码运行时间以及内存消耗的分析器。它可以很直观地显示某行或是某个函数执行时间过长或是占用过多的内存,以便我们优化代码。
它们的使用也比较简单。只需要在要考察的函数外面加上装饰器。
对于memory_profiler:
创建example.py
```python
@profile
def my_func():
a = [1] * (10 ** 6)
b = [2] * (2 * 10 ** 7)
del b
return a
if __name__ == '__main__':
my_func()
```
然后在命令行中运行:
```
python -m memory_profiler example.py
```
输出结果如下所示:
```
Line # Mem usage Increment Occurrences Line Contents
============================================================
3 38.816 MiB 38.816 MiB 1 @profile
4 def my_func():
5 46.492 MiB 7.676 MiB 1 a = [1] * (10 ** 6)
6 199.117 MiB 152.625 MiB 1 b = [2] * (2 * 10 ** 7)
7 46.629 MiB -152.488 MiB 1 del b
8 46.629 MiB 0.000 MiB 1 return a
```
对于line_profiler:
创建脚本
```python
@profile
def slow_function(a, b, c):
...
```
然后在命令行中运行:
```
python -m line_profiler script_to_profile.py.lprof
```
输出结果如下所示:
```
Pystone(1.1) time for 50000 passes = 2.48
This machine benchmarks at 20161.3 pystones/second
Wrote profile results to pystone.py.lprof
Timer unit: 1e-06 s
File: pystone.py
Function: Proc2 at line 149
Total time: 0.606656 s
Line # Hits Time Per Hit % Time Line Contents
==============================================================
149 @profile
150 def Proc2(IntParIO):
151 50000 82003 1.6 13.5 IntLoc = IntParIO + 10
152 50000 63162 1.3 10.4 while 1:
153 50000 69065 1.4 11.4 if Char1Glob == 'A':
154 50000 66354 1.3 10.9 IntLoc = IntLoc - 1
155 50000 67263 1.3 11.1 IntParIO = IntLoc - IntGlob
156 50000 65494 1.3 10.8 EnumLoc = Ident1
157 50000 68001 1.4 11.2 if EnumLoc == Ident1:
158 50000 63739 1.3 10.5 break
159 50000 61575 1.2 10.1 return IntParIO
```
### 2.4 plotly
Python画图的包有很多,如matplotlib,seaborn,plotly等等。其中,[Plotly](https://plotly.com/)以可交互性独树一帜。
你可以很方便地放大、缩小某一局部或者是选择你感兴趣的某条曲线。它的使用也很简单:
```python
import plotly.express as px
df = px.data.gapminder().query("country=='Canada'")
fig = px.line(df, x="year", y="lifeExp", title='Life expectancy in Canada')
fig.show()
```
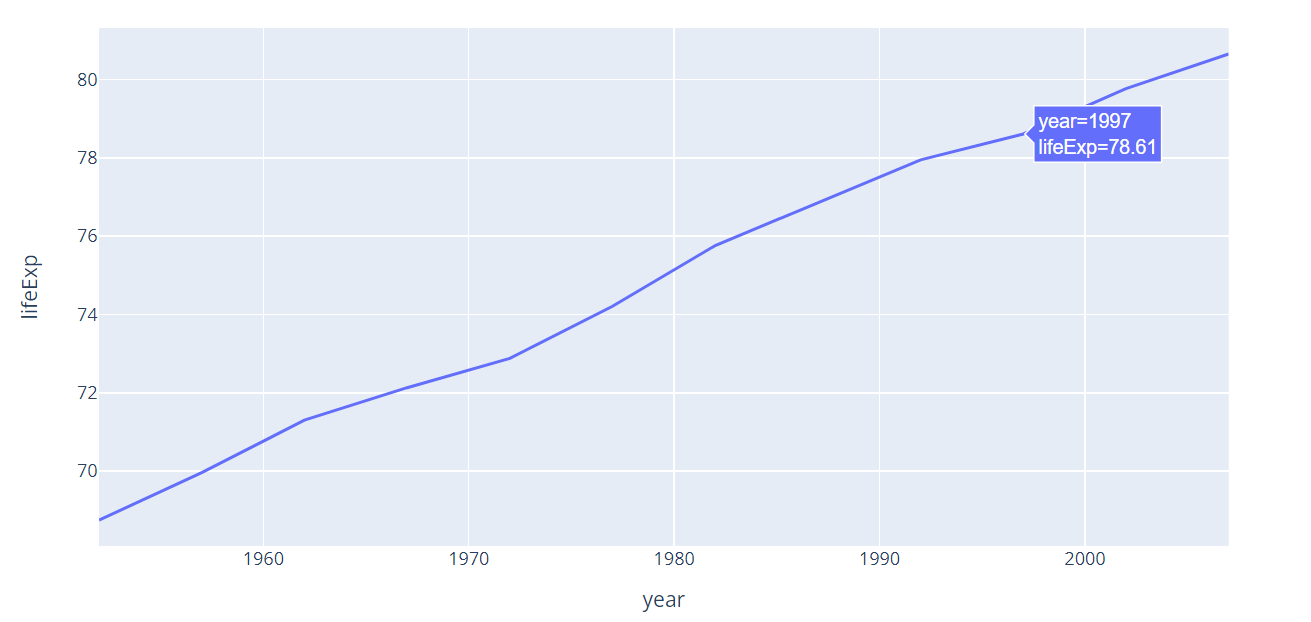 有了它,你可以更细致地分析数据,往往能得到静态图所观察不到的洞见。
### 2.5 itertools
[itertools](https://docs.python.org/3/library/itertools.html)是一个使用率不高但是在某些时候能“拯救你于水火之中”的包。
它主要是提供了各种迭代的操作,如累加、笛卡尔积、连接多个列表等功能。没有它,我们可能需要写一段代码,用上循环等等。而有了它,只需要一句话。
```python
#累加
>>> import itertools
>>> x = itertools.accumulate(range(10))
>>> print(list(x))
[0, 1, 3, 6, 10, 15, 21, 28, 36, 45]
#不重复的所有组合
>>> x = itertools.combinations(range(4), 3)
>>> print(list(x))
[(0, 1, 2), (0, 1, 3), (0, 2, 3), (1, 2, 3)]
```
## 3 小结
正是由于有这么多好用的包,活跃的社区,Python才如此流行,得到人们喜爱。
在使用Python的过程中,希望这些小众而又好用的包能满足你的各种需求,让你的生活轻松一些,美好一些。
有了它,你可以更细致地分析数据,往往能得到静态图所观察不到的洞见。
### 2.5 itertools
[itertools](https://docs.python.org/3/library/itertools.html)是一个使用率不高但是在某些时候能“拯救你于水火之中”的包。
它主要是提供了各种迭代的操作,如累加、笛卡尔积、连接多个列表等功能。没有它,我们可能需要写一段代码,用上循环等等。而有了它,只需要一句话。
```python
#累加
>>> import itertools
>>> x = itertools.accumulate(range(10))
>>> print(list(x))
[0, 1, 3, 6, 10, 15, 21, 28, 36, 45]
#不重复的所有组合
>>> x = itertools.combinations(range(4), 3)
>>> print(list(x))
[(0, 1, 2), (0, 1, 3), (0, 2, 3), (1, 2, 3)]
```
## 3 小结
正是由于有这么多好用的包,活跃的社区,Python才如此流行,得到人们喜爱。
在使用Python的过程中,希望这些小众而又好用的包能满足你的各种需求,让你的生活轻松一些,美好一些。
%20-%20Tail%20Pic.png)