The layout system is responsible for positioning and scaling layout elements such as axis rects, legends, or color scales in a QCustomPlot.
Classes and mechanisms
The layout system is based on the abstract base class QCPLayoutElement. All objects that take part in the layout system derive from this class, either directly or indirectly.
Since QCPLayoutElement itself derives from QCPLayerable, a layout element may draw its own content. However, it is perfectly possible for a layout element to only serve as a structuring and/or positioning element, not drawing anything on its own.
Rects of a layout element
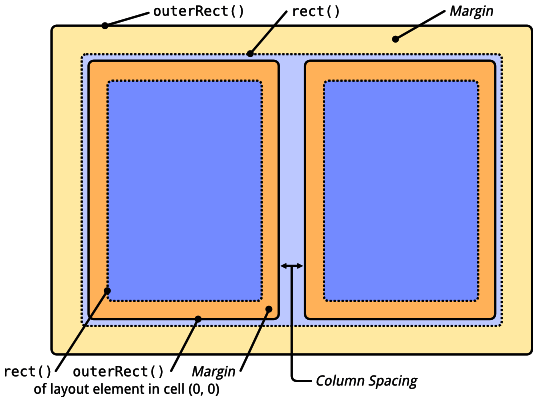
A layout element is a rectangular object described by two rects: the inner rect (QCPLayoutElement::rect) and the outer rect (QCPLayoutElement::setOuterRect). The inner rect is calculated automatically by applying the margin (QCPLayoutElement::setMargins) inward from the outer rect. The inner rect is meant for main content while the margin area may either be left blank or serve for displaying peripheral graphics. For example, QCPAxisRect positions the four main axes at the sides of the inner rect, so graphs end up inside it and the axis labels and tick labels are in the margin area.
Margins
Each layout element may provide a mechanism to automatically determine its margins. Internally, this is realized with the QCPLayoutElement::calculateAutoMargin function which takes a QCP::MarginSide and returns an integer value which represents the ideal margin for the specified side. The automatic margin will be used on the sides specified in QCPLayoutElement::setAutoMargins. By default, it is set to QCP::msAll meaning automatic margin calculation is enabled for all four sides. In this case, a minimum margin may be set with QCPLayoutElement::setMinimumMargins, to prevent the automatic margin mechanism from setting margins smaller than desired for a specific situation. If automatic margin calculation is unset for a specific side, the margin of that side can be controlled directy via QCPLayoutElement::setMargins.
If multiple layout ements are arranged next to or beneath each other, it may be desirable to align their inner rects on certain sides. Since they all might have different automatic margins, this usually isn't the case. The class QCPMarginGroup and QCPLayoutElement::setMarginGroup fix this by allowing to synchronize multiple margins. See the documentation there for details.
Layouts
As mentioned, a QCPLayoutElement may have an arbitrary number of child layout elements and in princple can have the only purpose to manage/arrange those child elements. This is what the subclass QCPLayout specializes on. It is a QCPLayoutElement itself but has no visual representation. It defines an interface to add, remove and manage child layout elements. QCPLayout isn't a usable layout though, it's an abstract base class that concrete layouts derive from, like QCPLayoutGrid which arranges its child elements in a grid and QCPLayoutInset which allows placing child elements freely inside its rect.
Since a QCPLayout is a layout element itself, it may be placed inside other layouts. This way, complex hierarchies may be created, offering very flexible arrangements.
Below is a sketch of the default QCPLayoutGrid accessible via QCustomPlot::plotLayout. It shows how two child layout elements are placed inside the grid layout next to each other in cells (0, 0) and (0, 1).
The top level plot layout
Every QCustomPlot has one top level layout of type QCPLayoutGrid. It is accessible via QCustomPlot::plotLayout and contains (directly or indirectly via other sub-layouts) all layout elements in the QCustomPlot. By default, this top level grid layout contains a single cell which holds the main axis rect.
Examples
Adding a plot title is a typical and simple case to demonstrate basic workings of the layout system.
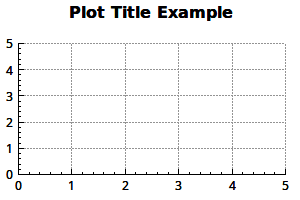
| // first we create and prepare a text layout element: title->setText("Plot Title Example"); title->setFont(QFont("sans", 12, QFont::Bold)); // then we add it to the main plot layout: customPlot->plotLayout()->insertRow(0); // insert an empty row above the axis rect customPlot->plotLayout()->addElement(0, 0, title); // place the title in the empty cell we've just created |
Adding custom elements to the legend is quite simple, since the QCPLegend is itself just a subclass of QCPLayoutGrid. So we can manipulate it just like the main plot layout as before:
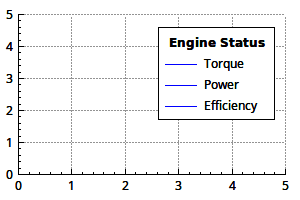
| // prepare legend and some graphs: customPlot->legend->setVisible(true); customPlot->addGraph()->setName("Torque"); customPlot->addGraph()->setName("Power"); customPlot->addGraph()->setName("Efficiency"); // create and prepare a text layout element: legendTitle->setLayer(customPlot->legend->layer()); // place text element on same layer as legend, or it ends up below legend legendTitle->setText("Engine Status"); legendTitle->setFont(QFont("sans", 9, QFont::Bold)); // then we add it to the QCPLegend (which is a subclass of QCPLayoutGrid): if (customPlot->legend->hasElement(0, 0)) // if top cell isn't empty, insert an empty row at top customPlot->legend->insertRow(0); customPlot->legend->addElement(0, 0, legendTitle); // place the text element into the empty cell |
Moving the legend outside the axis rect can be achieved as follows:
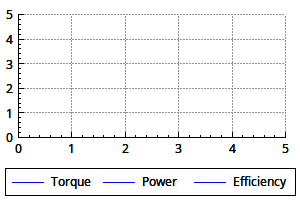
| // prepare some graphs: customPlot->legend->setVisible(true); customPlot->addGraph()->setName("Torque"); customPlot->addGraph()->setName("Power"); customPlot->addGraph()->setName("Efficiency"); // now we move the legend from the inset layout of the axis rect into the main grid layout. // We create a sub layout so we can generate a small gap between the plot layout cell border // and the legend border: customPlot->plotLayout()->addElement(1, 0, subLayout); subLayout->setMargins(QMargins(5, 0, 5, 5)); subLayout->addElement(0, 0, customPlot->legend); // change the fill order of the legend, so it's filled left to right in columns: customPlot->legend->setFillOrder(QCPLegend::foColumnsFirst); // set legend's row stretch factor very small so it ends up with minimum height: customPlot->plotLayout()->setRowStretchFactor(1, 0.001); |
Arranging multiple axis rects actually is the central purpose of the layout system.
| customPlot->plotLayout()->clear(); // let's start from scratch and remove the default axis rect // add the first axis rect in second row (row index 1): customPlot->plotLayout()->addElement(1, 0, bottomAxisRect); // create a sub layout that we'll place in first row: customPlot->plotLayout()->addElement(0, 0, subLayout); // add two axis rects in the sub layout next to each other: subLayout->addElement(0, 0, leftAxisRect); subLayout->addElement(0, 1, rightAxisRect); subLayout->setColumnStretchFactor(0, 3); // left axis rect shall have 60% of width subLayout->setColumnStretchFactor(1, 2); // right one only 40% (3:2 = 60:40) // since we've created the axis rects and axes from scratch, we need to place them on // according layers, if we don't want the grid to be drawn above the axes etc. // place the axis on "axes" layer and grids on the "grid" layer, which is below "axes": QList<QCPAxis*> allAxes; foreach (QCPAxis *axis, allAxes) { axis->setLayer("axes"); } |