 [Slides](https://www.slideshare.net/AlexeyGrigorev/ml-zoomcamp-2-slides)
## Notes
**Pandas attributes and methods:**
* `df[col].unique()` -> return a list of unique values in the series
* `df[col].nunique()` -> return the number of unique values in the series
* `df.isnull().sum()` -> return the number of null values in the dataframe
**Matplotlib and seaborn methods:**
* `%matplotlib inline` -> assure that plots are displayed in jupyter notebook's cells
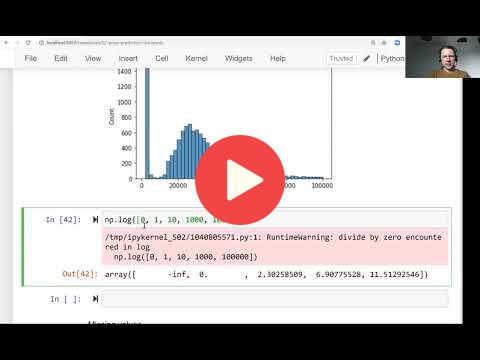
* `sns.histplot()` -> show the histogram of a series
**Numpy methods:**
* `np.log1p()` -> apply log transformation to a variable, after adding one to each input value.
Long-tail distributions usually confuse the ML models, so the recommendation is to transform the target variable distribution to a normal one whenever possible.
The entire code of this project is available in [this jupyter notebook](https://github.com/alexeygrigorev/mlbookcamp-code/blob/master/chapter-02-car-price/02-carprice.ipynb).
[Slides](https://www.slideshare.net/AlexeyGrigorev/ml-zoomcamp-2-slides)
## Notes
**Pandas attributes and methods:**
* `df[col].unique()` -> return a list of unique values in the series
* `df[col].nunique()` -> return the number of unique values in the series
* `df.isnull().sum()` -> return the number of null values in the dataframe
**Matplotlib and seaborn methods:**
* `%matplotlib inline` -> assure that plots are displayed in jupyter notebook's cells
* `sns.histplot()` -> show the histogram of a series
**Numpy methods:**
* `np.log1p()` -> apply log transformation to a variable, after adding one to each input value.
Long-tail distributions usually confuse the ML models, so the recommendation is to transform the target variable distribution to a normal one whenever possible.
The entire code of this project is available in [this jupyter notebook](https://github.com/alexeygrigorev/mlbookcamp-code/blob/master/chapter-02-car-price/02-carprice.ipynb).
| ⚠️ |
The notes are written by the community. If you see an error here, please create a PR with a fix. |