# FielDHub  [](https://cran.r-project.org/package=FielDHub)
[](https://github.com/DidierMurilloF/FielDHub/actions/workflows/R-CMD-check.yaml)
[](https://lifecycle.r-lib.org/articles/stages.html)
[](https://cranlogs.r-pkg.org/badges/FielDHub)
[](https://cranlogs.r-pkg.org/badges/grand-total/FielDHub)
[](https://doi.org/10.21105/joss.03122)
## Design of experiments for life sciences
FielDHub is an R package and Shiny app that randomizes field, greenhouse
and laboratory experiments. It covers classic designs, such as
completely randomized, complete block, Latin square, factorial and
split-plot designs, and the unreplicated, augmented and partially
replicated designs used in plant breeding. It serves agriculture, plant
breeding, forestry, and animal and biological sciences.
Every design comes with a field map and a field book. Every design in
the app is also an R function with the same arguments, so a script can
reproduce what the app made.
## What’s new in 1.7.0
- **A new design.** `augmented_row_column()` builds augmented row-column
designs, in which every check appears once in every row or every
column of the field. It has its own page in the app under Unreplicated
Designs.
- **One style for every field map.** One muted colour per replication or
block, white alleys between them, grey lines around incomplete blocks,
a white grid around every plot, and one muted colour per check.
- **Better partially replicated designs.** An optional rule keeps the
copies of an entry in distinct rows and columns (`rowcol_penalty`),
and the spreading optimizer is much faster.
- **A refreshed app.** New Welcome, Help and About pages: the Welcome
page links to every design, and Help gives each design its guide,
reference page and offline `help()` command.
See the [release notes](NEWS.md) for every change, including the changes
to results for a given seed.
## Installation
From CRAN:
``` r
install.packages("FielDHub")
```
The development version, from GitHub:
``` r
remotes::install_github("DidierMurilloF/FielDHub")
```
## Launch the app
``` r
library(FielDHub)
run_app()
```
The app’s dependencies install with the package, and it needs Shiny
1.8.1 or newer. To keep other sessions responsive while a long design
runs, install `mirai` and start the app with `run_app(workers = 2L)`.
Workers need an installed FielDHub; without `mirai`, or when running
from the package source, designs run in the app’s own session.
## Designs
FielDHub has 21 designs, grouped as in the app’s menus. Each links to
its reference page.
| Menu | Design | R function |
|:-----------------------------|:-----------------------------------------|:------------------------------------------------------------------------------------------------------------|
| Unreplicated Designs | Single Diagonal Arrangement | [`diagonal_arrangement()`](https://didiermurillof.github.io/FielDHub/reference/diagonal_arrangement.html) |
| | Multiple Diagonal Arrangement | [`diagonal_arrangement()`](https://didiermurillof.github.io/FielDHub/reference/diagonal_arrangement.html) |
| | Optimized Arrangement | [`optimized_arrangement()`](https://didiermurillof.github.io/FielDHub/reference/optimized_arrangement.html) |
| | Augmented RCBD | [`RCBD_augmented()`](https://didiermurillof.github.io/FielDHub/reference/RCBD_augmented.html) |
| | Augmented Row-Column | [`augmented_row_column()`](https://didiermurillof.github.io/FielDHub/reference/augmented_row_column.html) |
| | Sparse Allocation | [`sparse_allocation()`](https://didiermurillof.github.io/FielDHub/reference/sparse_allocation.html) |
| Partially Replicated Designs | Single and Multi-Location p-rep | [`partially_replicated()`](https://didiermurillof.github.io/FielDHub/reference/partially_replicated.html) |
| | Optimized Multi-Location p-rep | [`multi_location_prep()`](https://didiermurillof.github.io/FielDHub/reference/multi_location_prep.html) |
| Lattice Designs | Square Lattice | [`square_lattice()`](https://didiermurillof.github.io/FielDHub/reference/square_lattice.html) |
| | Rectangular Lattice | [`rectangular_lattice()`](https://didiermurillof.github.io/FielDHub/reference/rectangular_lattice.html) |
| | Alpha Lattice: alpha(0,1) | [`alpha_lattice()`](https://didiermurillof.github.io/FielDHub/reference/alpha_lattice.html) |
| Other Designs | Completely Randomized Design (CRD) | [`CRD()`](https://didiermurillof.github.io/FielDHub/reference/CRD.html) |
| | Randomized Complete Block Designs (RCBD) | [`RCBD()`](https://didiermurillof.github.io/FielDHub/reference/RCBD.html) |
| | Latin Square Design (LSD) | [`latin_square()`](https://didiermurillof.github.io/FielDHub/reference/latin_square.html) |
| | Latin Rectangle Design | [`latin_rectangle()`](https://didiermurillof.github.io/FielDHub/reference/latin_rectangle.html) |
| | Factorial Designs | [`full_factorial()`](https://didiermurillof.github.io/FielDHub/reference/full_factorial.html) |
| | Split-Plot Design | [`split_plot()`](https://didiermurillof.github.io/FielDHub/reference/split_plot.html) |
| | Split-Split-Plot Design | [`split_split_plot()`](https://didiermurillof.github.io/FielDHub/reference/split_split_plot.html) |
| | Strip-Plot Design | [`strip_plot()`](https://didiermurillof.github.io/FielDHub/reference/strip_plot.html) |
| | Incomplete Blocks Design (IBD) | [`incomplete_blocks()`](https://didiermurillof.github.io/FielDHub/reference/incomplete_blocks.html) |
| | Resolvable Row-Column Design (RRCD) | [`row_column()`](https://didiermurillof.github.io/FielDHub/reference/row_column.html) |
## What you get
- **A field map** of every location, ready for reports.
- **A field book** with plot numbers, rows, columns and entries, to
download and load into a database or field app.
- **Simulated data.** The app can simulate a response variable along
with the randomization, for teaching and for testing an analysis
before the season.
- **A reproducible record.** `write_design()` saves a design or a
standalone replay script, `read_design()` reads it back, and
`reproduce_design()` rebuilds it from its recorded inputs and seed.
## Example: a multiple diagonal arrangement
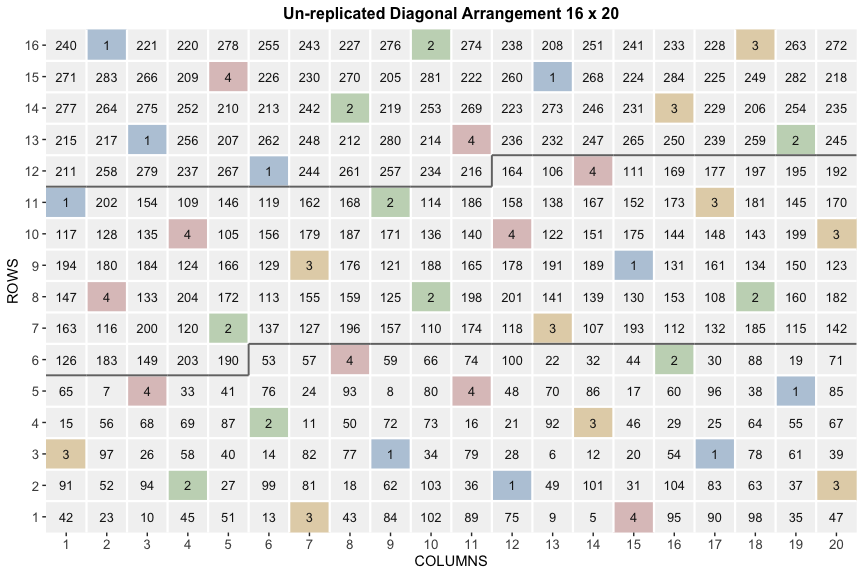
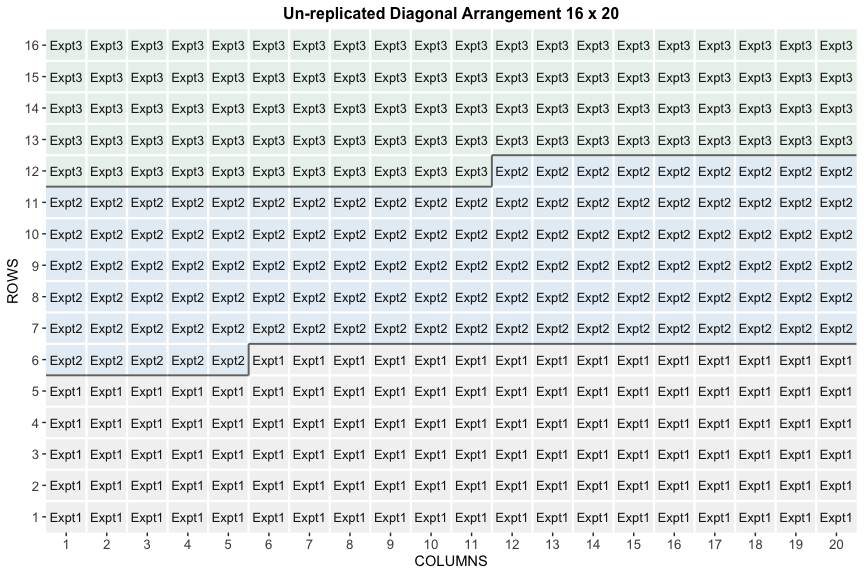
A project needs to test 280 genotypes in a field of 16 rows and 20
columns, split among three experiments. Four checks are placed on
diagonals across the experiments and fill 40 plots, 12.5% of the field.
To get the same design in the app and in a script, use the same seed,
here 1249.
``` r
diagonal <- diagonal_arrangement(
nrows = 16,
ncols = 20,
lines = 280,
checks = 4,
plotNumber = 101,
splitBy = "row",
seed = 1249,
kindExpt = "DBUDC",
blocks = c(100, 100, 80),
exptName = c("Expt1", "Expt2", "Expt3")
)
```
A summary of the design:
``` r
print(diagonal)
Un-replicated Diagonal Arrangement Design
Information on the design parameters:
List of 11
$ rows : num 16
$ columns : num 20
$ treatments : num [1:3] 100 100 80
$ checks : int 4
$ entry_checks :List of 1
..$ : int [1:4] 1 2 3 4
$ rep_checks :List of 1
..$ : num [1:4] 10 10 10 10
$ locations : num 1
$ planter : chr "serpentine"
$ percent_checks: chr "12.5%"
$ fillers : num 0
$ seed : num 1249
10 First observations of the data frame with the diagonal_arrangement field book:
ID EXPT LOCATION YEAR PLOT ROW COLUMN CHECKS ENTRY TREATMENT
1 1 Expt1 1 2026 101 1 1 0 42 Gen-42
2 2 Expt1 1 2026 102 1 2 0 23 Gen-23
3 3 Expt1 1 2026 103 1 3 0 10 Gen-10
4 4 Expt1 1 2026 104 1 4 0 45 Gen-45
5 5 Expt1 1 2026 105 1 5 0 51 Gen-51
6 6 Expt1 1 2026 106 1 6 0 13 Gen-13
7 7 Expt1 1 2026 107 1 7 3 3 Check-3
8 8 Expt1 1 2026 108 1 8 0 43 Gen-43
9 9 Expt1 1 2026 109 1 9 0 84 Gen-84
10 10 Expt1 1 2026 110 1 10 0 102 Gen-102
```
The first 12 rows of the field book:
``` r
head(diagonal$fieldBook, 12)
ID EXPT LOCATION YEAR PLOT ROW COLUMN CHECKS ENTRY TREATMENT
1 1 Expt1 1 2026 101 1 1 0 42 Gen-42
2 2 Expt1 1 2026 102 1 2 0 23 Gen-23
3 3 Expt1 1 2026 103 1 3 0 10 Gen-10
4 4 Expt1 1 2026 104 1 4 0 45 Gen-45
5 5 Expt1 1 2026 105 1 5 0 51 Gen-51
6 6 Expt1 1 2026 106 1 6 0 13 Gen-13
7 7 Expt1 1 2026 107 1 7 3 3 Check-3
8 8 Expt1 1 2026 108 1 8 0 43 Gen-43
9 9 Expt1 1 2026 109 1 9 0 84 Gen-84
10 10 Expt1 1 2026 110 1 10 0 102 Gen-102
11 11 Expt1 1 2026 111 1 11 0 89 Gen-89
12 12 Expt1 1 2026 112 1 12 0 75 Gen-75
```
The field map. Each check has its own muted colour and appears
throughout the field; the grey lines mark where each experiment starts
and ends.
``` r
plot(diagonal)
```
 The same field by experiment:
``` r
plot(diagonal, text.string = "EXPT")
```
 In the app you can also choose how many filler plots to add and where.
The R function adds fillers only when the experiments do not fill the
field.
More examples are in the [diagonal arrangement
article](https://didiermurillof.github.io/FielDHub/articles/diagonal_arrangement.html).
## Example: a partially replicated design
Partially replicated (p-rep) designs are common in early-generation
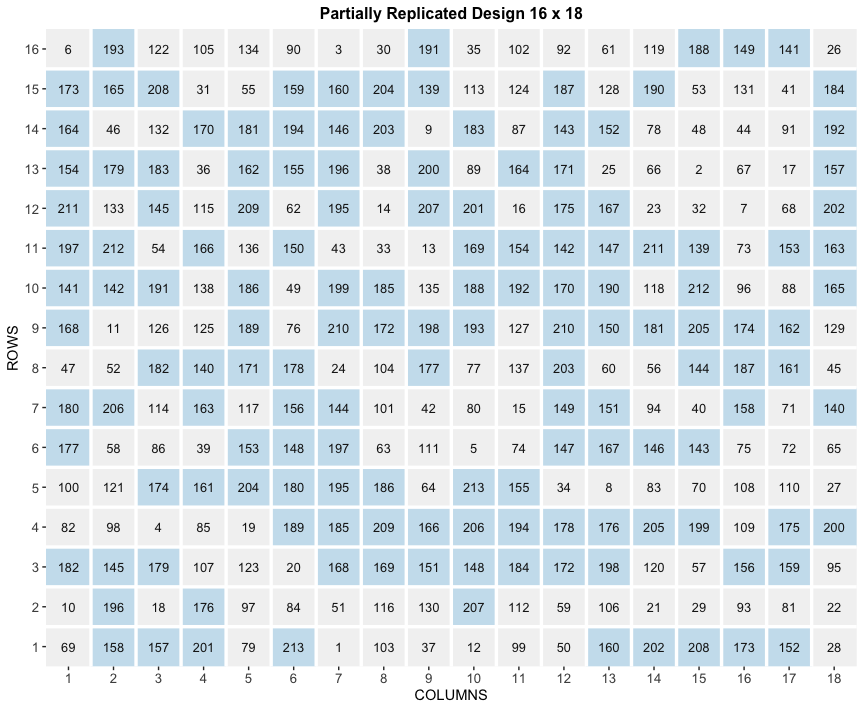
trials: some entries are replicated and the rest appear once. Here 75
entries appear twice and 138 entries once, in a field of 16 rows and 18
columns (288 plots), with seed 77.
``` r
pREP <- partially_replicated(
nrows = 16,
ncols = 18,
repGens = c(138, 75),
repUnits = c(1, 2),
planter = "serpentine",
plotNumber = 1,
exptName = "ExptA",
locationNames = "FARGO",
seed = 77
)
```
A summary of the design:
``` r
print(pREP)
Partially Replicated Design
Replications within location:
LOCATION Replicated Unreplicated
1 FARGO 75 138
Information on the design parameters:
List of 10
$ rows : num 16
$ columns : num 18
$ min_distance : num 5
$ incidence_in_rows : num 1
$ locations : num 1
$ planter : chr "serpentine"
$ experimental_plots: num 288
$ field_capacity : num 288
$ fillers : num 0
$ seed : num 77
10 First observations of the data frame with the partially_replicated field book:
# A tibble: 10 × 11
ID EXPT LOCATION YEAR PLOT ROW COLUMN REP CHECKS ENTRY TREATMENT
1 1 ExptA FARGO 2026 1 1 1 1 0 69 G69
2 2 ExptA FARGO 2026 2 1 2 1 158 158 G158
3 3 ExptA FARGO 2026 3 1 3 1 157 157 G157
4 4 ExptA FARGO 2026 4 1 4 1 201 201 G201
5 5 ExptA FARGO 2026 5 1 5 1 0 79 G79
6 6 ExptA FARGO 2026 6 1 6 1 213 213 G213
7 7 ExptA FARGO 2026 7 1 7 1 0 1 G1
8 8 ExptA FARGO 2026 8 1 8 1 0 103 G103
9 9 ExptA FARGO 2026 9 1 9 1 0 37 G37
10 10 ExptA FARGO 2026 10 1 10 1 0 12 G12
```
The first 12 rows of the field book:
``` r
head(pREP$fieldBook, 12)
# A tibble: 12 × 11
ID EXPT LOCATION YEAR PLOT ROW COLUMN REP CHECKS ENTRY TREATMENT
1 1 ExptA FARGO 2026 1 1 1 1 0 69 G69
2 2 ExptA FARGO 2026 2 1 2 1 158 158 G158
3 3 ExptA FARGO 2026 3 1 3 1 157 157 G157
4 4 ExptA FARGO 2026 4 1 4 1 201 201 G201
5 5 ExptA FARGO 2026 5 1 5 1 0 79 G79
6 6 ExptA FARGO 2026 6 1 6 1 213 213 G213
7 7 ExptA FARGO 2026 7 1 7 1 0 1 G1
8 8 ExptA FARGO 2026 8 1 8 1 0 103 G103
9 9 ExptA FARGO 2026 9 1 9 1 0 37 G37
10 10 ExptA FARGO 2026 10 1 10 1 0 12 G12
11 11 ExptA FARGO 2026 11 1 11 1 0 99 G99
12 12 ExptA FARGO 2026 12 1 12 1 0 50 G50
```
The field map. Replicated entries are on soft blue and the rest on light
grey.
``` r
plot(pREP)
```
 More examples are in the [partially replicated
article](https://didiermurillof.github.io/FielDHub/articles/partially_replicated.html).
## For teaching
FielDHub is used in courses on statistics, experimental design and plant
breeding. Students see the randomization, the field layout and the data
in one place; simulated responses give them a data set to analyse from
the first class; and because every design is an R function with a seed,
an assignment can give each student the same randomization, or a
different one.
## Documentation and help
- The [FielDHub website](https://didiermurillof.github.io/FielDHub/) has
a guide for every design, worked examples and the function reference.
- In R, `help("diagonal_arrangement", package = "FielDHub")` and the
other help pages work offline.
- [Video
tutorials](https://www.youtube.com/channel/UC4i3oTcU58Za42DbWwqF9Kg)
walk through the app.
- Found a bug or missing a design? [Open an
issue](https://github.com/DidierMurilloF/FielDHub/issues).
## Citation
If you use FielDHub, please cite the paper in the Journal of Open Source
Software. Run `citation("FielDHub")` in R for the reference.
## Contributing
Contributions are welcome; see the [contributing guide](CONTRIBUTING.md)
and the [code of conduct](CODE_OF_CONDUCT.md).
FielDHub is developed at [Agricultural Data
Analytics](https://www.ndsu.edu/agricultural-data-analytics), North
Dakota State University.