Peer-Graded Assignment: Building a dashboard with Cognos Dashboard Embedded (CDE)
Estimated time needed: 45 minutes
In this assignment, you will create some visualizations and add them to dashboards using Cognos Dashboard Embedded (CDE).
Software Used in this Assignment
In this assignment you will use the free lite plan version of Cognos Dashboard Embedded (CDE) through IBM Cloud.
Dataset Used in this Assignment
The dataset you are going to use in this assignment comes from the following source: https://stackoverflow.blog/2019/04/09/the-2019-stack-overflow-developer-survey-results-are-in/ under a ODbL: Open Database License.
We are using a modified subset of that dataset for the assignment, so to follow the assigment instructions successfully, please use the dataset provided with the assignment, rather than the dataset from the original source.
Guidelines for the Submission
-
Download the 2 files m5_survey_data_demographics.csv and m5_survey_data_technologies_normalised.csv. Upload these 2 CSV files as data assets to your project in CDE.
-
Create 3 dashboards (3 separate tabs under a single dashboard) as follows:
-
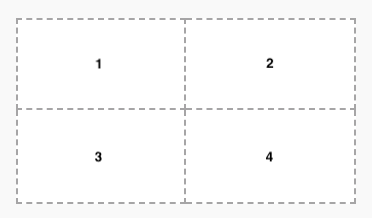
One dashboard using the 2 x 2 rectangle areas tabbed template - rename this dashboard tab to Current Technology Usage.
-
One dashboard using the 2 x 2 rectangle areas tabbed template - rename this dashboard tab to Future Technology Trend.
-
One dashboard using the 2 x 2 rectangle areas tabbed template - rename this dashboard tab to Demographics.
-
On the Current Technology Usage dashboard tab, use the data asset m5_survey_data_technologies_normalised.csv and capture the following metrics as visualizations:
-
In the first rectangle (Panel 1):
- Capture Top 10 LanguageWorkedWith.
- Visualize as a Bar chart.
- Utilize Bars, Length, Color fields of Bar chart.
- Include Show value labels feature.
- Include a proper Chart title.
-
In the second rectangle (Panel 2):
- Capture Top 10 DatabaseWorkedWith.
- Visualize as a Column chart.
- Utilize Bars, Length, Color fields of Column chart.
- Include Show value labels feature.
- Include a proper Chart title.
-
In the third rectangle (Panel 3):
- Capture PlatformWorkedWith.
- Visualize as a Word cloud chart.
- Utilize Words, Size, Color fields of Word cloud chart.
- Include a proper Chart title.
-
In the fourth rectangle (Panel 4):
- Capture Top 10 WebFrameWorkedWith.
- Visualize as a Hierarchy bubble chart.
- Utilize Bubbles, Size, Color fields of Hierarchy bubble chart.
- Include a proper Chart title.
-
On the Future Technology Trend dashboard tab, use the data asset m5_survey_data_technologies_normalised.csv and capture the following metrics as visualizations:
-
In the first rectangle (Panel 1):
- Capture Top 10 LanguageDesireNextYear.
- Visualize as a Bar chart.
- Utilize Bars, Length, Color fields of Bar chart.
- Include Show value labels feature.
- Include a proper Chart title.
-
In the second rectangle (Panel 2):
- Capture Top 10 DatabaseDesireNextYear.
- Visualize as a Column chart.
- Utilize Bars, Length, Color fields of Column chart.
- Include Show value labels feature.
- Include a proper Chart title.
-
In the third rectangle (Panel 3):
- capture PlatformDesireNextYear.
- Visualize as a Tree map chart.
- Utilize Area hierarchy, Size, Heat fields of Tree map chart.
- Include Contrast label color feature.
- Include a proper Chart title.
-
In the fourth rectangle (Panel 4):
- Capture Top 10 WebFrameDesireNextYear.
- Visualize as a Hierarchy bubble chart.
- Utilize Bubbles, Size, Color fields of Hierarchy bubble chart.
- Include a proper Chart title.
-
On the Demographics dashboard tab, use the data asset m5_survey_data_demographics.csv and capture the following metrics as visualizations:
-
Use Filters for this tab feature to filter out entries of other types except Man and Woman from the data point Gender.
-
In the first rectangle (Panel 1):
- Capture Respondent classified by Gender.
- Visualize as a Pie chart.
- Utilize Segments, Size fields of Pie chart.
- Include Dispay % feature.
- Include a proper Chart title.
-
In the second rectangle (Panel 2):
- Capture Respondent Count for Countries.
- Visualize as a Map chart.
- Utilize Regions-Locations, Regions-Location color fields of Map chart.
- Include a proper Chart title.
-
In the third rectangle (Panel 3):
- Capture Respondent Count by Age.
- Visualize as a Line chart.
- Utilize x-axis, y-axis fields of Line chart.
- Include Show value labels feature.
- Include Show markers feature.
- Include a proper Chart title.
-
In the fourth rectangle (Panel 4):
- Capture Respondent Count by Gender, classified by Formal Education Level.
- Visualize as a Stacked bar chart.
- Utilize Bars, Length, Color fields of Stacked bar chart.
- Include Show value labels feature.
- Include a proper Chart title.
-
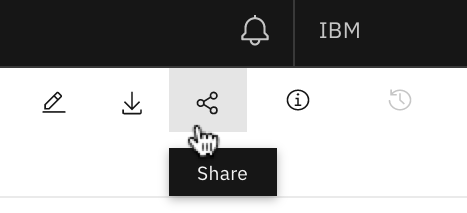
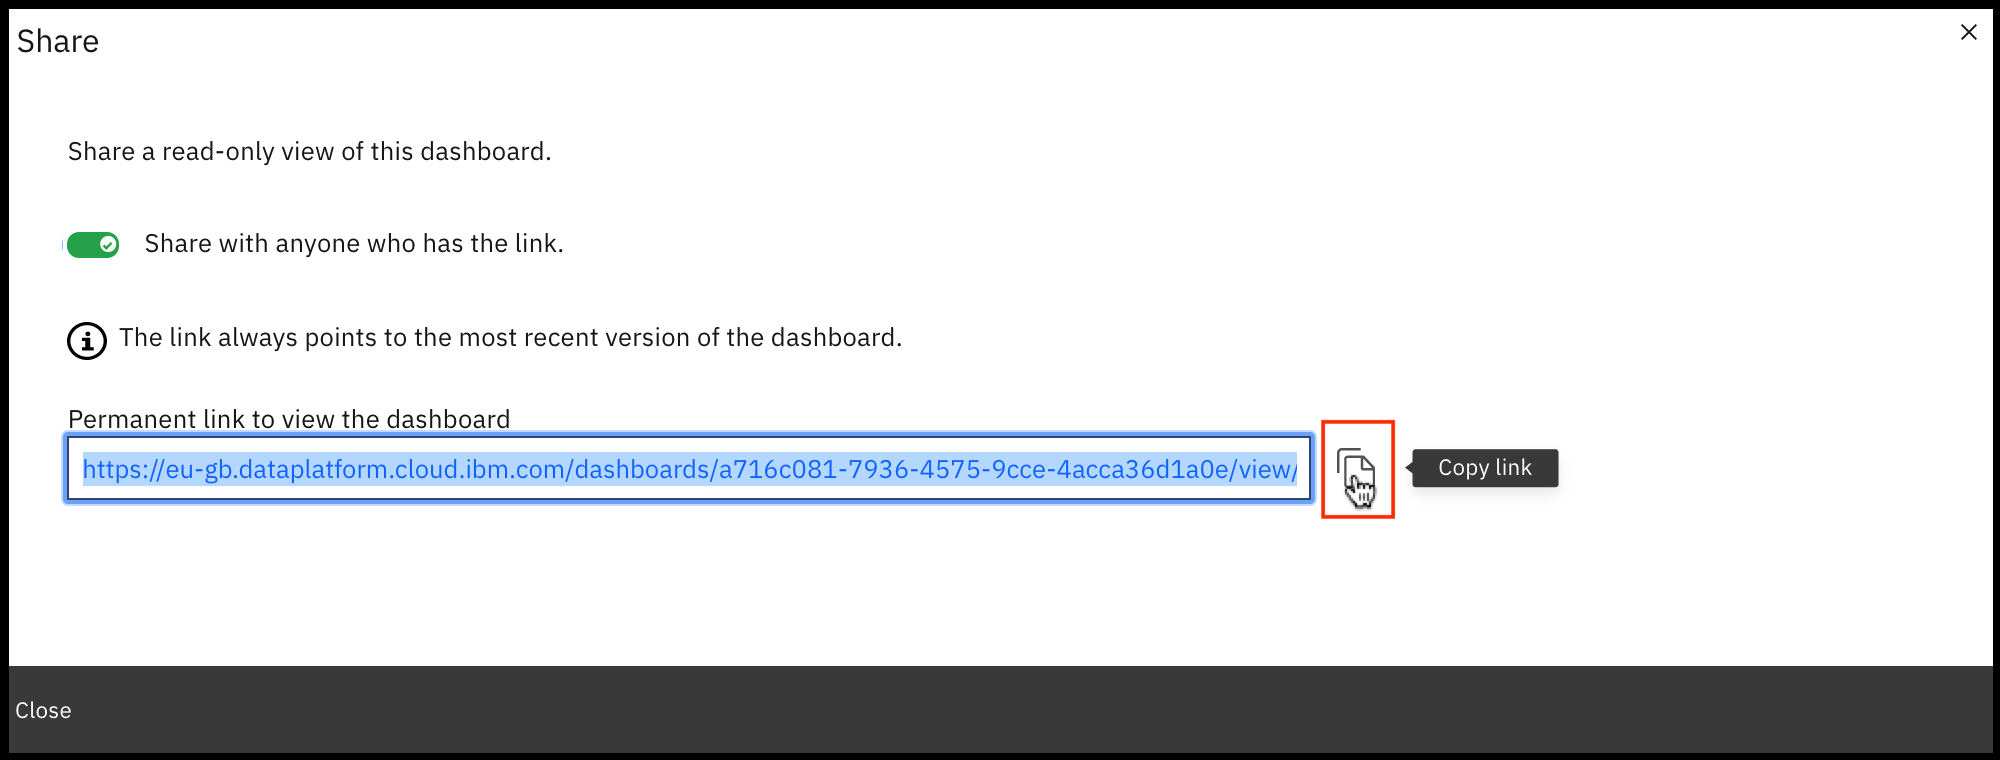
To get the Permanent link of read-only view of the dashboard, follow instructions below:
Grading Information
For your assignment to be graded in a subsequent step in this module, you will be required to submit the permanent link of read-only view of the dashboard you got in Task 6.
The main grading criteria will be:
- Have you provided permanent read-only view CDE link which opens your valid Cognos dashboard?
- Have the correct tabs been created?
- Have you created the required number of visualizations for each tab of the dashboard?
- Have you captured the correct metrics, chart types, chart features and titles for each visualization?
- Are the results correct?
You will not be judged on:
- Your English language, including spelling or grammatical mistakes.
Author(s)
Other Contributor(s)
Changelog
| Date |
Version |
Changed by |
Change Description |
| 2020-10-23 |
1.0 |
Sandip Saha Joy |
Initial version created |
© IBM Corporation 2020. All rights reserved.