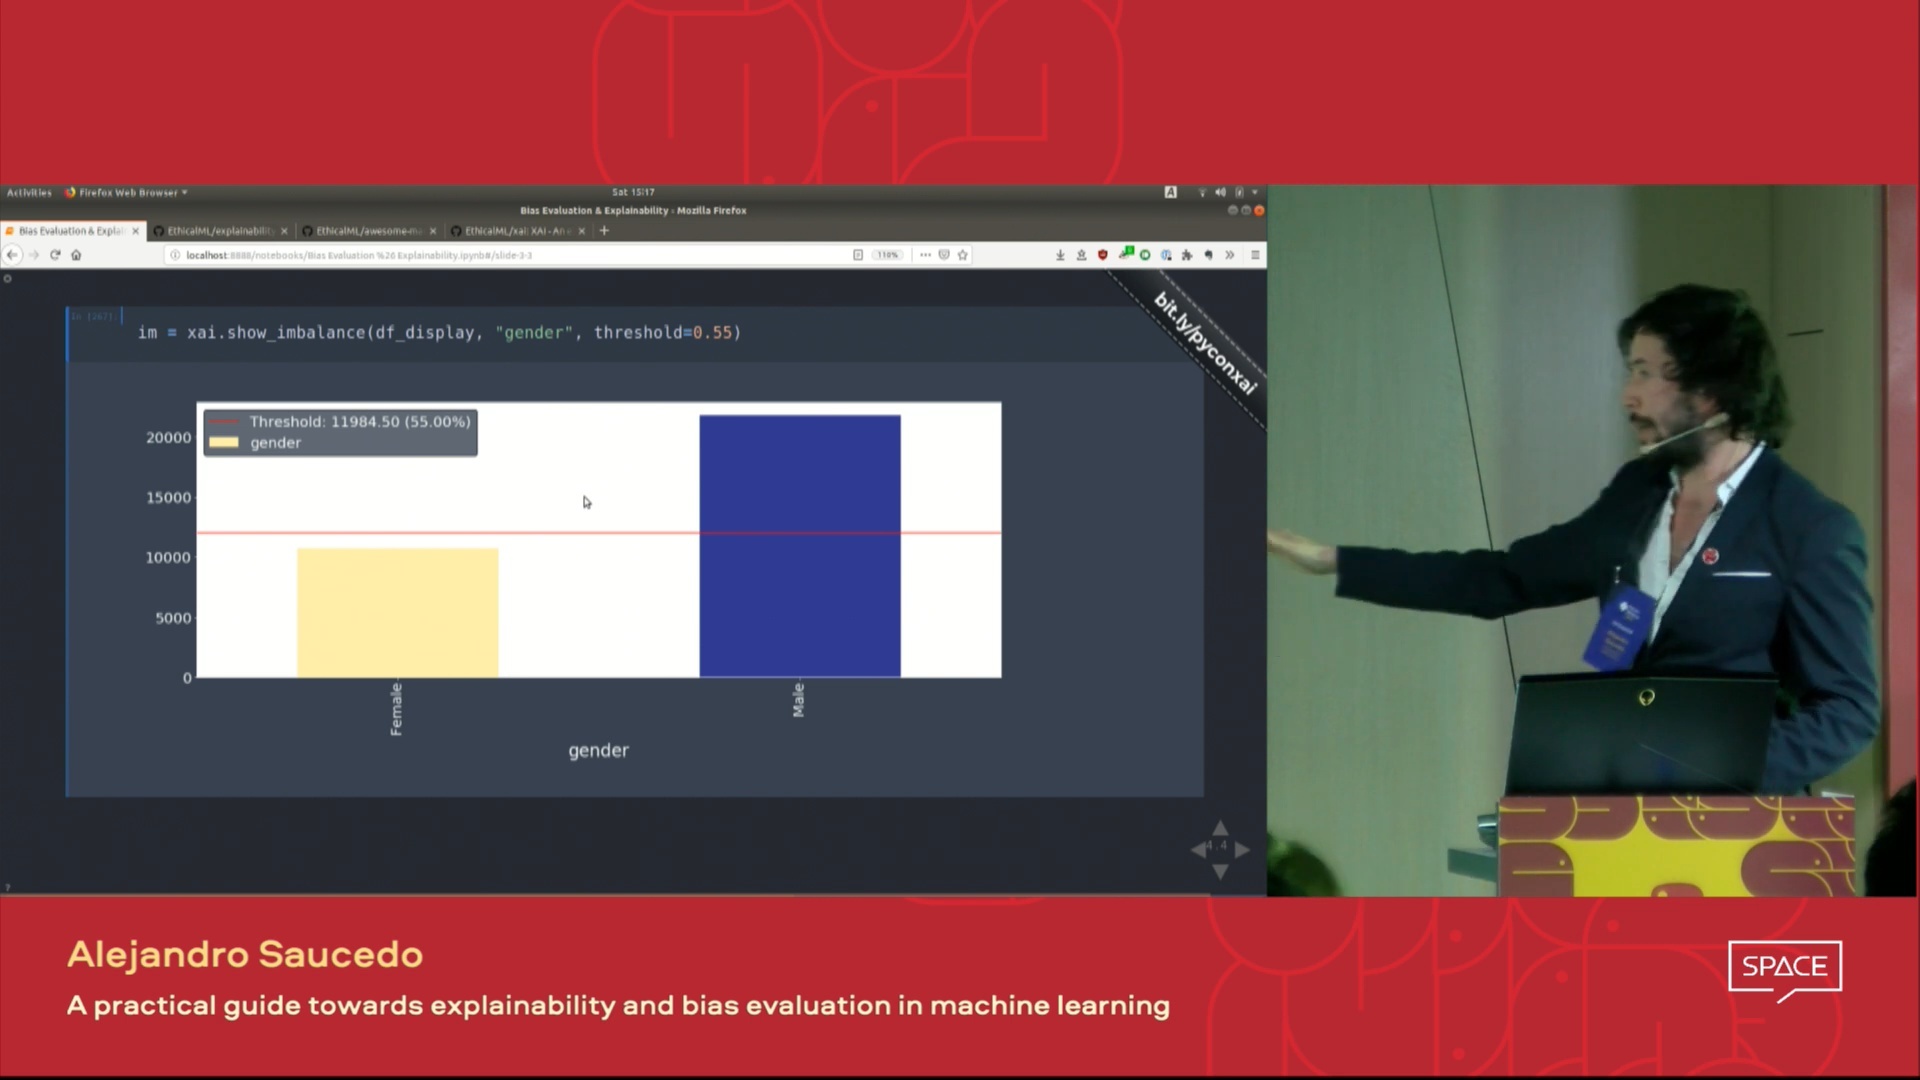

| This video of the talk presented at the PyData London 2019 Conference which provides an overview on the motivations for machine learning explainability as well as techniques to introduce explainability and mitigate undesired biases using the XAI Library. |
|
| Do you want to learn about more awesome machine learning explainability tools? Check out our community-built "Awesome Machine Learning Production & Operations" list which contains an extensive list of tools for explainability, privacy, orchestration and beyond. |
|
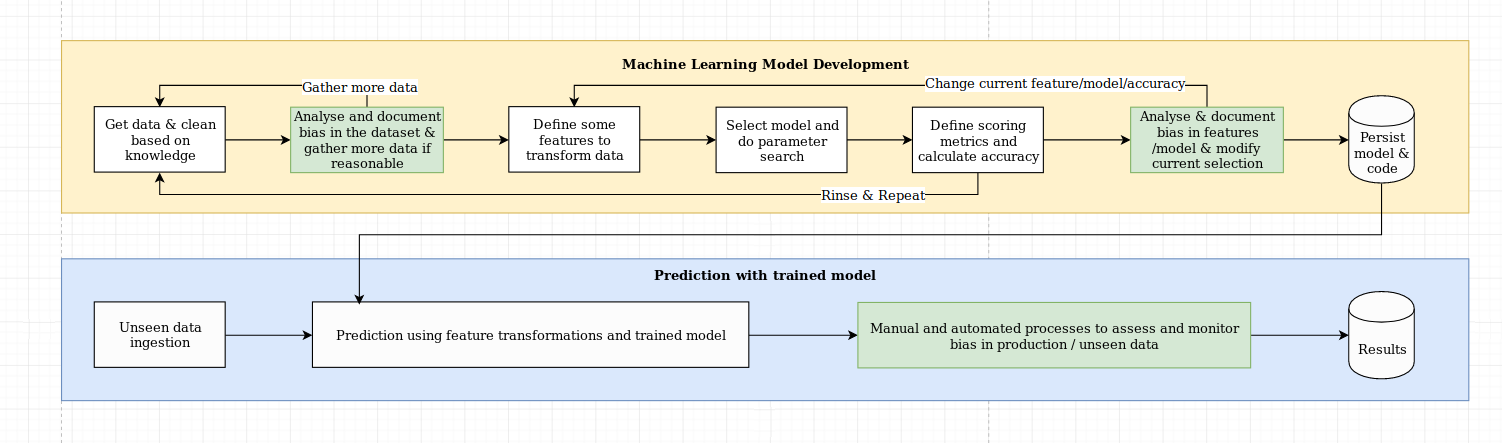 # XAI Quickstart
## Installation
### Prerequisites
First, install [uv](https://github.com/astral-sh/uv), a fast Python package manager:
```bash
curl -LsSf https://astral.sh/uv/install.sh | sh
```
### Install XAI
The XAI package is on PyPI. To install you can run:
```bash
uv pip install xai
```
Alternatively you can install from source by cloning the repo and running:
```bash
uv pip install -e .
```
### Additional Commands
To clean build artifacts and cache files:
```bash
uv run xai-clean
```
## Usage
You can find example usage in the examples folder.
### 1) Data Analysis
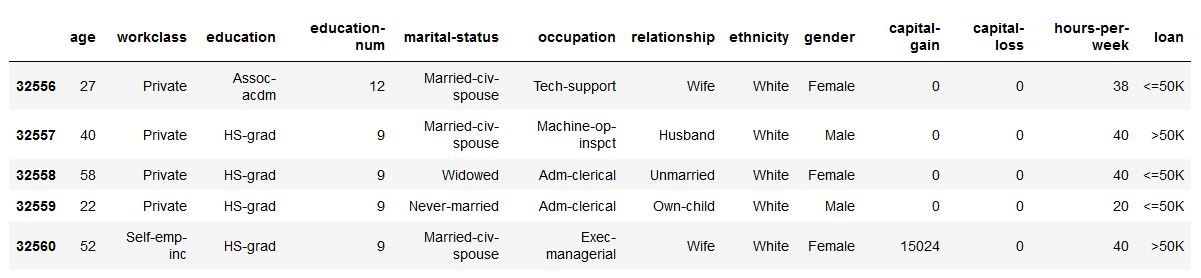
With XAI you can identify imbalances in the data. For this, we will load the census dataset from the XAI library.
``` python
import xai.data
df = xai.data.load_census()
df.head()
```
# XAI Quickstart
## Installation
### Prerequisites
First, install [uv](https://github.com/astral-sh/uv), a fast Python package manager:
```bash
curl -LsSf https://astral.sh/uv/install.sh | sh
```
### Install XAI
The XAI package is on PyPI. To install you can run:
```bash
uv pip install xai
```
Alternatively you can install from source by cloning the repo and running:
```bash
uv pip install -e .
```
### Additional Commands
To clean build artifacts and cache files:
```bash
uv run xai-clean
```
## Usage
You can find example usage in the examples folder.
### 1) Data Analysis
With XAI you can identify imbalances in the data. For this, we will load the census dataset from the XAI library.
``` python
import xai.data
df = xai.data.load_census()
df.head()
```
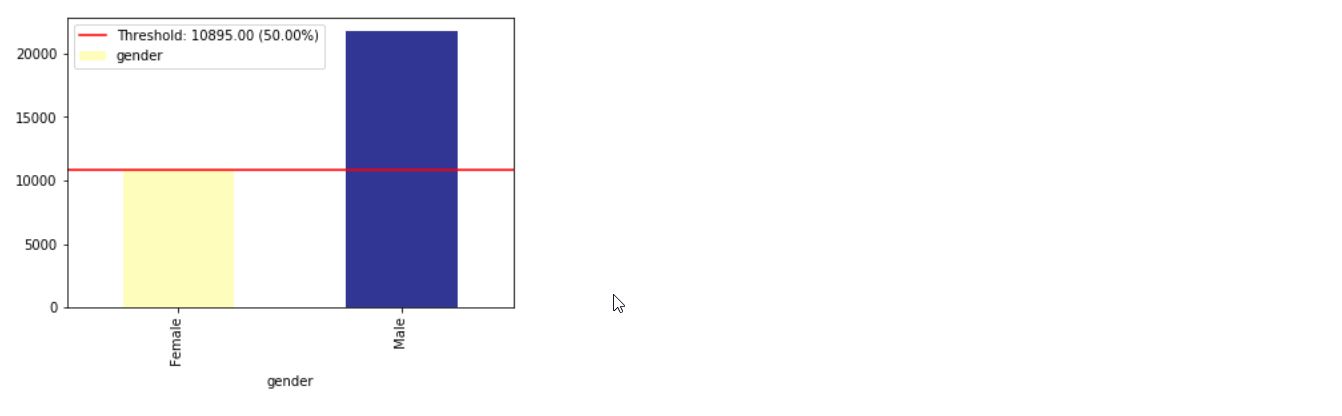
 #### View class imbalances for all categories of one column
``` python
ims = xai.imbalance_plot(df, "gender")
```
#### View class imbalances for all categories of one column
``` python
ims = xai.imbalance_plot(df, "gender")
```
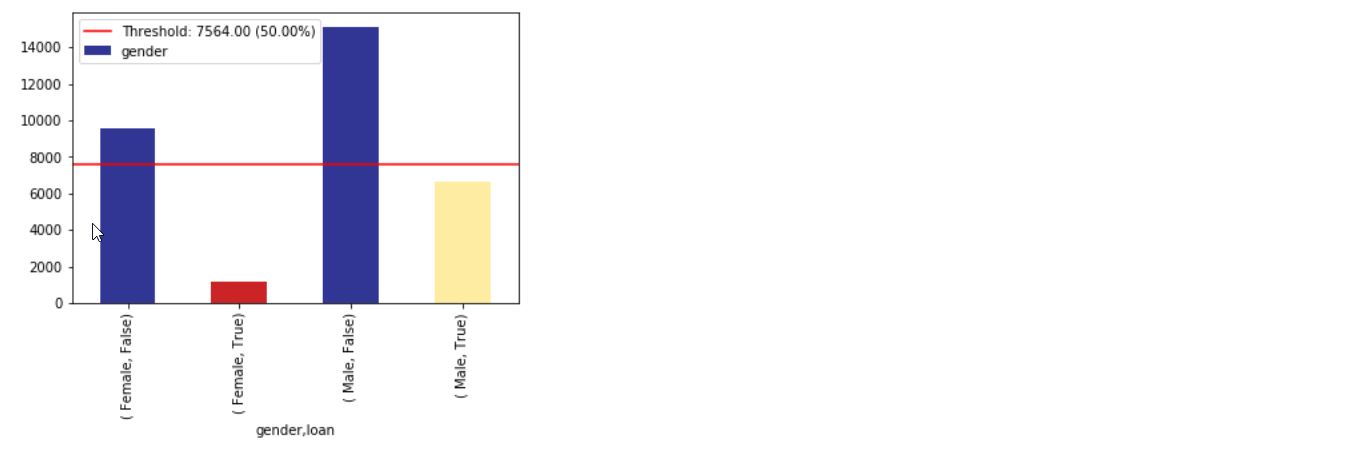
 #### View imbalances for all categories across multiple columns
``` python
im = xai.imbalance_plot(df, "gender", "loan")
```
#### View imbalances for all categories across multiple columns
``` python
im = xai.imbalance_plot(df, "gender", "loan")
```
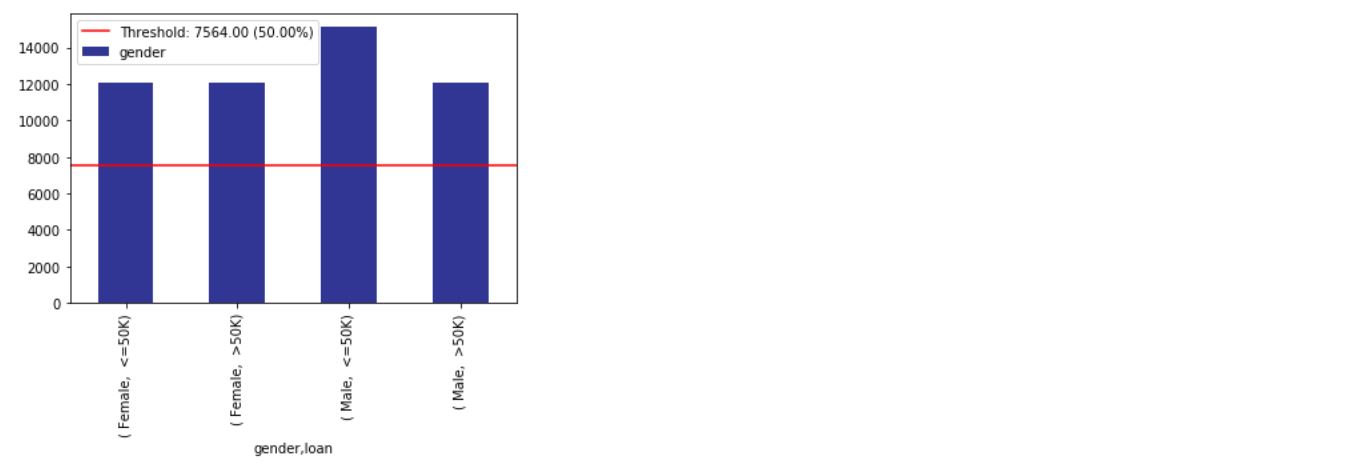
 #### Balance classes using upsampling and/or downsampling
``` python
bal_df = xai.balance(df, "gender", "loan", upsample=0.8)
```
#### Balance classes using upsampling and/or downsampling
``` python
bal_df = xai.balance(df, "gender", "loan", upsample=0.8)
```
 #### Perform custom operations on groups
``` python
groups = xai.group_by_columns(df, ["gender", "loan"])
for group, group_df in groups:
print(group)
print(group_df["loan"].head(), "\n")
```
#### Perform custom operations on groups
``` python
groups = xai.group_by_columns(df, ["gender", "loan"])
for group, group_df in groups:
print(group)
print(group_df["loan"].head(), "\n")
```
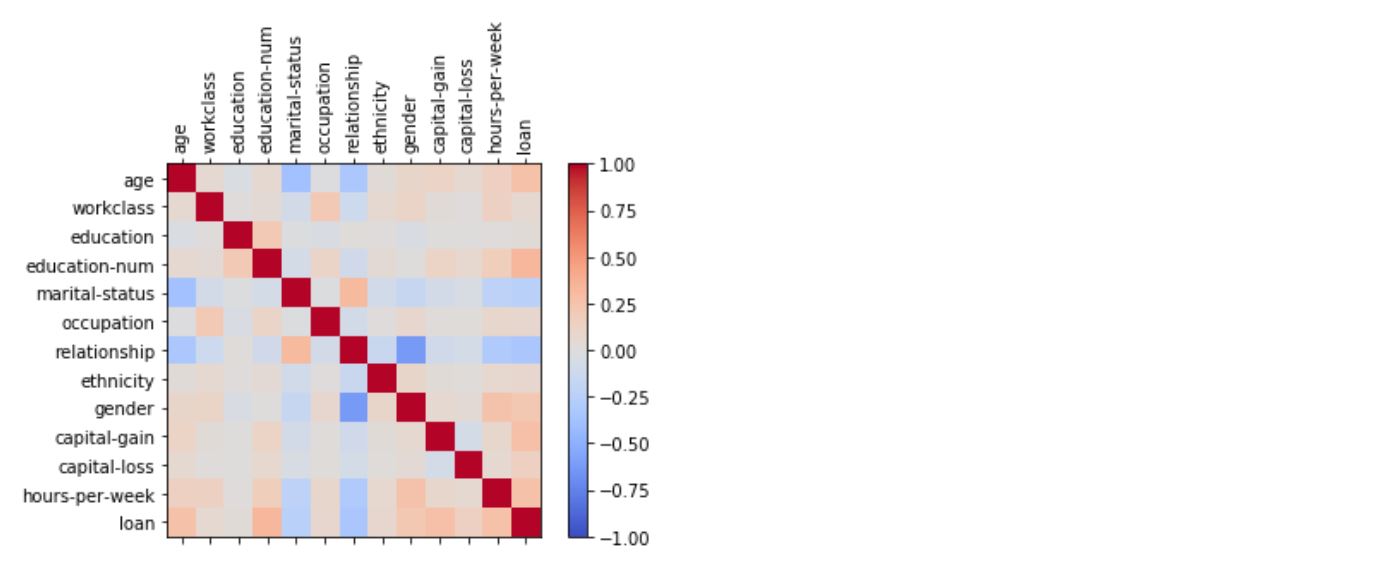
 #### Visualise correlations as a matrix
``` python
_ = xai.correlations(df, include_categorical=True, plot_type="matrix")
```
#### Visualise correlations as a matrix
``` python
_ = xai.correlations(df, include_categorical=True, plot_type="matrix")
```
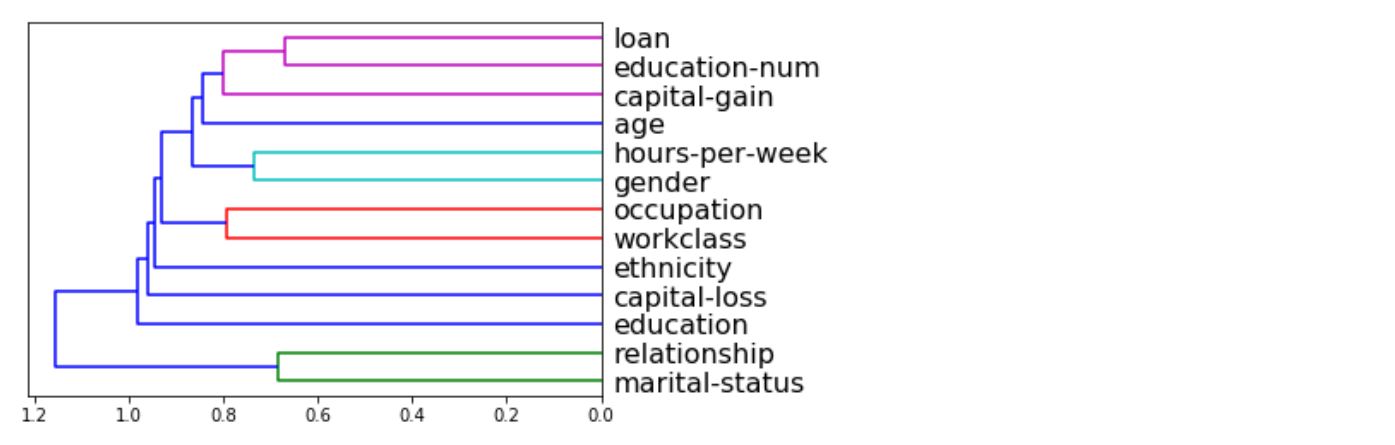
 #### Visualise correlations as a hierarchical dendogram
``` python
_ = xai.correlations(df, include_categorical=True)
```
#### Visualise correlations as a hierarchical dendogram
``` python
_ = xai.correlations(df, include_categorical=True)
```
 #### Create a balanced validation and training split dataset
``` python
# Balanced train-test split with minimum 300 examples of
# the cross of the target y and the column gender
x_train, y_train, x_test, y_test, train_idx, test_idx = \
xai.balanced_train_test_split(
x, y, "gender",
min_per_group=300,
max_per_group=300,
categorical_cols=categorical_cols)
x_train_display = bal_df[train_idx]
x_test_display = bal_df[test_idx]
print("Total number of examples: ", x_test.shape[0])
df_test = x_test_display.copy()
df_test["loan"] = y_test
_= xai.imbalance_plot(df_test, "gender", "loan", categorical_cols=categorical_cols)
```
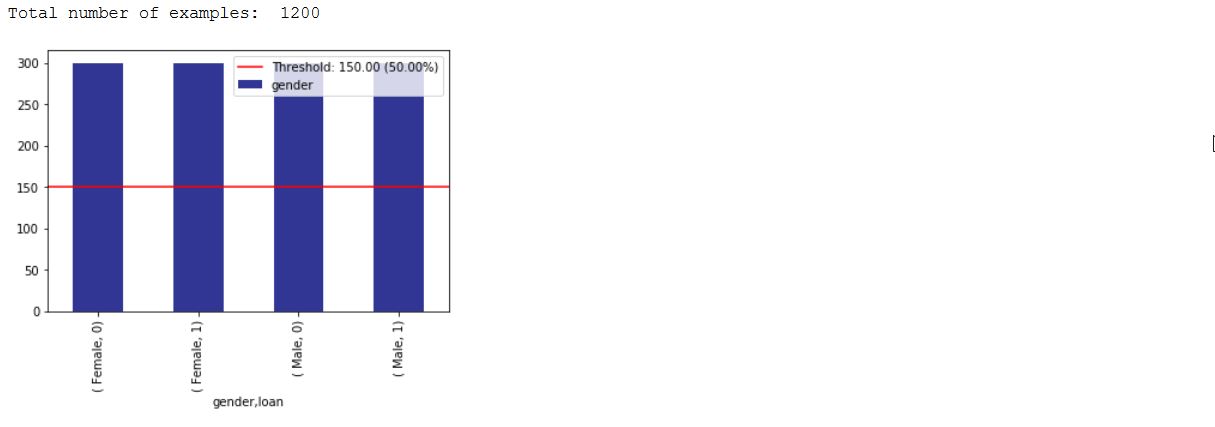
#### Create a balanced validation and training split dataset
``` python
# Balanced train-test split with minimum 300 examples of
# the cross of the target y and the column gender
x_train, y_train, x_test, y_test, train_idx, test_idx = \
xai.balanced_train_test_split(
x, y, "gender",
min_per_group=300,
max_per_group=300,
categorical_cols=categorical_cols)
x_train_display = bal_df[train_idx]
x_test_display = bal_df[test_idx]
print("Total number of examples: ", x_test.shape[0])
df_test = x_test_display.copy()
df_test["loan"] = y_test
_= xai.imbalance_plot(df_test, "gender", "loan", categorical_cols=categorical_cols)
```
 ### 2) Model Evaluation
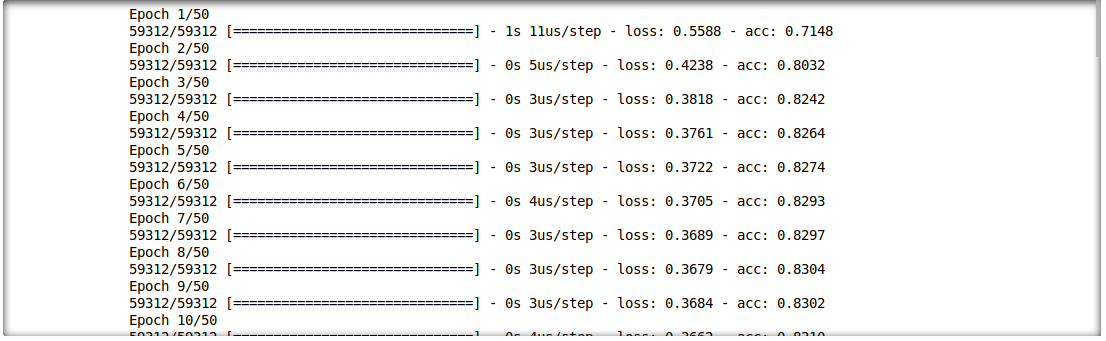
We are able to also analyse the interaction between inference results and input features. For this, we will train a single layer deep learning model.
```
model = build_model(proc_df.drop("loan", axis=1))
model.fit(f_in(x_train), y_train, epochs=50, batch_size=512)
probabilities = model.predict(f_in(x_test))
predictions = list((probabilities >= 0.5).astype(int).T[0])
```
### 2) Model Evaluation
We are able to also analyse the interaction between inference results and input features. For this, we will train a single layer deep learning model.
```
model = build_model(proc_df.drop("loan", axis=1))
model.fit(f_in(x_train), y_train, epochs=50, batch_size=512)
probabilities = model.predict(f_in(x_test))
predictions = list((probabilities >= 0.5).astype(int).T[0])
```
 #### Visualise permutation feature importance
``` python
def get_avg(x, y):
return model.evaluate(f_in(x), y, verbose=0)[1]
imp = xai.feature_importance(x_test, y_test, get_avg)
imp.head()
```
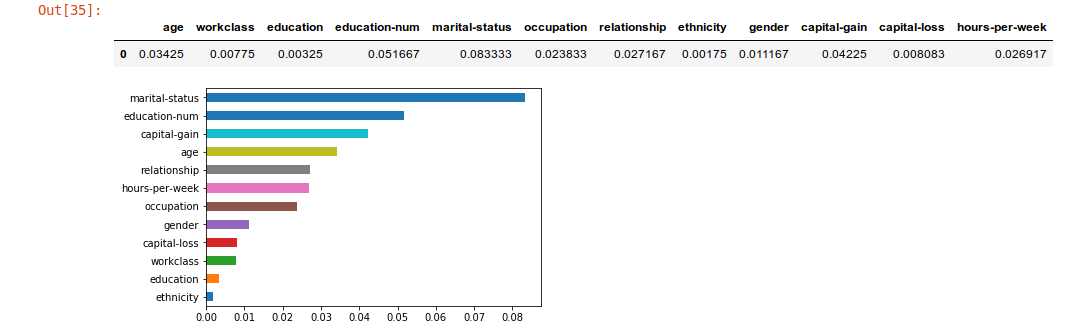
#### Visualise permutation feature importance
``` python
def get_avg(x, y):
return model.evaluate(f_in(x), y, verbose=0)[1]
imp = xai.feature_importance(x_test, y_test, get_avg)
imp.head()
```
 #### Identify metric imbalances against all test data
``` python
_= xai.metrics_plot(
y_test,
probabilities)
```
#### Identify metric imbalances against all test data
``` python
_= xai.metrics_plot(
y_test,
probabilities)
```
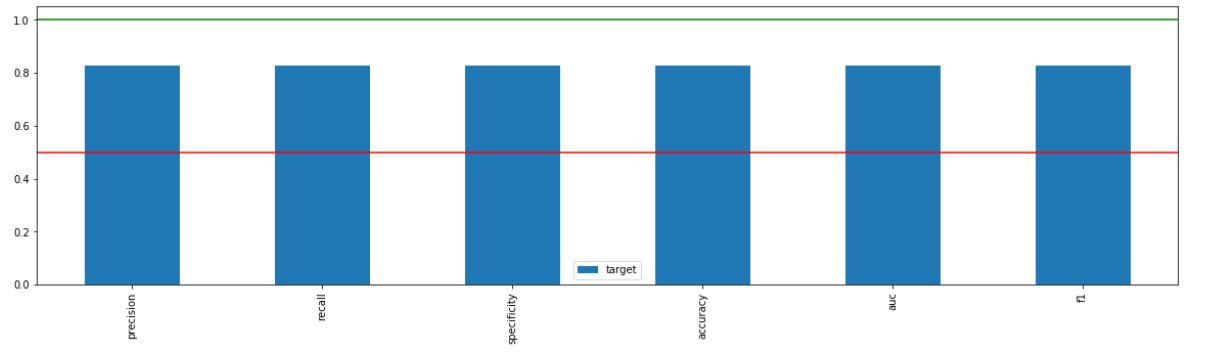 #### Identify metric imbalances across a specific column
``` python
_ = xai.metrics_plot(
y_test,
probabilities,
df=x_test_display,
cross_cols=["gender"],
categorical_cols=categorical_cols)
```
#### Identify metric imbalances across a specific column
``` python
_ = xai.metrics_plot(
y_test,
probabilities,
df=x_test_display,
cross_cols=["gender"],
categorical_cols=categorical_cols)
```
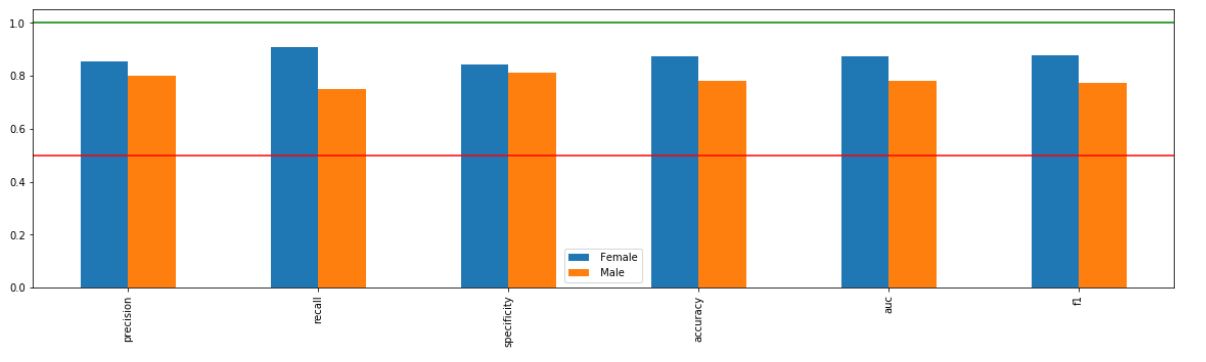 #### Identify metric imbalances across multiple columns
``` python
_ = xai.metrics_plot(
y_test,
probabilities,
df=x_test_display,
cross_cols=["gender", "ethnicity"],
categorical_cols=categorical_cols)
```
#### Identify metric imbalances across multiple columns
``` python
_ = xai.metrics_plot(
y_test,
probabilities,
df=x_test_display,
cross_cols=["gender", "ethnicity"],
categorical_cols=categorical_cols)
```
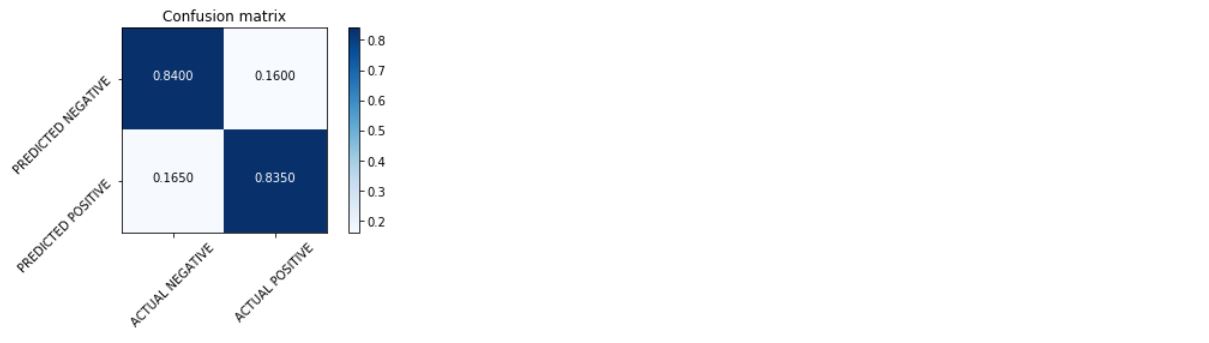
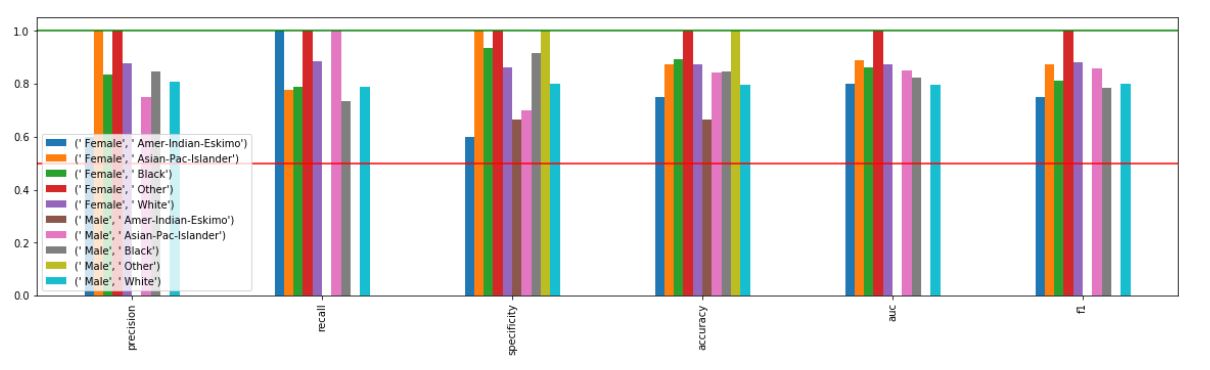 #### Draw confusion matrix
``` python
xai.confusion_matrix_plot(y_test, pred)
```
#### Draw confusion matrix
``` python
xai.confusion_matrix_plot(y_test, pred)
```
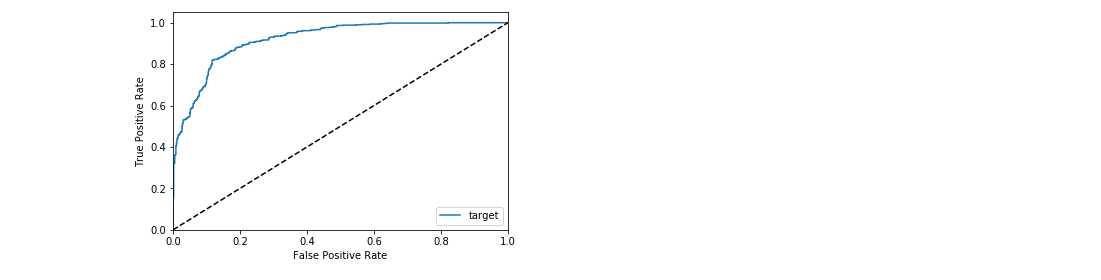
 #### Visualise the ROC curve against all test data
``` python
_ = xai.roc_plot(y_test, probabilities)
```
#### Visualise the ROC curve against all test data
``` python
_ = xai.roc_plot(y_test, probabilities)
```
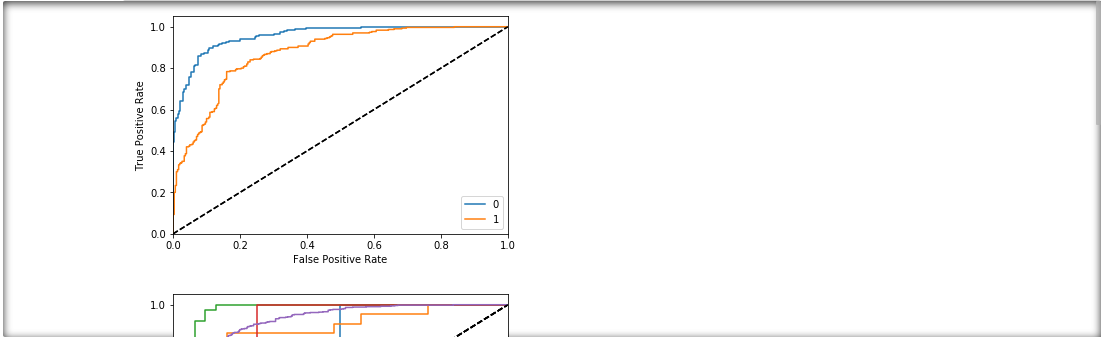
 #### Visualise the ROC curves grouped by a protected column
``` python
protected = ["gender", "ethnicity", "age"]
_ = [xai.roc_plot(
y_test,
probabilities,
df=x_test_display,
cross_cols=[p],
categorical_cols=categorical_cols) for p in protected]
```
#### Visualise the ROC curves grouped by a protected column
``` python
protected = ["gender", "ethnicity", "age"]
_ = [xai.roc_plot(
y_test,
probabilities,
df=x_test_display,
cross_cols=[p],
categorical_cols=categorical_cols) for p in protected]
```
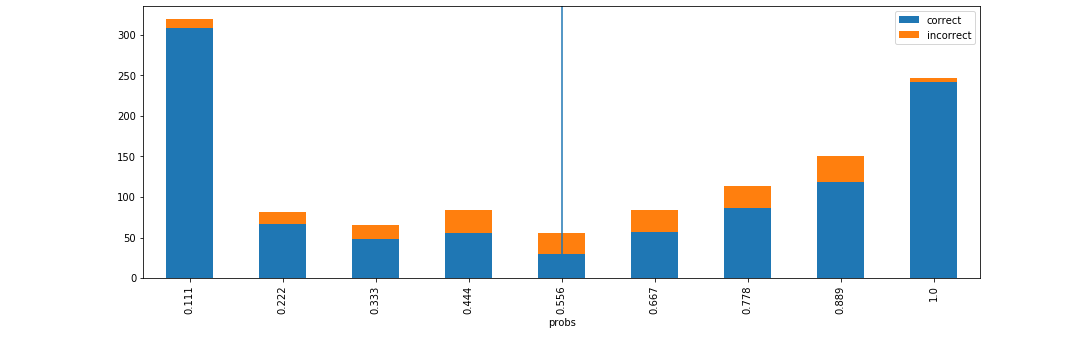
 #### Visualise accuracy grouped by probability buckets
``` python
d = xai.smile_imbalance(
y_test,
probabilities)
```
#### Visualise accuracy grouped by probability buckets
``` python
d = xai.smile_imbalance(
y_test,
probabilities)
```
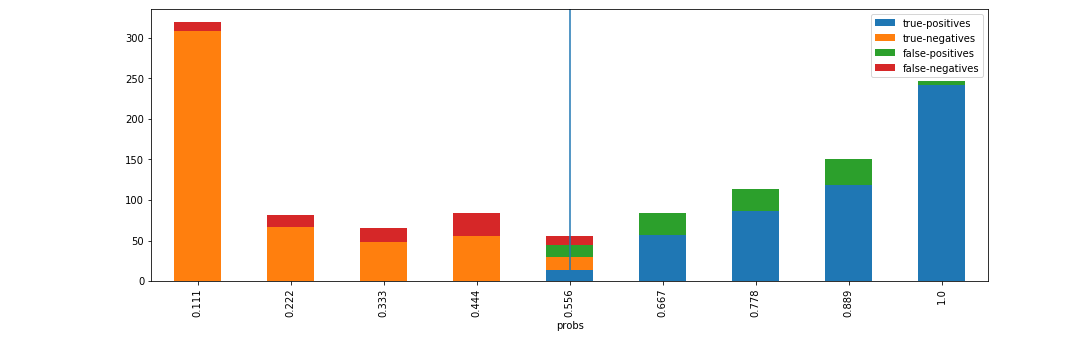
 #### Visualise statistical metrics grouped by probability buckets
``` python
d = xai.smile_imbalance(
y_test,
probabilities,
display_breakdown=True)
```
#### Visualise statistical metrics grouped by probability buckets
``` python
d = xai.smile_imbalance(
y_test,
probabilities,
display_breakdown=True)
```
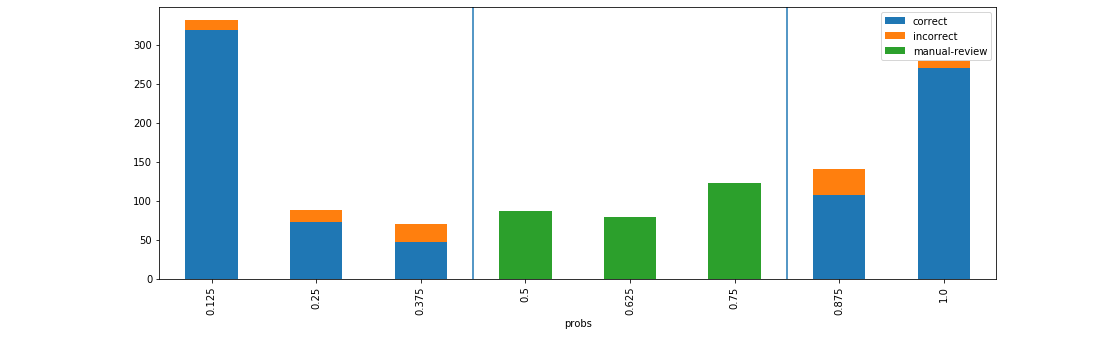
 #### Visualise benefits of adding manual review on probability thresholds
``` python
d = xai.smile_imbalance(
y_test,
probabilities,
bins=9,
threshold=0.75,
manual_review=0.375,
display_breakdown=False)
```
#### Visualise benefits of adding manual review on probability thresholds
``` python
d = xai.smile_imbalance(
y_test,
probabilities,
bins=9,
threshold=0.75,
manual_review=0.375,
display_breakdown=False)
```