# Benchmarks
This page gives the method and the status of each measurement. It names its
sources, and it reports results that did not favour Graphicle as well. Product
names are trademarks of their respective owners; no affiliation or
endorsement is implied.
## Summary
| Area | Status | Result |
|---|---|---|
| Code-graph engine: parity | Graphify 0.9.95: done on Linux, 24 October 2026. Graphify 0.9.91: run on Linux, 15 October 2026, and again on the 0.1.2 source, 18 October 2026. Graphify 0.9.88: done, 13 October 2026; widened 14 October 2026 | Against Graphify 0.9.95, every comparison check passes on Linux (97 of 97) and every application module has a passing receipt. Against Graphify 0.9.91, the comparison checks pass on Linux, apart from those that stop on that host, as they did against 0.9.88 (IPv4 loopback, a speech recording and ffmpeg, and one layout tolerance). Against Graphify 0.9.88, every check passes, with reviewed upstream fixes applied to nine of the reference's modules; widened on 14 October, they run most of its test files against the engine, and every file they run passes apart from the recorded known differences. The limits are [below](#parity-with-graphify) |
| Code-graph engine: speed | Done, on a pre-release build that followed Graphify 0.9.77. The 0.1.0 engine: an exploratory survey, 14 October 2026; its registered quiet-host repeat is pending. Updates after commits: Graphicle 0.1.0 against Graphify 0.9.91, registered before the first update, 15 October 2026. 13 codebases against Graphify 0.9.91: Graphicle's 0.1.1 memory engine (a pre-release build), one session per program, 15 October 2026 | Django (pre-release build): code-only extract 7.5 s against 72.8 s for Graphify 0.9.77. Kubernetes v1.37.1 (the 0.1.0 engine, which follows Graphify 0.9.88; exploratory, one run each on one Linux host, the same 16 CPUs, 8 workers, with four recorded deviations): code-only extract 198.4 s against 1,597.9 s for Graphify 0.9.88, the same graph. [Details](#speed-on-kubernetes). Updates after each of 30 commits on prometheus, tokio and poetry (one Linux node, 4 CPUs per run): 6 to 8 times less time than Graphify 0.9.91, with the same differences from a fresh build in both. [Details](#updates-after-commits). 13 codebases, 3 operations each (Graphicle's 0.1.1 memory engine, a pre-release build, against Graphify 0.9.91; the same machine, 3 CPUs and 8 workers each): 3.0 to 22.7 times less time in all 39 measurements; the graphs differ slightly, with node counts within 4.7% and edge counts within 2.0%. [Details](#speed-on-13-codebases-against-graphify-0991) |
| Code-graph engine: peak memory | A pre-release build with 0.1.1's changes to how the engine holds its data, against Graphify 0.9.91, 15 October 2026; five measurements rechecked on a build of the merged 0.1.1 source | Less peak memory than Graphify 0.9.91 in all 39 measurements (13 repositories; extract, priming update and update with no change), from 0.29 to 0.97 times Graphify's figure; Kubernetes extract 2,091.5 against 2,767 MiB. One Linux node (its 8 H100 GPUs not used), 8 workers; Graphicle's peak RSS against Graphify's peak PSS. [Details](#peak-memory-against-graphify-0991) |
| Coding agents: Claude Code with Graphicle, Graphify or neither | Four task sets, each test registered before any answer was scored; Claude Code with Opus 5.5, and one set repeated with Haiku 5.5 | Graphicle tied plain Claude Code on finding files and facts in every test, and no token saving is claimed against it. Against Graphify 0.9.91, Graphicle found more facts on Graphify's showcase corpus and used fewer tokens in all four task sets (on SWE-bench Verified, a secondary comparison); in two of them, Graphicle's arm included a prototype that does not ship. [Details](#coding-agents-with-graphicle-graphify-or-neither) |
| Retrieval: finding the files a fix changes | Graphicle 0.1.8, offline, 25 October 2026, on 100 SWE-bench Verified issues never used for tuning; Graphicle 0.1.3 and the 0.1.2 release, 21 October 2026, on those and 80 issues used for tuning | On the held-out issues, a file the fix changed was among the first 5 files of 0.1.8's context packet for 75, against 61 for BM25 (SWE-bench style; McNemar exact p = 0.013) and 54 for grep on the issue's names; for the first file and the first 10 files the differences from BM25 are not significant. 0.1.3 had the same counts, apart from 82 in the first 10 files against 0.1.8's 81. Ranking only: no agent test of this ranking has been run yet ([retrieval benchmark](benchmarks/retrieval.md)) |
| Retrieval: time per question, our run | Graphicle 0.1.8 against 0.1.7 on our Linux server, 25 October 2026 | kubernetes, the 22 questions of issue #8, each call a new process: `graphicle context` took a median of 1.34 s with 0.1.8 against 2.99 s with 0.1.7 on 16 cores, and 1.38 s against 3.89 s on 4; the peak memory of a call was 0.6 GB against 3.5 GB, with the same packet for every question. [Details](#our-own-run-on-kubernetes-017-and-018) |
| Retrieval: time per question, measured independently | Run and published by @selimaytac, who reported issue #8, on Graphicle 0.1.3 and 0.1.5, 23 October 2026 | kubernetes, 22 questions, an Apple M3 Pro, no answer model: `graphicle context` took a median of 153.5 s per question on 0.1.3 and 9.5 s on 0.1.5, and the prompt hook returned a packet for 18 of 22. [Details](#independent-measurements) |
| Whole-repository packs: the files a fix changes, in repositories past 1M tokens | Questions, arms and scorer fixed; the model runs are not made yet. Context recall without a model, on 3 held-out and 2 development repositories, with the pack built before Meta's hackathon (2a46edb) | Held out (pytorch, vscode and elasticsearch, 90 questions): a mean 55.8% of the files a fix changed had text inside a 64K-token pack (whole, or as excerpts or outlines of their symbols) and 76.8% inside 1M tokens, against 1.1% and 2.2% for the repository cut to the same budget, which holds whole files only. [The benchmark's page](benchmarks/whole-repo.md) |
| Agent memory: comparison with seven memory systems | Done, on development sets, with a proxy evaluator | Every system's scores and the 21 registered comparisons are [below](#agent-memory-comparison-with-seven-memory-systems). None of them is a headline claim |
| Agent memory: retrieval defaults | Chosen | Model-free retrieval runs on development data, plus held-out checks; their records are not published yet, so no numbers are given |
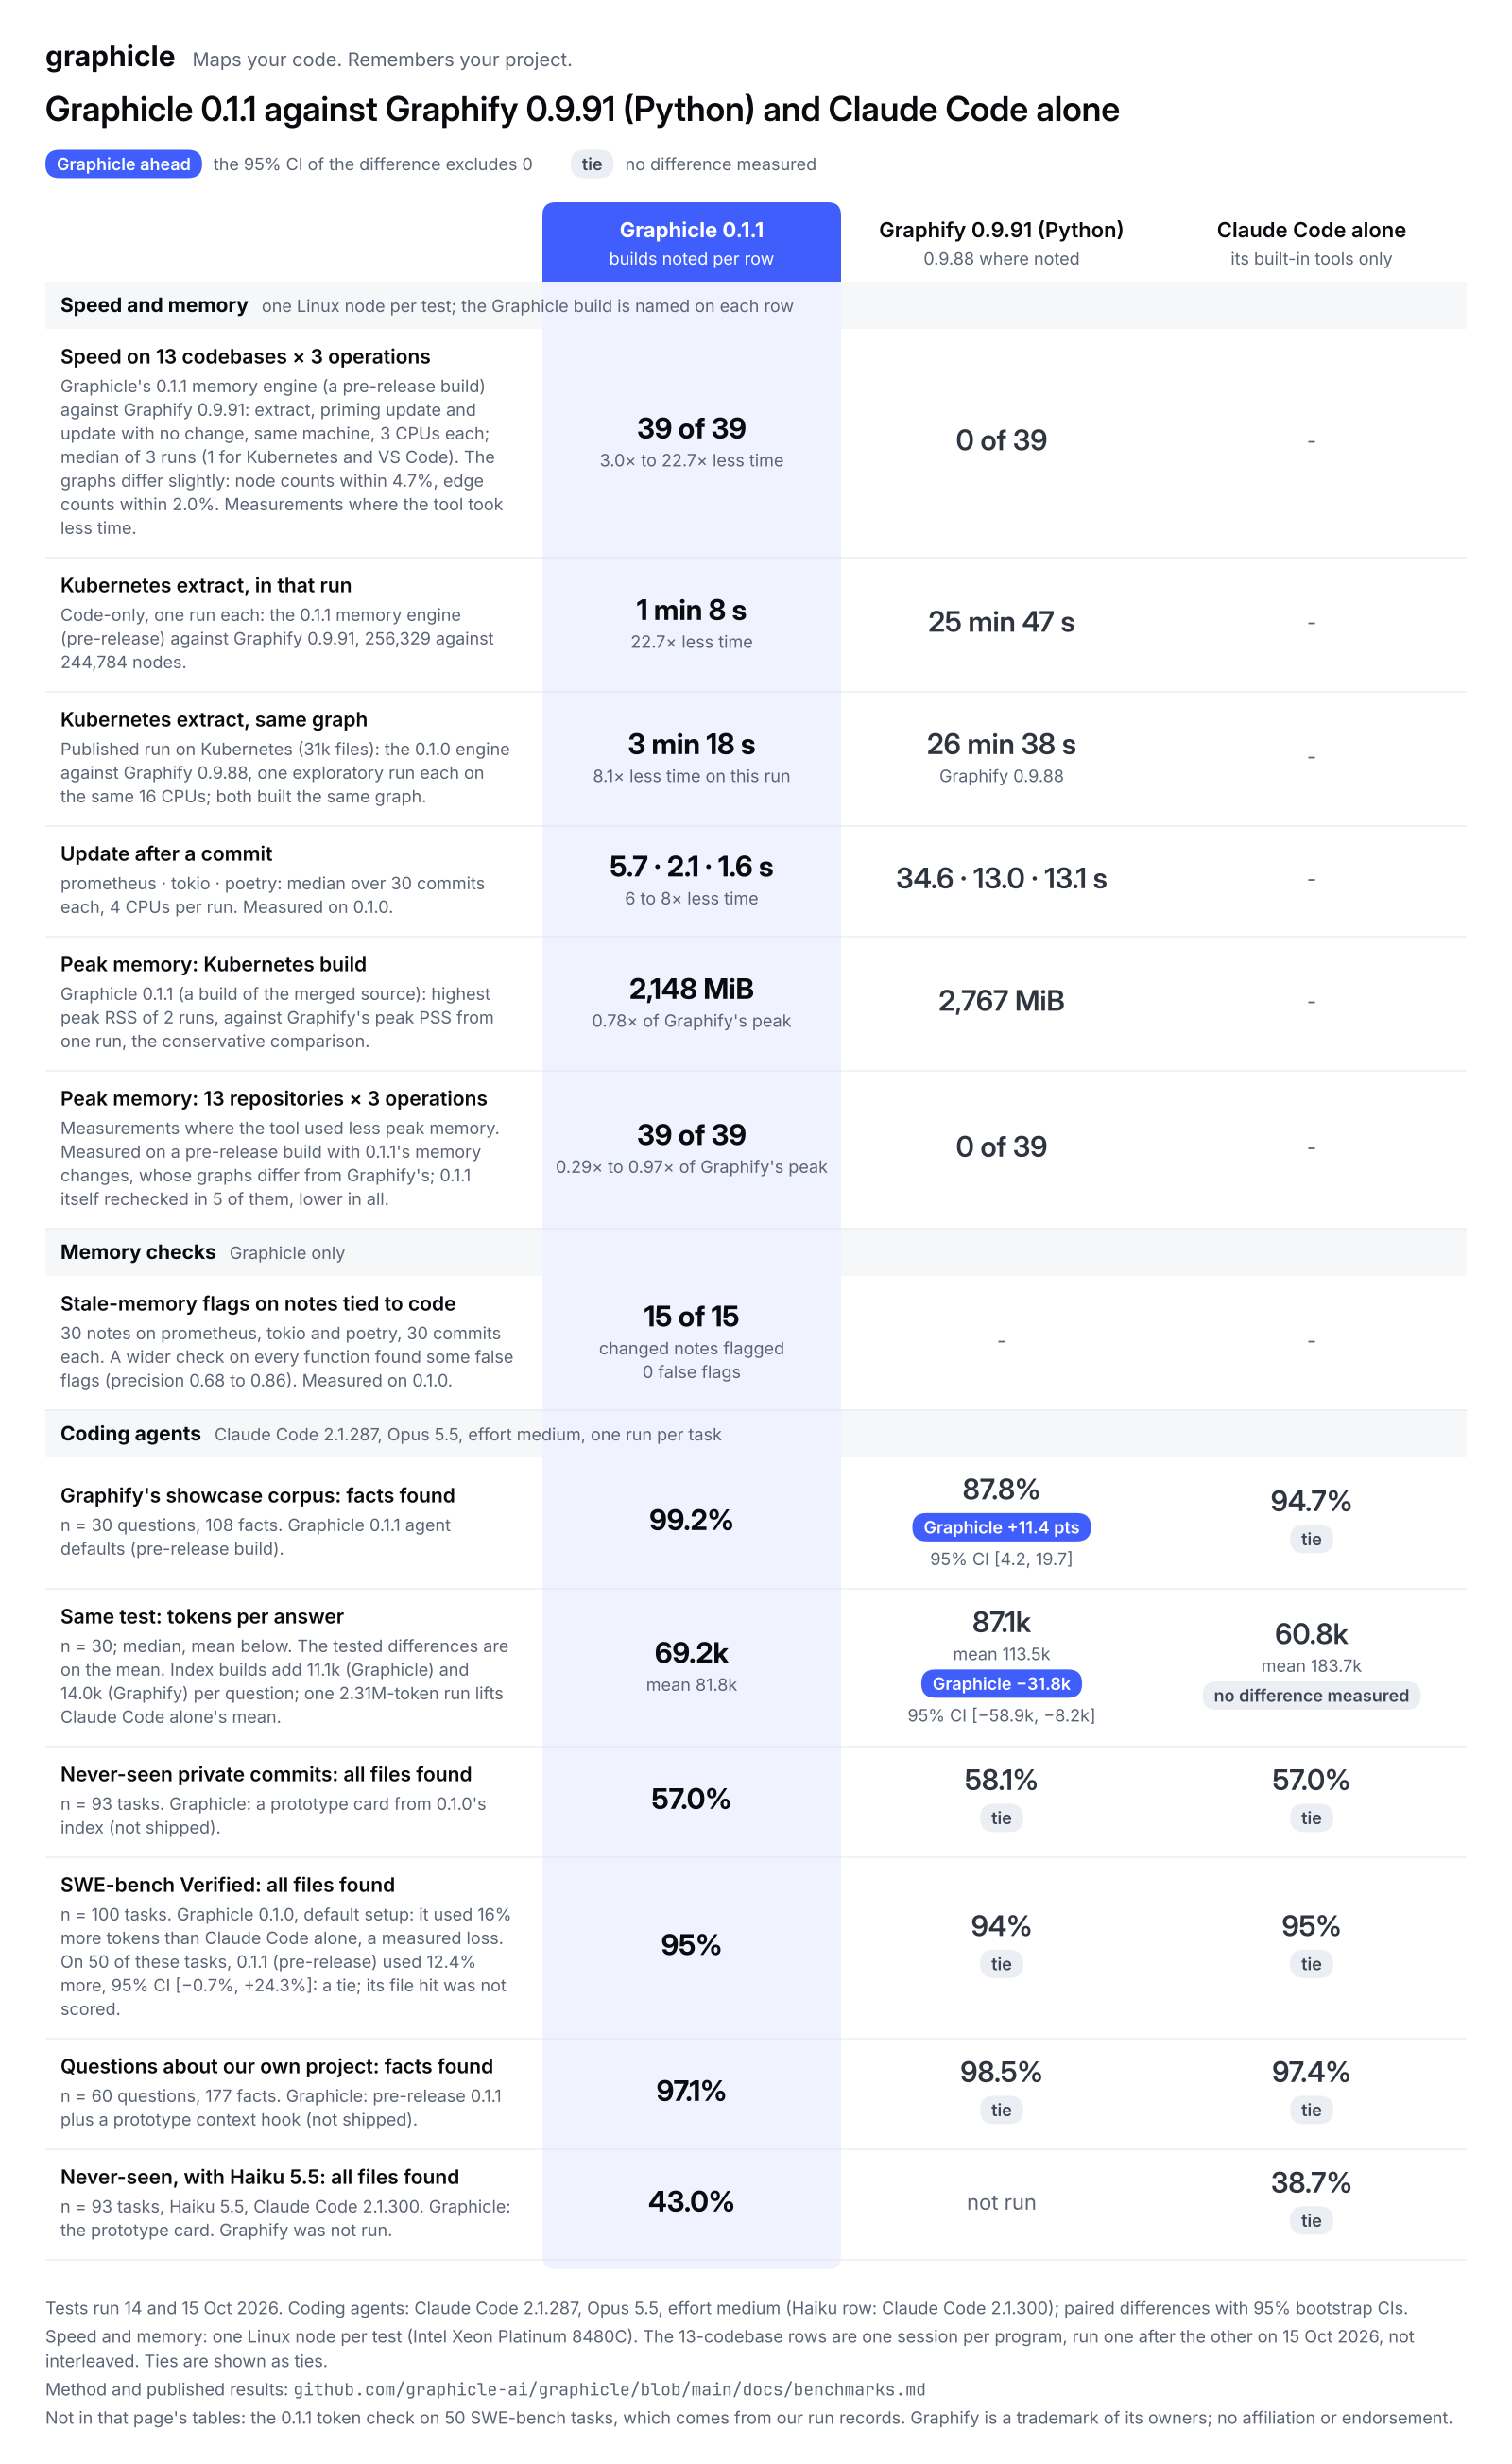
The table image below gives the main results. Each row names its build and
conditions, and the sections below have the full tables.
## Code-graph engine
### Parity with Graphify
The engine is a Rust port of Graphify. It follows Graphify
0.9.95 (tag commit `92741d16`): the port was made from 0.9.77 (`5c7b8479`),
the eleven releases 0.9.78 to 0.9.88 were ported for 0.1.0, the three
releases 0.9.89 to 0.9.91 for 0.1.1, and the four releases 0.9.92 to 0.9.95
for 0.1.7. Against Graphify 0.9.95 it passes every comparison check on
Linux, and every application module has a passing receipt. Against Graphify
0.9.88 it passed every comparison check, and every application module had a
passing receipt. Against Graphify 0.9.91 the checks ran on Linux, where the
only checks that did not pass stopped for reasons of that host (below).
That is the parity claim, with these limits:
- **Graphify 0.9.95 (24 October 2026).** A qualified build of the source that
follows 0.9.95 (binary SHA-256 `92c162c3…`) ran `tools/qualify_all.py`
against the pinned archive of Graphify 0.9.95 (`92741d16`, archive SHA-256
`b4bc34d3…`, with `graphifyy` 0.9.95 from PyPI) on Linux (x86_64). Every one
of the 97 checks passes, and the file ledger (`migration/FILES.json`) marks
all 96 application modules verified. On that host the loopback checks ran
with their test servers on the host's own address, `check_transcribe` had
ffmpeg and the speech recording (`jfk.wav`), and the force-directed layout
is compared with NetworkX at an absolute tolerance of 1e-8 instead of 2e-9:
one coordinate of 22 differs there by 2.2e-9, with the same values against
0.9.91 as against 0.9.95. Of the test files that 0.9.92 to 0.9.95 add or
change, the checks run all but these: the files that test Graphify's skill
text, the scan-root test, which reads a Python module variable,
`test_cache_long_paths.py`, which runs only on Windows,
`test_serve_http.py`, which needs packages the reference environment does
not install, and single tests that patch the reference's private Python
functions or read its source; each is recorded in its check's receipt.
- **Graphify 0.9.91 (15 October 2026).** A qualified build of the 0.1.1
source (binary SHA-256 `f212d846…`) ran `tools/qualify_all.py` against the
pinned archive of Graphify 0.9.91 (`10130e79`, archive SHA-256
`f4916b0c…`, with `graphifyy` 0.9.91 from PyPI) on Linux (x86_64). In
that full run every check passes, `check_detect` among them, except those
that stop on that host, as they did against 0.9.88: some need IPv4 loopback
connections, which the host refuses, `check_transcribe` needs a speech
recording (`jfk.wav`) and ffmpeg, which the host lacks, and in
`check_export` a graph layout position differs from NetworkX's by 2.2e-9,
against a tolerance of 2e-9. The file ledger (`migration/FILES.json`)
marks each application module with a passing receipt from that run as
verified; the others stay pending. Since that run the engine has changed in
tests, in its version and, on macOS, in its memory allocator. On 18 October
2026 a qualified build of the 0.1.2 source (binary SHA-256 `e9d7d0c6…`) had
the same result on Linux, except that `check_detect` and `check_extract`
stopped on upstream tests that depend on the run's folder: one fails when a
detected file's path contains `build`, as that run's folder did (the pinned
reference fails it there too), and in `check_detect` a Unix socket path was
longer than the system allows. Apart from those tests, both checks passed.
Before the merge, the port branch's own build (binary
SHA-256 `adf81bb2…`) had the same result, except that `check_detect` passed
only when run on its own: in its full run of `tools/qualify_all.py`, one
upstream test could not bind a Unix socket because the run's temporary
path was longer than the system allows. On that build, the loopback checks
passed with their test servers on the host's own address, apart from
`check_native_workflows`, in which the reference's own client then failed
to set up TLS on that host. Of the test files that 0.9.89 to 0.9.91 add or
change, the checks run all but these: the files that test Graphify's skill
text and skill generator, the file that patches the reference's own
subprocess call (the engine's equivalent has a Rust test), and the Ollama
files, which drive mocked Python clients, so `check_llm` compares the
engine's Ollama requests with the reference's instead. On
Kubernetes, prometheus and tokio, the port branch's engine's `update
--force --no-cluster` gave the same nodes and edges as Graphify 0.9.91's on
the same folder, record for record and in the same order; the files differ
only in where some edges place their `context` key, as 0.1.0's did. A
build of the 0.1.1 source gives the same graphs as the port branch's
engine in all 30 extracts and priming updates compared, on 13
repositories, Kubernetes, prometheus and tokio among them. The items below
describe the 0.9.88 runs unless they say otherwise.
- **What the checks do.** Each check runs upstream tests and comparisons
against the Rust engine and compares the engine's results with the pinned
Python release. Together they run most of Graphify 0.9.88's test files
(`tests/test_*.py`) and cover every application module (84,134 source
lines). A file counts as run when at least one of its tests runs and passes
in a check, or when the engine fails one of its tests (a known difference,
below).
- **Widened on 14 October 2026.** That day more test files were added to the
checks, mostly extraction and cross-file resolution across languages, plus
files for the command line, graph building, file discovery, exports and
other modules. They are listed in
[evidence/upstream-tests-known-differences.md](evidence/upstream-tests-known-differences.md).
The widened checks ran on Linux (x86_64) with the same engine source. There
every check passes except those that stop on that host, before the change
and after it alike: some need IPv4 loopback connections, which the host
refuses, `check_transcribe` needs ffmpeg, which it lacks, and in
`check_export` a graph layout position differs there from NetworkX's by
2.2e-9, against a tolerance of 2e-9. Every upstream test that ran there
passed, apart from the known differences. The widened checks have not yet
run on macOS.
- **Known differences in upstream tests.** A few upstream tests fail against
the engine. Each is recorded, with the reason, in
[evidence/upstream-tests-known-differences.md](evidence/upstream-tests-known-differences.md)
and deselected by its exact name. Most are command-line messages and help
text that the engine words differently or does not print; one is a second
`case_of` edge for TypeScript enum members whose names differ only in case.
- **Tests that are not run.** The other test files are listed in
[evidence/upstream-tests-not-run.md](evidence/upstream-tests-not-run.md),
each with its reason: some test something the engine does not contain or
that exists only in Python (Python packaging and interpreter details,
private Python functions, Graphify Cloud's call to action, Graphify's own
skill text and skill generator, and its test fixtures), and the rest test
behaviour the engine ports but are not run yet, mostly in the
language-model module and the installer and agent integration.
- **A reviewed reference.** The checks compare with the pinned release plus
reviewed upstream fixes, applied in memory to nine of its modules (cache,
extract, cluster, markdown, sql, vbnet, apex, commonlisp and sln); the
engine has the same fixes.
`crates/graphicle-graph/migration/upstream-review/REVIEW.md` lists them.
Where a fix applies, the engine's results differ from released Graphify
0.9.88. For example, community re-splits follow a non-default
`--resolution`, so barbell(15,4) at resolution 0.1 gives 2 communities
where Graphify 0.9.88 gives 3.
- **Known differences.** PDF text comes from `pdf-extract`, not pypdf, so PDF
word counts and text can differ, and command-line progress messages are the
engine's own.
- **Known difference (checked build).** On gohugoio/hugo v0.167.0, the graph
after `graphicle graph update` differed from Graphify 0.9.88's in one
attribute of one node: the stored front matter of a Markdown page that
closes a YAML list at the start of a line. The checked build's YAML parser
rejected that list, so it stored the page's front matter fields as text and
lost the list's nine entries. Nodes, edges and communities were the same,
code-only `extract` gave the same graph, and answers were not affected.
From 0.1.3 the parser reads that page's front matter as YAML; the hugo
comparison has not been run again since.
- **Names.** Folder, environment-variable, command and installed-file names
are translated by one documented table
(`crates/graphicle-graph/tools/naming.py`), which the checks apply.
Graphify's `graphify-out/` folder, for example, is Graphicle's
`.graphicle/`.
- **The checked build.** All the checks last passed on 13 October 2026, on a
pre-release build (commit cce5fd4, 13 October 2026) of the engine
(`graphicle-graph`) for macOS, release profile; the widened checks ran on
14 October 2026 on a Linux release build of the same source. Both builds
use the default features plus `postgres`, `bedrock` and `transcription`,
which some checks exercise. The engine pins tree-sitter 0.25.10, the parser
runtime that Python Graphify 0.9.88 and 0.9.91 use, so files that a grammar rejects
recover the same way. Release archives contain the default build, without
those three features.
- **The record.** [evidence/engine-parity-0.9.88.json](evidence/engine-parity-0.9.88.json)
summarizes the 13 October run: each check with its result, and each
module's receipt. [evidence/upstream-tests-0.9.88.json](evidence/upstream-tests-0.9.88.json)
gives the status of each upstream test file.
`crates/graphicle-graph/migration/STATUS.md` lists every ported module, and
`crates/graphicle-graph/migration/upstream-review/REVIEW.md` records the
upstream fixes that were reviewed and the known limitations.
The opt-in additions (`--precise`, `extract --docs`, `extract --routes`,
`retrieve`, `serve --watch`) go beyond Graphify 0.9.95, so the parity claim
does not cover them. Each one is off unless you ask for it. Two defaults also
go beyond it: every reader of a saved graph.json repairs parallel links
stored under `multigraph: false` (upstream repairs them only in its MCP
server), and the engine reads a graph.json over the 512 MiB cap that it
wrote itself (upstream refuses it).
### Speed against Graphify 0.9.77
**Version.** This record was measured on 8 October 2026 with a pre-release
build of the engine, when the engine followed Graphify 0.9.77, and it compares
that build with Graphify 0.9.77. The 0.1.0 engine follows Graphify 0.9.88. Its
first registered timing run against Graphify 0.9.88 (13 and 14 October 2026)
shared its host with other work, so, as that run's protocol requires, it will
be repeated on a quiet host and both runs will be published here. The 0.1.0
engine's first published timing is the exploratory survey in
[Speed on Kubernetes](#speed-on-kubernetes) below; the registered quiet-host
repeat is still pending. The record is kept as it was published.
| Repository | Operation | Graphify 0.9.77 (Python) | Graphicle (pre-release build of 8 October 2026) | Speed-up | Peak memory, Python / Graphicle |
|---|---|---|---|---|---|
| Django | Code-only extract | 72.8 s | 7.5 s | 9.7× | 1,495 / 1,005 MiB |
| Django | Update after one added definition | 107.9 s | 9.8 s | 11.0× | 4,443 / 1,270 MiB |
| Django | Update with no change | 77.3 s | 5.9 s | 13.2× | 4,444 / 1,267 MiB |
| defu (113 nodes) | Code-only extract | 1.47 s | 0.08 s | 17.6× | 107 / 71 MiB |
| defu | Update after one added definition | 1.18 s | 0.10 s | 11.7× | 57 / 73 MiB |
| scule (87 nodes) | Code-only extract | 1.44 s | 0.08 s | 18.6× | 107 / 67 MiB |
| scule | Update after one added definition | 1.13 s | 0.09 s | 12.4× | 56 / 73 MiB |
- **Method.** The two programs ran in alternating order, five times each per
repository, on one Linux host with 8 extraction workers and no GPU or model.
Each run used the same source path and a fresh output folder. The times are
medians and include program start-up.
- **Memory.** Peak memory is the process tree's resident set, sampled every
20 ms. On the two small repositories, Graphicle's updates use more memory
than Python's.
- **Same output.** Both programs produced the same graph in every case: every
node and edge attribute matched. Django's graph had 53,363 nodes and 119,744
edges after the extract, and 53,847 nodes and 119,767 edges after the
updates.
- **Caveats.** The host was shared, and a single added definition does not
represent every kind of change.
- **Source.** Our measurement record "graphify-comparison-v4" of
8 October 2026, published in
[evidence/graphify-comparison-v4/](evidence/README.md#engine-speed-graphify-comparison-v4)
with every timed run (protocol SHA-256 `361c8a15…8f610f96` as recorded,
binary SHA-256 `0a1f83d1…60104de9`).
### Speed on Kubernetes
The first published timing of the 0.1.0 engine against Graphify 0.9.88 is an
exploratory survey, measured on 14 October 2026. **Label for every figure in
this section:** exploratory survey; one Linux host (Intel Xeon Platinum 8480C;
no GPU or model); for each repository, both programs pinned to the same 16
CPUs with 8 workers each; times include program start-up. Each figure also
names its repository and tag. No figure here is a registered claim, and no
figure is pooled across repositories. Kubernetes and VS Code had one run per
program, and four deviations from the registered plan apply to them (listed
under Method, below).
**Kubernetes v1.37.1** (Go, 31,256 files), code-only extract into an empty
output folder, one run per program:
| Program | Time | CPU time | Peak memory (PSS) | Graph written |
|---|---|---|---|---|
| Graphicle 0.1.0 (a Linux test build; deviation 2) | 198.4 s (3 min 18 s) | 262.5 s | 5,871 MiB (about 5.7 GiB) | 256,329 nodes, 1,400,392 edges |
| Graphify 0.9.88 | 1,597.9 s (26 min 38 s) | 1,729.1 s | 2,770 MiB (about 2.7 GiB) | the same 256,329 nodes and 1,400,392 edges |
- **Same graph, 8.1× faster on this run.** Both programs wrote identical node
and edge records: the canonical digests of all node records and of all edge
records are equal. Graphicle also used 6.6 times less CPU time.
- **Memory, the 0.1.0 engine only.** In this run the 0.1.0 engine's peak PSS
(the process tree's proportional set size, sampled every 0.5 s) was
5,871 MiB against 2,770 MiB for Graphify 0.9.88, and the resident-set sum
agrees (5,916 against 2,797 MiB). 0.1.1 changes how the engine holds its
data; its own figures are in
[Peak memory against Graphify 0.9.91](#peak-memory-against-graphify-0991).
- **Updates stopped at the graph-file cap.** Kubernetes' `graph.json` is about
570 MB, above the default 512 MiB cap on the graph file that both programs
share. Every update of both programs (a priming update, then an update with
nothing changed) stopped at that cap and exited with an error: Graphicle
after about 3 s, when it read the stored graph and before re-extracting
anything; Graphify after about 24 minutes (1,434 s and 1,430 s), when it read
the stored graph to merge its new extraction. These are failed runs, so
there is no update comparison. To update a graph this large with Graphicle,
raise the cap with `GRAPHICLE_MAX_GRAPH_BYTES`, in bytes or as `GB`
(gibibytes): for example, `GRAPHICLE_MAX_GRAPH_BYTES=1GB graphicle graph update .`
**VS Code 1.141.1** (TypeScript, 19,971 files): not admitted, because the two
programs' graphs differ, so no speed-up is given. After the extract,
Graphicle's graph has 3 more nodes and 11 fewer edges than Graphify's (249,081
nodes and 974,695 edges against 249,078 and 974,706). The graphs after the
updates differ too: after the update with no change, nearly every node record
differs (249,266 of Graphicle's 253,812 against 249,263 of Graphify's
253,809), as do 585 against 596 edge records. The differences are reported as
found, not investigated. The times as measured, one run per
program, are not a comparison of the same output:
| Operation | Graphicle 0.1.0 | Graphify 0.9.88 |
|---|---|---|
| Code-only extract | 90.6 s | 393.2 s |
| Priming update | 132.0 s | 642.6 s |
| Update with no change | 110.7 s | 387.9 s |
**The survey's smaller repositories**, measured before access to the host was
lost: one warm-up, then 3 measured runs per program in alternating order.
Times are medians; a speed-up is the median of the per-run ratios, with the
least and most favourable run in brackets.
| Repository | Tag | Language | Files | Code-only extract: Graphicle / Graphify | Speed-up | Update with no change: Graphicle / Graphify | Speed-up | Peak memory (PSS), extract: Graphicle / Graphify | Same graph |
|---|---|---|---|---|---|---|---|---|---|
| pallets/flask | 3.1.3 | Python | 235 | 0.27 s / 1.98 s | 7.4× [7.2–7.8] | 0.16 s / 1.52 s | 9.3× [9.2–9.5] | not measured: runs too short | yes, in every run of every operation |
| BurntSushi/ripgrep | 15.2.0 | Rust | 221 | 0.36 s / 1.93 s | 5.4× [5.4–5.5] | 0.27 s / 1.59 s | 5.8× [5.8–5.9] | not measured: runs too short | yes, in every run of every operation |
| redis/redis | 8.10.2 | C | 1,861 | 2.49 s / 11.8 s | not admitted: graphs differ | 2.09 s / 10.1 s | not admitted: graphs differ | 373 / 413 MiB, not compared: graphs differ | no: every operation differs |
| prometheus/prometheus | v3.15.0 | Go | 1,686 | 3.44 s / 18.6 s | 5.4× [5.3–5.5] | 3.24 s / 18.8 s | 5.8× [5.7–5.8] | 487 / 455 MiB, no ratio: PSS and the resident-set sum disagree | yes, in every run of every operation |
| tokio-rs/tokio | tokio-1.53.3 | Rust | 867 | 1.03 s / 5.80 s | 5.6× [5.5–5.7] | 1.00 s / 5.46 s | 5.4× [5.4–5.7] | 205 / 230 MiB: 1.2 times less for Graphicle (median of the per-run ratios; the resident-set sum agrees) | yes, in every run of every operation |
- **redis.** After the extract, Graphify's graph has one more node and two
more edges: `contains` edges from two Visual Studio solution files in
`deps/jemalloc/msvc/`. After the update with no change, 15,945 node records
differ in content (in the examples kept, the community name). Each program
wrote the same graph in all of its own runs. Reported as found, not
investigated.
- **Not run.** facebook/react was cut short in its warm-up when access to the
host was lost, so it has no measured run; vercel/next.js, pandas-dev/pandas,
scikit-learn/scikit-learn, spring-projects/spring-boot and rails/rails were
not run. Kubernetes and VS Code ran later (deviation 3).
**Method.**
- **Registered first.** The survey was registered on 14 October 2026 at
09:18 UTC, before any clone or measurement, as a dated amendment to the
protocol of the registered timing run named above. It lists 13 repositories
of several languages and sizes, tests none of that protocol's hypotheses,
and publishes every result whatever it shows.
- **Exploratory.** Kubernetes and VS Code had one run per program, with no
warm-up and a 45-minute limit per run; the smaller repositories had one
warm-up and 3 measured runs. With so few runs, the figures describe these
runs only.
- **Host.** One Linux host with Intel Xeon Platinum 8480C processors; no GPU
or model was used. For each repository, both programs were pinned to the
same 16 CPUs with 8 extraction workers each and ran one after the other.
The smaller repositories ran on CPUs 32-47 while another registered timing
run used the host's other socket. Before each program run, the harness
waited until its own CPUs were under 5% busy.
- **Operations.** `extract --code-only --force` into an empty output
folder, then a priming update and an update with nothing changed; the page
cache was not dropped. Each repository was pinned to its latest stable
release tag when it was cloned.
- **Measurements.** Wall time, including program start-up; CPU time of the
process tree; peak memory as the PSS summed over the process tree, sampled
every 0.5 s. A memory ratio is given only when the resident-set sum agrees
in direction.
- **Same output.** In this survey, a speed-up is given only when both
programs wrote the same graph, with every node and every edge record equal,
in every measured run of that operation; differences are reported as found.
[Speed on 13 codebases against Graphify 0.9.91](#speed-on-13-codebases-against-graphify-0991),
below, is an exception: there the two programs' graphs differ slightly in
every measurement, and each speed-up is shown next to both graphs' node and
edge counts.
- **Programs.** Graphify 0.9.88 (Python 3.12.13) in a hash-locked environment.
Graphicle: `graphicle-graph` 0.1.0 built for Linux on the measuring host from
the release source, not the published download; for the smaller
repositories SHA-256 `32d7f800…`, and for Kubernetes and VS Code see
deviation 2.
- **Deviations from the registration** (Kubernetes and VS Code):
1. Kubernetes and VS Code ran at the same time, one on each of the host's
two processor sockets (CPUs 32-47 and 64-79), where the registration ran
one repository at a time. Other work ran on Kubernetes' socket (CPUs
0-15) during all of Graphicle's Kubernetes extract, and on the other
socket during Graphify's failed Kubernetes updates. Its effect was not
measured.
2. The Graphicle binary is a Linux test build of 0.1.0 (SHA-256
`491a4b35…`), made on the measuring host from the release source; its
engine source is identical to the release's. It is not the published
download.
3. The runs started after the survey's registered time box, and out of its
registered order.
4. No host-wide load record was kept; the registration asked for one every
3 minutes.
- **Records.** [evidence/engine-speed-2026-10-14.json](evidence/engine-speed-2026-10-14.json)
holds every program run of Kubernetes and VS Code and the smaller
repositories' medians, with the digests of the graphs written. The full run
records (per-run rows, analysis output, setup receipts and logs) name local
paths, so they stay with the maintainers.
### Updates after commits
**Label for every figure in this section:** Graphicle 0.1.0 (the published
Linux release archive) against Graphify 0.9.91 (the PyPI wheel), both
SHA-256 checked; one Linux node (Intel Xeon Platinum 8480C; no GPU or model
used); each measured run pinned to 4 CPUs, with Graphify's own
`GRAPHIFY_MAX_WORKERS=4` (Graphicle sizes its workers from the CPUs it may
use); code-only, with no model calls; 30 commits per repository. The
protocol was registered on 15 October 2026, before the first measured
update; its three later amendments are listed under Method.
Each program replayed the 30 most recent commits that change code in each
repository, oldest first, and ran its documented update after each one
(`graphicle graph update .` and `graphify update .`). After every update, its
graph was compared with a fresh `extract . --code-only` at the same commit.
| Repository (graph size) | Program | Update: median / 90th percentile | Fresh full build: median | Peak RSS: highest update | Steps that differ from a fresh build | Mean difference per step (nodes and edges) |
|---|---|---|---|---|---|---|
| prometheus/prometheus, Go and TypeScript (15.7k nodes, 66k edges) | Graphicle 0.1.0 | 5.7 s / 6.0 s | 4.5 s | 661 MiB | 30 of 30 | 144 (130 after an update with no change) |
| | Graphify 0.9.91 | 34.6 s / 35.9 s | 25.9 s | 601 MiB | 30 of 30 | 144 (130) |
| tokio-rs/tokio, Rust (12.6k nodes, 27k edges) | Graphicle 0.1.0 | 2.1 s / 2.2 s | 1.5 s | 351 MiB | 0 of 30 | 0 |
| | Graphify 0.9.91 | 13.0 s / 13.2 s | 8.9 s | 288 MiB | 0 of 30 | 0 |
| python-poetry/poetry, Python (5.7k nodes, 19k edges) | Graphicle 0.1.0 | 1.6 s / 1.7 s | 1.4 s | 301 MiB | 30 of 30 | 27 (27) |
| | Graphify 0.9.91 | 13.1 s / 13.4 s | 11.2 s | 392 MiB | 30 of 30 | 27 (27) |
- **6 to 8 times less time.** Graphicle's median update took 6 to 8 times
less time than Graphify's. For both programs an update took longer than a
fresh full build, because an update also re-clusters the graph and rewrites
`graph.html` and `GRAPH_REPORT.md`. Every update exited 0.
- **The same differences from a fresh build in both programs.** At every
step, the two programs' updated graphs had identical differences from the
fresh build. The differences were there already after an update with no
change, before any commit, and come from three ways in which `update` keys
items differently from a full build: repeated docstrings ("rationale"
nodes), npm dependency references keyed to a different `package.json`, and
one Go call edge that `update` drops. They never shrank, and grew once (by
18 in prometheus at step 7, when four `package.json` files changed). Apart
from them, the updates applied every change the commits made, and no node's
location went stale in any of the 90 steps.
- **The comparison catches staleness.** A graph that was not updated differed
from the fresh build at 25 to 30 of the 30 steps in each repository.
- **Peak memory of 0.1.0's updates.** Graphicle 0.1.0's updates peaked higher
than Graphify's on prometheus and tokio and lower on poetry. 0.1.1 changes
how the engine holds its data; see
[Peak memory against Graphify 0.9.91](#peak-memory-against-graphify-0991).
**Stale flags on notes tied to code** (Graphicle only). Graphicle marks a
reviewed note as stale when the function or method it is tied to changes.
Ten reviewed notes per repository were tied to functions or methods with
`graphicle call note`: 5 on symbols that change during the replay, and 5 on
symbols whose file changes while they do not. After each commit,
`graphicle sync .` ran (what Graphicle's Git hooks run) and the flags were
read with `graphicle call memories`. A note should be flagged when its
symbol's definition, read with tree-sitter independently of Graphicle,
changed in that commit, or when the symbol disappeared.
| Repository | Note-steps | Flagged and changed / false flags / missed | Precision / recall | Sync, median |
|---|---|---|---|---|
| prometheus/prometheus | 300 | 5 / 0 / 0 | 1.00 / 1.00 | 5.8 s |
| tokio-rs/tokio | 297 | 5 / 0 / 0 | 1.00 / 1.00 | 1.5 s |
| python-poetry/poetry | 300 | 5 / 0 / 0 | 1.00 / 1.00 | 1.7 s |
**A wider check** (exploratory, added after the results above): the same
signal, a symbol's revision changing between two syncs, applied to every
eligible function and method.
| Repository | Symbols | Precision | Recall | Same-file edits that gave a false flag |
|---|---|---|---|---|
| prometheus/prometheus | 5,088 | 0.82 | 1.00 | 128 of 14,304 |
| tokio-rs/tokio | 1,489 | 0.68 | 1.00 | 63 of 1,886 |
| python-poetry/poetry | 1,631 | 0.86 | 0.90 | 21 of 2,772 |
- **False flags.** The documented rule counts a symbol's lines from its
start up to the next definition, so an edit between a symbol's end and the
next definition (often a new doc comment, attribute or decorator of the
next item) flags the symbol before it. This explains 44 of the 45 false
flags inspected.
- **Misses.** The 14 misses in poetry were 4 edits to decorators only and 10
edits at or below a nested `def`, where the outer function's lines stop.
**Method.**
- **Repositories.** prometheus/prometheus, tokio-rs/tokio and
python-poetry/poetry, cloned on 15 October 2026 and pinned at commits
`d2266dcd`, `52ac7816` and `38a86661`. On the default branch's first-parent
line, the 30 most recent non-merge commits that change a file of the
repository's main language were replayed, oldest first; first-parent
commits between them were applied with the next one (prometheus folds 98
merges into its 30 steps).
- **Graphs compared.** Nodes by id and edges by source, target and relation,
from each program's `graph.json`; communities are ignored.
- **Amendments.** A1: both programs' `update` also indexes Markdown headings,
which `extract --code-only` leaves out, so differences are counted on code
nodes. A2: the wider check above. A3: Python import placeholders, whose ids
hash the checkout folder, are matched by their edges.
- **Timing.** Wall time and peak RSS come from `wait4`, the same figures as
`/usr/bin/time -v` reports, which the node lacks.
- **Records.** The run records name local paths, so they stay with the
maintainers.
### Speed on 13 codebases against Graphify 0.9.91
**Label for every figure in this section:** Graphicle's 0.1.1 memory engine
(a pre-release build with 0.1.1's changes to how the engine holds its data,
binary SHA-256 `611eb188…`) against Graphify 0.9.91 (the PyPI wheel, in a
hash-locked environment), on the same machine with 3 CPUs and 8 workers each,
measured on 15 October 2026; the graphs differ slightly: node counts within
4.7%, edge counts within 2.0%. The machine is one Linux node (two Intel Xeon
Platinum 8480C, 96 cores; its 8 H100 GPUs were not used), and the
repositories are the 13 registered for the survey above, with their tags in
the table. The timed build is not the released 0.1.1 binary. It is also an
earlier build than the one in
[Peak memory against Graphify 0.9.91](#peak-memory-against-graphify-0991)
(binary SHA-256 `c5435033…`), which gives the memory figures.
- **Less time in all 39 measurements**, 3.0 to 22.7 times less: from 35.2 s
against 106.8 s (spring-boot, update with no change) to 68.3 s against
1,546.9 s (Kubernetes, code-only extract). In every measurement, Graphicle's
slowest run took less time than Graphify's fastest.
- **The graphs differ slightly.** The timed build was made before the port of
Graphify 0.9.89 to 0.9.91 was merged into 0.1.1, and Graphify 0.9.91 changed
its own graphs, so in no measurement do the two programs' graphs have the
same node and edge counts. Graphicle's node counts differ from Graphify's by
−0.01% to +4.7%, and its edge counts by −2.0% to +0.4%. The table gives both
graphs' sizes.
| Repository and tag | Operation | Graphicle (s) | Graphify 0.9.91 (s) | Speed-up | Runs per program | Nodes: Graphicle / Graphify | Edges: Graphicle / Graphify |
|---|---|---|---|---|---|---|---|
| pallets/flask 3.1.3 | Code-only extract | 0.34 | 2.39 | 6.9× | 3 | 2,096 / 2,096 | 3,435 / 3,438 |
| | Priming update | 0.38 | 2.25 | 6.0× | 3 | 2,114 / 2,114 | 3,440 / 3,443 |
| | Update with no change | 0.19 | 1.56 | 8.1× | 3 | 2,114 / 2,114 | 3,440 / 3,443 |
| BurntSushi/ripgrep 15.2.0 | Code-only extract | 0.48 | 2.54 | 5.3× | 3 | 4,232 / 4,138 | 8,995 / 8,975 |
| | Priming update | 0.78 | 3.26 | 4.2× | 3 | 4,330 / 4,236 | 9,071 / 9,051 |
| | Update with no change | 0.37 | 1.65 | 4.5× | 3 | 4,330 / 4,236 | 9,071 / 9,051 |
| redis/redis 8.10.2 | Code-only extract | 3.53 | 15.3 | 4.3× | 3 | 16,859 / 16,860 | 60,338 / 60,340 |
| | Priming update | 4.57 | 21.3 | 4.7× | 3 | 17,090 / 17,091 | 60,577 / 60,579 |
| | Update with no change | 2.61 | 10.5 | 4.0× | 3 | 17,090 / 17,091 | 60,577 / 60,579 |
| prometheus/prometheus v3.15.0 | Code-only extract | 3.63 | 23.9 | 6.6× | 3 | 15,800 / 15,677 | 66,449 / 67,707 |
| | Priming update | 5.20 | 31.4 | 6.0× | 3 | 16,849 / 16,726 | 67,437 / 68,827 |
| | Update with no change | 3.20 | 19.6 | 6.1× | 3 | 16,849 / 16,726 | 67,437 / 68,827 |
| tokio-rs/tokio tokio-1.53.3 | Code-only extract | 1.52 | 7.77 | 5.1× | 3 | 12,172 / 12,048 | 25,913 / 25,902 |
| | Priming update | 2.31 | 11.3 | 4.9× | 3 | 13,023 / 12,899 | 26,742 / 26,731 |
| | Update with no change | 1.30 | 5.79 | 4.5× | 3 | 13,023 / 12,899 | 26,742 / 26,731 |
| facebook/react v19.3.0 | Code-only extract | 11.8 | 73.3 | 6.2× | 3 | 34,734 / 34,690 | 67,283 / 67,380 |
| | Priming update | 18.7 | 108.7 | 5.8× | 3 | 45,434 / 45,390 | 76,702 / 76,799 |
| | Update with no change | 15.1 | 86.6 | 5.7× | 3 | 45,434 / 45,390 | 76,702 / 76,799 |
| vercel/next.js v16.4.0 | Code-only extract | 93.5 | 370.7 | 4.0× | 3 | 161,589 / 160,415 | 349,620 / 349,309 |
| | Priming update | 176.4 | 639.2 | 3.6× | 3 | 173,167 / 171,993 | 359,577 / 359,266 |
| | Update with no change | 179.7 | 598.9 | 3.3× | 3 | 173,169 / 171,995 | 359,577 / 359,266 |
| pandas-dev/pandas v3.0.6 | Code-only extract | 10.9 | 62.4 | 5.8× | 3 | 41,949 / 41,949 | 99,181 / 100,021 |
| | Priming update | 11.0 | 71.5 | 6.5× | 3 | 42,655 / 42,653 | 99,709 / 100,548 |
| | Update with no change | 6.48 | 44.3 | 6.8× | 3 | 42,655 / 42,653 | 99,709 / 100,548 |
| scikit-learn/scikit-learn 1.9.1 | Code-only extract | 5.84 | 35.5 | 6.1× | 3 | 20,238 / 20,233 | 67,325 / 67,325 |
| | Priming update | 6.11 | 37.1 | 6.1× | 3 | 20,643 / 20,638 | 67,421 / 67,421 |
| | Update with no change | 3.71 | 24.1 | 6.5× | 3 | 20,643 / 20,638 | 67,421 / 67,421 |
| spring-projects/spring-boot v4.1.1 | Code-only extract | 37.7 | 125.9 | 3.3× | 3 | 87,595 / 87,590 | 303,837 / 303,566 |
| | Priming update | 48.2 | 207.9 | 4.3× | 3 | 87,598 / 87,593 | 303,839 / 303,568 |
| | Update with no change | 35.2 | 106.8 | 3.0× | 3 | 87,598 / 87,593 | 303,839 / 303,568 |
| rails/rails v8.1.4 | Code-only extract | 12.1 | 84.9 | 7.0× | 3 | 54,910 / 54,910 | 93,937 / 94,047 |
| | Priming update | 15.6 | 114.7 | 7.3× | 3 | 58,207 / 58,207 | 98,495 / 98,605 |
| | Update with no change | 10.4 | 73.5 | 7.1× | 3 | 58,207 / 58,207 | 98,495 / 98,605 |
| kubernetes/kubernetes v1.37.1 | Code-only extract | 68.3 | 1,546.9 | 22.7× | 1 | 256,329 / 244,784 | 1,400,392 / 1,394,490 |
| | Priming update | 109.2 | 1,872.5 | 17.1× | 1 | 260,459 / 248,914 | 1,404,074 / 1,399,050 |
| | Update with no change | 72.2 | 1,500.1 | 20.8× | 1 | 260,459 / 248,914 | 1,404,074 / 1,399,050 |
| microsoft/vscode 1.141.1 | Code-only extract | 115.6 | 624.5 | 5.4× | 1 | 249,081 / 248,901 | 974,695 / 978,776 |
| | Priming update | 164.8 | 922.0 | 5.6× | 1 | 253,812 / 253,632 | 981,848 / 985,929 |
| | Update with no change | 131.4 | 658.7 | 5.0× | 1 | 253,812 / 253,632 | 981,848 / 985,929 |
**Method.**
- **Operations.** As in the survey: a code-only extract into an empty output
folder, then a priming update and an update with nothing changed, with the
graph-file cap raised to 1 GiB for both programs' Kubernetes and VS Code
updates. Every measured run exited 0.
- **Runs.** One warm-up, then 3 measured runs per program for flask, ripgrep,
redis, prometheus, tokio, pandas, scikit-learn and rails; 3 measured runs
for react, next.js and spring-boot; one run for Kubernetes and VS Code.
Times are medians of the measured runs and include program start-up. A
speed-up is Graphify's time divided by Graphicle's, computed from the
unrounded times, so a few differ in the last digit from a division of the
rounded times shown.
- **CPUs.** Each program ran in chains of 3 CPUs, one run at a time per chain,
with 8 workers. Graphify's runs came first, in four chains at once, then
Graphicle's, in five chains at once, in one session each on 15 October
2026. The runs were not in alternating order, and other work ran on the
node's other CPUs.
- **Extra runs.** For flask, ripgrep, redis, prometheus, tokio, pandas and
scikit-learn, each program also made 3 further runs with finer memory
sampling. Their times are left out above; in them too, every Graphicle run
took less time than every Graphify run.
- **Records.** The run records name local paths, so they stay with the
maintainers.
### Peak memory against Graphify 0.9.91
**Label for every figure in this section:** a pre-release build with 0.1.1's
changes to how the engine holds its data (binary SHA-256 `c5435033…`,
15 October 2026) against Graphify 0.9.91 (the PyPI wheel, in a hash-locked
environment); one Linux node (two Intel Xeon Platinum 8480C, 96 cores; its
8 H100 GPUs were not used); 8 workers; the 13 repositories registered for
the survey above, with their tags in the table.
- **The measured build.** It does not contain the port of Graphify 0.9.89 to
0.9.91, which was merged into 0.1.1 afterwards, so its graphs are those of
the 0.1.0 engine. Graphify 0.9.91 changed its own graphs, so the two
programs' graphs differ in every measurement (on the Kubernetes extract, 256,329
against 244,784 nodes): each figure is the memory a program used to build
its own graph.
- **Measures.** Graphicle: the peak resident set (`ru_maxrss` from `wait4`)
and the sampled peak PSS, each the median of its runs. Graphify: the peak
PSS of its process tree, the median of 3 runs sampled every 20 ms (flask,
ripgrep, redis, prometheus, tokio, pandas and scikit-learn) or every
500 ms (react, next.js, spring-boot and rails), and one run sampled every
500 ms for Kubernetes and VS Code. A measurement counts as below Graphify only
when both of Graphicle's figures are below Graphify's, and the ratio is the
larger Graphicle figure over Graphify's, which is the conservative
comparison. In five update measurements Graphicle's sampled PSS is 1.5 to 3.7 MiB
above its peak resident set.
- **Operations.** As in the survey: a code-only extract into an empty output
folder, a priming update and an update with nothing changed, with the
graph-file cap raised to 1 GiB for the Kubernetes and VS Code updates.
| Repository and tag | Operation | Graphicle: peak RSS, median (MiB) | Graphicle: peak PSS, median (MiB) | Graphicle runs | Graphify 0.9.91: peak PSS, median (MiB) | Graphify runs | Graphicle / Graphify |
|---|---|---|---|---|---|---|---|
| pallets/flask 3.1.3 | Code-only extract | 62.1 | 52.8 | 1 | 168 | 3 | 0.37 |
| | Priming update | 68.6 | 47.3 | 1 | 100 | 3 | 0.69 |
| | Update with no change | 46.8 | 35.7 | 1 | 89 | 3 | 0.53 |
| BurntSushi/ripgrep 15.2.0 | Code-only extract | 77.5 | 53.3 | 1 | 254 | 3 | 0.31 |
| | Priming update | 104.4 | 83.4 | 1 | 123 | 3 | 0.85 |
| | Update with no change | 65.9 | 56.3 | 1 | 95 | 3 | 0.69 |
| redis/redis 8.10.2 | Code-only extract | 170.5 | 156.8 | 1 | 441 | 3 | 0.39 |
| | Priming update | 418.2 | 396.3 | 1 | 577 | 3 | 0.72 |
| | Update with no change | 220.5 | 201.8 | 1 | 492 | 3 | 0.45 |
| prometheus/prometheus v3.15.0 | Code-only extract | 207.2 | 193.6 | 3 | 484 | 3 | 0.43 |
| | Priming update | 463.8 | 436.0 | 3 | 542 | 3 | 0.86 |
| | Update with no change | 235.2 | 216.2 | 3 | 471 | 3 | 0.50 |
| tokio-rs/tokio tokio-1.53.3 | Code-only extract | 107.6 | 102.0 | 3 | 268 | 3 | 0.40 |
| | Priming update | 234.0 | 199.7 | 3 | 242 | 3 | 0.97 |
| | Update with no change | 128.3 | 111.0 | 3 | 194 | 3 | 0.66 |
| facebook/react v19.3.0 | Code-only extract | 340.2 | 330.8 | 1 | 682 | 3 | 0.50 |
| | Priming update | 758.3 | 759.9 | 1 | 993 | 3 | 0.77 |
| | Update with no change | 424.4 | 417.9 | 1 | 1,005 | 3 | 0.42 |
| vercel/next.js v16.4.0 | Code-only extract | 1,426.2 | 1,422.8 | 1 | 2,800 | 3 | 0.51 |
| | Priming update | 2,933.5 | 2,936.7 | 1 | 3,451 | 3 | 0.85 |
| | Update with no change | 2,941.1 | 2,934.0 | 1 | 3,571 | 3 | 0.82 |
| pandas-dev/pandas v3.0.6 | Code-only extract | 666.1 | 626.5 | 1 | 1,754 | 3 | 0.38 |
| | Priming update | 782.1 | 741.4 | 1 | 2,326 | 3 | 0.34 |
| | Update with no change | 784.5 | 771.1 | 1 | 2,161 | 3 | 0.36 |
| scikit-learn/scikit-learn 1.9.1 | Code-only extract | 381.7 | 353.7 | 1 | 928 | 3 | 0.41 |
| | Priming update | 493.3 | 475.2 | 1 | 1,437 | 3 | 0.34 |
| | Update with no change | 379.4 | 375.1 | 1 | 1,309 | 3 | 0.29 |
| spring-projects/spring-boot v4.1.1 | Code-only extract | 1,046.5 | 1,045.3 | 7 | 1,111 | 3 | 0.94 |
| | Priming update | 2,428.5 | 2,430.0 | 5 | 3,108 | 3 | 0.78 |
| | Update with no change | 1,538.1 | 1,539.8 | 3 | 2,485 | 3 | 0.62 |
| rails/rails v8.1.4 | Code-only extract | 404.6 | 398.3 | 1 | 524 | 3 | 0.77 |
| | Priming update | 920.0 | 879.8 | 1 | 1,072 | 3 | 0.86 |
| | Update with no change | 491.7 | 481.3 | 1 | 901 | 3 | 0.55 |
| kubernetes/kubernetes v1.37.1 | Code-only extract | 2,091.5 | 2,085.2 | 3 | 2,767 (see below) | 1 | 0.76 |
| | Priming update | 8,124.4 | 8,117.8 | 1 | 12,242 | 1 | 0.66 |
| | Update with no change | 5,021.9 | 5,015.7 | 1 | 10,819 | 1 | 0.46 |
| microsoft/vscode 1.141.1 | Code-only extract | 3,078.5 | 3,074.6 | 2 | 5,901 | 1 | 0.52 |
| | Priming update | 6,431.0 | 6,428.9 | 1 | 9,214 | 1 | 0.70 |
| | Update with no change | 4,006.5 | 4,010.2 | 1 | 10,217 | 1 | 0.39 |
- **Below Graphify 0.9.91 in all 39 measurements**, from 0.29 to 0.97 times its
figure. The closest measurements are the tokio priming update (0.97) and the
spring-boot extract (0.94).
- **Graphify's Kubernetes extract** ran once on each of two nodes of this
type: 2,767 MiB (in the table), on the node where Graphicle ran, and
2,781 MiB on the other. Against the second figure, the ratio is 0.75.
- **The merged 0.1.1 source.** After the port of Graphify 0.9.91 and these
changes were merged, a build of the 0.1.1 source was measured again in five
of the 39 measurements, 2 or 3 runs each, against Graphify 0.9.91's figures from the same
node. It stayed below Graphify in every run:
| Measurement | Runs | 0.1.1 source: highest peak RSS (MiB) | Graphify 0.9.91: peak PSS (MiB) | Ratio |
|---|---|---|---|---|
| Kubernetes, code-only extract | 2 | 2,148.0 | 2,767 | 0.78 |
| next.js, code-only extract | 2 | 1,429.9 | 2,800 | 0.51 |
| spring-boot, code-only extract | 2 | 1,056.2 | 1,111 | 0.95 |
| tokio, priming update | 3 | 234.8 | 242 | 0.97 |
| flask, update with no change | 3 | 47.4 | 89 | 0.53 |
- **The same graphs.** On the repositories checked, these changes leave the
graph as it was: the measured build wrote the same graphs as the build
without them, and the merged 0.1.1 build's `graph.json` files are
byte-identical to those of the Graphify 0.9.91 port without them, apart
from the version stamp.
- **Records.** The run records name local paths, so they stay with the
maintainers.
## Coding agents with Graphicle, Graphify or neither
Four task sets asked whether Claude Code finds code or facts better, or
with fewer tokens, with Graphicle, with Graphify, or with neither ("plain
Claude Code": its built-in Read, Grep and Glob tools, plus read-only shell
commands where a test allowed them). **Label for every figure in this
section:** Claude Code 2.1.287 with `claude-opus-5-5` at effort medium,
unless a figure names Claude Haiku 5.5 (`claude-haiku-5-5`, Claude Code
2.1.300); one run per task and setup, on 14 and 15 October 2026, with Claude
Code running on a Linux node. Each test was registered before any answer was
scored. Intervals are 95% paired bootstrap intervals over the tasks or
questions (10,000 resamples). A difference counts only when its interval
excludes 0; otherwise it is a tie, with no measured difference. Tokens are
the billed tokens (input, cache creation, cache read and output). Figures
from different task sets are not comparable. The test harnesses and run
records are not part of this repository. None of these tests measures long
sessions or memory built up across coding sessions.
**The setups.**
- **Graphicle** differs by task set, and each table names it:
- SWE-bench Verified: Graphicle 0.1.0 with `graphicle setup`'s defaults (25 MCP tools, guard hooks that add a note
before searches and reads, session hooks and an `AGENTS.md` section).
- Graphify's showcase corpus: the 0.1.1 agent defaults (`graphicle setup`
on a pre-release build), with an index that also read the papers and
images (`graphicle graph extract . --docs`, through Claude Code).
- Our own project: the same pre-release build and defaults, plus a
prototype hook, not shipped, that adds the output of
`graphicle context ` (about 9,000 characters) to each prompt.
- Code the model has not seen: a prototype hook, not shipped, that adds a
card of up to 6 likely files, ranked from Graphicle 0.1.0's index and the
Git history, to the first prompt. There are no Graphicle tools in this
setup.
- **Graphify 0.9.91** (the PyPI wheel) with its Claude Code setup:
`graphify install --platform claude`, an extract (code only, except on its
showcase corpus, where its document pass read the papers and images through
Claude Code), `graphify cluster-only`, `graphify export html` and
`graphify claude install`.
### Finding the files a fix changes: 100 SWE-bench Verified tasks
100 tasks of SWE-bench Verified, stratified by repository (all Python:
django 46, sympy 15, sphinx 9, matplotlib 7, scikit-learn 7, astropy 4,
xarray 4, pytest 4, pylint 2 and requests 2). The prompt holds the issue
text and asks the agent, without editing anything, to list at most 5 files
where the code must change. A task counts when the agent lists every file
the real fix changed, tests and docs aside. Plain Claude Code and Graphicle
ran back to back on each task. Graphify's runs were registered as a second
test and ran later; 20 plain Claude Code runs repeated at that time showed
no measured drift (tokens +237 [−3,071, +3,966]).
| Setup | Every changed file found | Tokens per task, mean | Against plain Claude Code [95% interval] |
|---|---|---|---|
| Plain Claude Code | 95 of 100 | 23,348 | |
| Graphicle 0.1.0, default setup | 95 of 100 | 27,133 | found: 0.0 points [−3.0, +3.0], a tie; tokens +3,784 (+16%) [+254, +6,393] |
| Graphify 0.9.91 | 94 of 100 | 30,199 | found: −1.0 points [−5.0, +2.0], a tie; tokens +6,851 (+29%) [+3,249, +9,541] |
- **Graphicle's tools were never called.** In none of the 100 Graphicle runs
did the agent call a Graphicle tool, so its extra tokens are the text that
setup adds to every request; 0.1.1 trims that text. The agent called
`graphify query` in all 100 Graphify runs (2 of those calls were denied by
the run's permission rules).
- **Graphify against Graphicle** (a secondary comparison, registered without
a significance claim): found −1.0 points [−3.0, 0.0], a tie; tokens +3,066
[+1,120, +5,000].
### Code the model has not seen: 93 tasks
93 commits from Graphicle's own private development, made after 1 July 2026
and so after the model's training data. The prompt is the commit message,
without paths or trailers, and the agent lists at most 5 files to change. A
task counts when the agent lists every existing code file the commit
changed, tests and docs aside. 28 of the 93 commits changed more than 5 such
files, so no setup can find all of their files.
| Setup | Every changed file found | Tokens per task, mean (median) |
|---|---|---|
| Plain Claude Code | 53 of 93 (57.0%) | 123,964 (109,295) |
| Prototype card from Graphicle 0.1.0's index (not shipped) | 53 of 93 (57.0%) | 114,272 (98,373) |
| Graphify 0.9.91 | 54 of 93 (58.1%) | 142,342 (128,875) |
| Pair | Found: difference [95% interval] | Tokens: ratio of the sums, minus 1 [95% interval] |
|---|---|---|
| Card − plain | +0.0 points [−4.3, +4.3], a tie | −7.8% [−18.6, +3.7], a tie |
| Graphify − plain | +1.1 points [−4.3, +6.5], a tie | +14.8% [+4.1, +27.2] |
| Card − Graphify | −1.1 points [−6.5, +4.3], a tie | −19.7% [−27.6, −11.0] |
- **The card** appeared on 51 of the 93 tasks (its gate held it back on the
others), and about a third of the files it listed were right. Its hook made
a run 4.2 s [+2.2, +6.3] slower than plain Claude Code (hook median 5.9 s).
- **Graphify's recall@3**, a secondary measure, was higher than plain Claude
Code's: +0.047 [+0.010, +0.092].
- **With Claude Haiku 5.5** (plain Claude Code and the card only): 36 and 40
of 93 found (38.7% and 43.0%), +4.3 points [−2.2, +11.8], a tie; tokens
−7.5% [−22.8, +11.9], a tie; the card made a run 6.2 s [+4.6, +7.8]
slower.
### Questions about Graphify's showcase corpus: 30 questions
Graphify's own showcase corpus: nanoGPT, minGPT and micrograd, 5 papers and
4 images. 30 questions (10 lookups, 10 that combine several sources and 10
that connect code to a paper) with 108 gold facts, written from the sources
before any setup ran on them and scored by fixed regular expressions. Each
index was built once, with Claude Sonnet 5.5 reading the papers and images
(Graphicle 334.1k tokens, Graphify 419.1k), and copied into each run.
| Setup | Facts found [95% interval] | Tokens per answer, mean (median) | Index build, per question |
|---|---|---|---|
| Plain Claude Code | 94.7% [88.6, 99.2] | 183.7k (60.8k) | none |
| Graphify 0.9.91 | 87.8% [79.7, 95.0] | 113.5k (87.1k) | 14.0k |
| Graphicle: 0.1.1 agent defaults (pre-release build) | 99.2% [97.5, 100] | 81.8k (69.2k) | 11.1k |
| Pair | Facts found: difference [95% interval] | Tokens per answer: difference [95% interval] |
|---|---|---|
| Graphicle − plain | +4.4 points [−0.8, +11.1], a tie | no saving claimed (below) |
| Graphicle − Graphify | +11.4 points [+4.2, +19.7] | −31.8k [−58.9k, −8.2k]; with both index builds counted, −34.6k [−61.8k, −11.0k] |
| Graphify − plain | −6.9 points [−14.2, −0.6] | −70.2k [−234.2k, +30.5k], a tie |
- **No token saving against plain Claude Code.** With Graphicle's index
build counted, the difference is −90.8k [−249.8k, +2.5k], a tie. Plain
Claude Code's mean rests on one run that used 2.31M tokens, and its median
is the lowest of the three, so we do not read Graphicle's lower mean as a
saving.
- **Where Graphify's gap is** (descriptive: 10 questions, no interval). On
the 10 questions that connect code to a paper, the facts found were 89% for
plain Claude Code, 73% for Graphify and 98% for Graphicle.
- **A fourth setup**, a prototype that pushes Graphicle's context into each
prompt, found 96.4% [92.8, 99.2] of the facts, a tie with Graphicle's
defaults (−2.8 points [−6.1, 0.0]).
- **Limits.** One corpus; the questions were written by our own preparation
agent and are scored by regular expressions.
### Questions about our own project: 60 questions
60 questions from two days of our own work on Graphicle, 12 in each of 5
groups (where something is, what was decided, the status of a run, how to
do something, and facts that went stale), with 177 gold facts. The corpus is
our notes, memory files and development repository (3,062 files). The tools
were Read, Grep and Glob, plus Graphify's own commands in its setup.
| Setup | Facts found | Tokens per question, mean (median) |
|---|---|---|
| Plain Claude Code | 97.4% | 88.5k (66.7k) |
| Plain Claude Code with our `MEMORY.md` index | 97.5% | 90.0k (65.0k) |
| Graphicle: 0.1.1 agent defaults (pre-release build) plus a prototype context hook (not shipped) | 97.1% | 82.4k (59.1k) |
| Graphify 0.9.91 | 98.5% | 129.9k (97.1k) |
| Pair | Facts found: difference [95% interval] | Tokens per question: difference [95% interval] |
|---|---|---|
| Graphicle − plain | −0.3 points [−3.9, +4.2], a tie | −6.2k [−22.4k, +9.0k], a tie |
| Graphify − plain | +1.1 points [−2.2, +5.6], a tie | +41.4k [+18.8k, +75.8k] |
| Graphify − Graphicle | +1.4 points [−1.3, +4.0], a tie | +47.6k [+22.0k, +85.0k] |
- **Graphicle's tools were never called.** Graphicle reached the agent
through the hook's context, which held a gold source file for 31 of the 60
questions. Graphicle's runs took 3.5 s [+1.9, +5.1] longer than plain
Claude Code's.
- **Graphify's graph held none of the sources.** As registered, and as in the
SWE-bench test, Graphify's document pass, which calls a model, was not run,
so its graph held only the code, and every gold fact's source is a Markdown
note. Each Graphify run called `graphify query` once and then searched,
after a graph build that took 42 s on average and is not in its time.
- **Limits.** One author wrote the questions and answers, without blinding;
the questions name distinctive terms that grep finds easily; Graphify's
runs could also use some read-only shell commands that the others could
not; with scores near the ceiling, only large differences could show.
## Agent memory: comparison with seven memory systems
Seven memory systems and a build of Graphicle answered the same questions
from 11 to 13 October 2026, on GPU nodes of one type with the same LLM server
setup and evaluation harness, under a protocol that was registered before
any answer was scored. The other systems ran on 11 and 12 October. Graphicle's
arm configuration was registered on 13 October, after their scores were
final and before its own first model call ([Method](#method)). Its records
call the comparison R6.
### Labels
These labels apply to every result in this section:
- **Graphicle R5 with the evaluation renderer render_v2.py (not shipped).**
This is the Graphicle arm: a pre-release build of Graphicle Core
(commit ef4e0fe, 13 October 2026; binary SHA-256 `2447d547…`).
- It was built with the `local-inference` feature, which the release
archives leave out ([install.md](install.md#build-from-source)), and with
the change that lets `worker_concurrency` go up to 64 (it was 4), which
0.1.0 ships. The arm set it to 16, so up to 16 observer jobs ran at once.
- It embedded with an int8 ONNX export of bge-small-en-v1.5
(`Xenova/bge-small-en-v1.5`) in its own process, on the CPU, not through
the shared embedding server that the other systems called.
- The reader's context was composed from its `context` and
`observer.context` results by `render_v2.py`, a renderer of the
evaluation harness that this release does not ship.
A 0.1.0 release archive therefore cannot run this configuration as it ran.
- **Development sets.** LoCoMo-10, LME-84 and BEAM-100K are development sets:
Graphicle's context composition was selected on them with this reader and
judge. R6 has no held-out set.
- **LME-84** is category-balanced (84 LongMemEval-S questions, 12 from each of
7 strata); it is not a LongMemEval score.
- **BEAM-100K** is judge validated on LongMemEval only.
- **Proxy evaluator.** Qwen3.8-27B-FP8 is the reader, the judge and every
system's LLM. These numbers cannot be set against any vendor's published
numbers.
- **Readers.** Every row gives the strong reader (secondary) beside the weak
reader (primary), and LLM calls and tokens beside accuracy.
### Scores
Each score is in points (0–100) on the same questions, with a 95% interval:
accuracy on LoCoMo-10 and LME-84, and the mean rubric score on BEAM-100K.
Every question stays in the denominator, and a failure scores 0.
The second prompt path is the Agent Memory Benchmark's own prompt, read by the
weak reader. Each system ran in its best declared configuration. LLM calls
and tokens are each system's own model calls during ingestion, per
conversation ([how they were counted](#calls-and-tokens)).
**LoCoMo-10** (development set; 1,540 questions in 10 conversations)
| System (configuration) | Weak reader, primary [95% CI] | Second prompt path [95% CI] | Strong reader, secondary [95% CI] | LLM calls per conversation | Prompt / completion tokens per conversation |
|---|---|---|---|---|---|
| Graphicle R5 with the evaluation renderer render_v2.py (not shipped) | 87.66 [85.13, 90.20] | 87.99 [85.95, 90.01] | 87.66 [86.39, 88.86] | 12.2 | 43.4K / 13.5K |
| Hindsight 0.10.2, observations on (`hindsight-obs`) | 87.27 [85.63, 89.06] | 87.53 [85.90, 89.27] | 87.14 [86.04, 88.33] | 160.0 | 1.14M / 69.4K |
| Mem0 OSS 2.2.1, dated (`mem0`) | 81.88 [79.59, 84.36] | 80.97 [79.02, 83.14] | 82.01 [80.00, 83.91] | 332.0 | 3.18M / 34.3K |
| MemMachine 0.4.0 | 79.55 [77.26, 81.97] | 80.26 [77.60, 83.01] | 81.30 [79.22, 83.76] | 22.6 | 140.3K / 3.7K |
| Honcho 3.2.2 | 79.16 [76.21, 82.15] | 77.73 [74.57, 80.45] | 80.45 [78.21, 83.00] | 221.3 | 1.25M / 78.2K |
| Cognee 1.6.3 | 69.48 [67.32, 71.24] | 68.57 [65.75, 71.18] | 70.26 [67.18, 72.68] | 205.9 | 290.7K / 65.1K |
| Graphiti (graphiti-core 0.30.2) | 46.49 [43.99, 48.88] | 37.14 [34.28, 40.07] | 49.29 [46.51, 52.05] | 1,362.6 | 4.52M / 108.7K |
| Mastra Observational Memory (@mastra/memory 1.36.0) | 38.57 [33.56, 43.10] | 37.21 [32.46, 41.80] | 43.51 [38.58, 48.14] | 22.3, and 1 per question | 356.4K / 15.1K |
| Calibration: Hindsight's published contexts, read by the same reader and judge | 88.18 [86.31, 90.29] | — | 87.66 [86.39, 89.07] | — | — |
**LME-84** (development set; category-balanced; not a LongMemEval score; 84 questions)
| System (configuration) | Weak reader, primary [95% CI] | Second prompt path [95% CI] | Strong reader, secondary [95% CI] | LLM calls per conversation | Prompt / completion tokens per conversation |
|---|---|---|---|---|---|
| Graphicle R5 with the evaluation renderer render_v2.py (not shipped) | 92.86 [86.90, 97.62] | 94.05 [89.29, 98.81] | 95.24 [90.48, 98.81] | 45.8 | 161.8K / 63.4K |
| MemMachine 0.4.0 | 92.86 [86.90, 97.62] | 92.86 [86.90, 97.62] | 92.86 [86.90, 97.62] | 47.9 | 152.3K / 8.7K |
| Hindsight 0.10.2 (`hindsight`) | 85.71 [77.38, 92.86] | 86.90 [79.76, 94.05] | 90.48 [83.33, 96.43] | 258.8 | 1.00M / 55.0K |
| Mem0 OSS 2.2.1, dated (`mem0`) | 85.71 [78.57, 92.86] | 83.33 [75.00, 90.48] | 89.29 [82.14, 95.24] | 247.5 | 2.43M / 36.6K |
| Honcho 3.2.2 | 76.19 [66.67, 84.52] | 83.33 [75.00, 90.48] | 83.33 [75.00, 90.48] | 220.5 | 1.47M / 75.9K |
| Cognee 1.6.3 | 75.00 [65.48, 83.33]; as read: 82.14 [73.81, 90.48] | 72.62 [63.10, 82.14]; as read: 80.95 | 78.57 [69.05, 86.90]; as read: 86.90 | 573.0 | 819.3K / 312.4K |
| Mastra Observational Memory (@mastra/memory 1.36.0) | 60.71 [50.00, 71.43] | 66.67 [57.14, 76.19] | 64.29 [53.57, 73.81] | 55.8, and 1 per question | 1.01M / 42.8K |
| Graphiti (graphiti-core 0.30.2) | not run (cost; decided on 11 October 2026) | — | — | — | — |
| Calibration: Hindsight's published contexts, read by the same reader and judge | 88.10 [80.95, 94.05] | — | 91.67 [85.71, 97.62] | — | — |
**BEAM-100K** (development set; judge validated on LongMemEval only; 400
questions in 20 conversations; the score is the mean rubric score)
| System (configuration) | Weak reader, primary [95% CI] | Second prompt path [95% CI] | Strong reader, secondary [95% CI] | LLM calls per conversation | Prompt / completion tokens per conversation |
|---|---|---|---|---|---|
| Graphicle R5 with the evaluation renderer render_v2.py (not shipped) | 67.32 [64.71, 69.96] | 62.70 [59.81, 65.47] | 69.82 [67.28, 72.34] | 24.3 | 126.4K / 33.3K |
| Mem0 OSS 2.2.1, dated (`mem0`) | 63.14 [59.77, 66.63] | 57.64 [54.37, 60.97] | 64.79 [60.86, 68.72] | 232.7 | 2.25M / 27.4K |
| Hindsight 0.10.2, observations on (`hindsight-obs`) | 62.77 [59.58, 65.71] | 59.77 [56.13, 63.48] | 68.67 [65.00, 72.01] | 305.4 | 3.20M / 139.8K |
| MemMachine 0.4.0 | 61.90 [58.36, 65.22] | 57.81 [54.06, 61.27] | 66.13 [62.48, 69.43] | 10.2 | 66.4K / 1.7K |
| Cognee 1.6.3 | 58.46 [55.68, 61.26] | 60.03 [56.34, 63.52] | 64.49 [61.28, 67.55] | 593.3 | 904.9K / 297.7K |
| Honcho 3.2.2 | 57.62 [54.79, 60.30] | 54.44 [51.03, 57.85] | 63.45 [60.58, 66.21] | 146.1 | 959.2K / 49.4K |
| Mastra Observational Memory (@mastra/memory 1.36.0) | 52.51 [49.55, 55.51] | 46.14 [42.36, 49.65] | 57.22 [53.19, 61.08] | 18.4, and 1 per question | 354.6K / 14.2K |
| Graphiti (graphiti-core 0.30.2) | 39.43 [35.65, 43.42] | 36.95 [33.97, 39.94] | 41.91 [38.52, 45.59] | 1,183.6 | 3.91M / 96.1K |
| Calibration: Hindsight's published contexts, read by the same reader and judge | 56.26 [51.65, 60.01] | — | 60.61 [54.63, 65.46] | — | — |
- **Failures** (each scores 0) of Graphicle R5 with the evaluation renderer
render_v2.py (not shipped): one weak answer on LoCoMo-10 was cut at 4,096
tokens; on the second prompt path, 17 answers on LoCoMo-10 and 14 on
BEAM-100K were truncated or invalid JSON, and one BEAM-100K request failed
at the evaluation's metering proxy (HTTP 502); the strong reader gave no
usable final answer for 12 of 1,540 LoCoMo-10 questions and 8 of 400
BEAM-100K questions.
- **Cognee on LME-84.** Three of Cognee's model requests timed out while it
re-ingested failed conversations, so the registered failure rule scores 8 of
its questions 0 on every path. "As read" scores them as they were answered.
- **The calibration row** replays the contexts of Hindsight's published Agent
Memory Benchmark run through the same reader and judge. It checks whether
this setup handicaps Hindsight; it is not a vendor-published number.
### The 21 registered comparisons
Each comparison is Graphicle R5 with the evaluation renderer render_v2.py (not
shipped) against one system's best declared configuration on one dataset, on
the weak reader. All three datasets are development sets.
| # | Dataset | System (configuration) | Weak scores: Graphicle R5 with the evaluation renderer render_v2.py (not shipped) / system | Difference [95% CI] | Bonferroni interval (21 comparisons) | Holm-adjusted p | Second prompt path: difference [95% CI] | Strong reader: difference [95% CI] | Verdict |
|---|---|---|---|---|---|---|---|---|---|
| 1 | LoCoMo-10 | Hindsight (`hindsight-obs`) | 87.66 / 87.27 | +0.39 [−0.80, +1.57] | [−1.41, +2.21] | 1.000 | +0.45 [−0.75, +1.81] | +0.52 [+0.00, +1.01] | matches |
| 1 | LoCoMo-10 | Hindsight's published contexts | 87.66 / 88.18 | −0.52 [−2.68, +1.78] | [−3.68, +3.05] | (same comparison) | no second path | +0.00 [−0.67, +0.63] | (same comparison) |
| 2 | LoCoMo-10 | Mem0 (`mem0`) | 87.66 / 81.88 | +5.78 [+3.99, +7.23] | [+2.74, +7.78] | 0.027 | +7.01 [+5.40, +8.74] | +5.65 [+4.31, +7.05] | beats |
| 3 | LoCoMo-10 | Graphiti | 87.66 / 46.49 | +41.17 [+37.68, +44.76] | [+35.69, +46.81] | 0.025 | +50.84 [+47.49, +54.38] | +38.38 [+35.18, +41.62] | beats |
| 4 | LoCoMo-10 | MemMachine | 87.66 / 79.55 | +8.12 [+5.95, +10.24] | [+4.88, +11.43] | 0.025 | +7.73 [+5.93, +9.11] | +6.36 [+4.13, +8.27] | beats |
| 5 | LoCoMo-10 | Mastra OM | 87.66 / 38.57 | +49.09 [+43.93, +54.58] | [+40.67, +58.23] | 0.025 | +50.78 [+45.87, +55.74] | +44.16 [+39.53, +49.15] | beats |
| 6 | LoCoMo-10 | Cognee | 87.66 / 69.48 | +18.18 [+15.43, +21.18] | [+14.23, +22.87] | 0.025 | +19.42 [+16.34, +22.89] | +17.40 [+14.70, +20.37] | beats |
| 7 | LoCoMo-10 | Honcho | 87.66 / 79.16 | +8.51 [+6.90, +9.96] | [+5.97, +10.64] | 0.025 | +10.26 [+8.47, +12.40] | +7.21 [+5.55, +8.56] | beats |
| 8 | LME-84 | Hindsight (`hindsight`) | 92.86 / 85.71 | +7.14 [+0.00, +14.29] | [−3.57, +19.05] | 0.287 | +7.14 [+0.00, +14.29] | +4.76 [−2.38, +11.90] | matches |
| 9 | LME-84 | Mem0 (`mem0`) | 92.86 / 85.71 | +7.14 [+0.00, +14.29] | [−3.57, +19.05] | 0.287 | +10.71 [+2.38, +19.05] | +5.95 [−1.19, +14.29] | matches |
| 10 | LME-84 | Graphiti | not run | — | — | 1 (entered) | — | — | not run |
| 11 | LME-84 | MemMachine | 92.86 / 92.86 | +0.00 [−5.95, +7.14] | [−10.71, +10.71] | 1.000 | +1.19 [−2.38, +4.76] | +2.38 [−3.57, +8.33] | matches |
| 12 | LME-84 | Mastra OM | 92.86 / 60.71 | +32.14 [+21.43, +42.86] | [+15.48, +48.81] | 0.002 | +27.38 [+17.86, +36.90] | +30.95 [+20.24, +41.67] | beats |
| 13 | LME-84 | Cognee | 92.86 / 75.00 | +17.86 [+8.33, +27.38] | [+2.38, +33.33] | 0.006 | +21.43 [+11.90, +30.95] | +16.67 [+7.14, +26.19] | no registered word: fails the as-read condition |
| 13 | LME-84 | Cognee, as read | 92.86 / 82.14 | +10.71 [+1.19, +20.24] | — | 0.181 | +13.10 [+4.76, +21.43] | +8.33 [+0.00, +16.67] | (the condition of comparison 13) |
| 14 | LME-84 | Honcho | 92.86 / 76.19 | +16.67 [+7.14, +26.19] | [+2.38, +32.14] | 0.009 | +10.71 [+2.38, +19.05] | +11.90 [+4.76, +20.24] | beats |
| 15 | BEAM-100K | Hindsight (`hindsight-obs`) | 67.32 / 62.77 | +4.55 [+1.63, +7.91] | [+0.21, +9.63] | 0.014 | +2.93 [−0.40, +6.36] | +1.14 [−2.51, +4.99] | no registered word: fails the second-path condition |
| 16 | BEAM-100K | Mem0 (`mem0`) | 67.32 / 63.14 | +4.17 [+1.07, +7.27] | [−0.45, +8.88] | 0.038 | +5.06 [+1.72, +8.24] | +5.03 [+1.59, +8.55] | beats |
| 17 | BEAM-100K | Graphiti | 67.32 / 39.43 | +27.88 [+23.39, +32.17] | [+21.02, +34.39] | 0.002 | +25.75 [+21.72, +29.64] | +27.90 [+23.14, +32.51] | beats |
| 18 | BEAM-100K | MemMachine | 67.32 / 61.90 | +5.42 [+2.02, +8.75] | [−0.00, +10.60] | 0.025 | +4.89 [+1.44, +8.42] | +3.68 [+0.04, +7.49] | beats |
| 19 | BEAM-100K | Mastra OM | 67.32 / 52.51 | +14.80 [+10.73, +18.71] | [+8.57, +20.81] | 0.002 | +16.56 [+12.40, +20.54] | +12.60 [+7.89, +17.56] | beats |
| 20 | BEAM-100K | Cognee | 67.32 / 58.46 | +8.86 [+6.26, +11.42] | [+4.93, +12.67] | 0.002 | +2.66 [−1.10, +6.45] | +5.33 [+2.49, +8.16] | no registered word: fails the second-path condition |
| 21 | BEAM-100K | Honcho | 67.32 / 57.62 | +9.70 [+7.49, +11.81] | [+6.42, +12.94] | 0.002 | +8.26 [+4.74, +11.51] | +6.37 [+2.93, +9.99] | beats |
How to read it:
- **Difference** is Graphicle R5 with the evaluation renderer render_v2.py
(not shipped) minus the system, in points, on the same questions.
- **The rule** was registered before the scores existed. "Beats" needs a
Holm-adjusted p below 0.05 over the 21 comparisons, a weak-reader interval
above zero and a second-path interval above zero. "Matches" means that the
weak-reader interval spans zero, and "trails" that it lies below zero. A
"beats" whose strong-reader interval lies below zero would become
"conflicting readers"; none did. Neither the strong reader nor the second
path can change a tie into a "beats".
- **No registered word.** Comparisons 13, 15 and 20 have a weak-reader
interval above zero but fail another condition of "beats", and the rule has
no word for that case.
- **Hindsight on LoCoMo-10.** A "beats" had to hold against both its best
fresh configuration and its published contexts, each under the full rule.
The comparison's p is the larger of the two.
- **Cognee on LME-84.** A "beats" had to hold also with its 8 zeroed
questions scored as read, a condition registered before Graphicle's arm ran.
- **Graphiti on LME-84** was not run because of its cost, and it is counted
in the Holm correction with p = 1.
### What the results allow us to say
The sentences below are the claims the registered analysis allows. Each one
carries the labels above: development sets, the proxy evaluator, and
Graphicle R5 with the evaluation renderer render_v2.py (not shipped), which
"it" means here. None of them is a headline claim: a "beats" needs held-out
confirmation first, and R6 has no held-out set.
1. On LoCoMo-10 (development set; Graphicle's context composition was selected
on it with this reader and judge), Graphicle R5 with the evaluation renderer
render_v2.py (not shipped) beats Mem0 (+5.78 points [+3.99, +7.23]),
MemMachine (+8.12), Honcho (+8.51), Cognee (+18.18), Graphiti (+41.17) and
Mastra OM (+49.09) under the pre-registered rule (Holm-adjusted p ≤ 0.027
over 21 comparisons; both prompt paths agree). R6 has no held-out LoCoMo
set, so this stays a development result.
2. On LoCoMo-10 it matches Hindsight: +0.39 points [−0.80, +1.57] against
Hindsight with observations on, its best fresh configuration here, and
−0.52 [−2.68, +1.78] against Hindsight's published AMB contexts read with
the same reader and judge.
3. On LME-84 (category-balanced; not a LongMemEval score; development set), it
beats Honcho (+16.67 points [+7.14, +26.19]) and Mastra OM (+32.14 [+21.43,
+42.86]) under the pre-registered rule (Holm-adjusted p 0.009 and 0.002). A
held-out LongMemEval split must confirm this before it is a headline claim.
4. On LME-84 it matches MemMachine (0.00 points [−5.95, +7.14]), Hindsight
(+7.14 [0.00, +14.29]) and Mem0 (+7.14 [0.00, +14.29]).
5. Against Cognee on LME-84 the registered difference is +17.86 points [+8.33,
+27.38]. With Cognee's 8 second-failure questions scored as read it is
+10.71 [+1.19, +20.24] (Holm-adjusted p 0.18), so the pre-registered rule
does not allow a 'beats'.
6. On BEAM-100K (judge validated on LongMemEval only; development set), it
beats Mem0 (+4.17 points [+1.07, +7.27]), MemMachine (+5.42 [+2.02, +8.75]),
Honcho (+9.70 [+7.49, +11.81]), Mastra OM (+14.80 [+10.73, +18.71]) and
Graphiti (+27.88 [+23.39, +32.17]) under the pre-registered rule.
BEAM-500K/1M (R7b) must confirm this before it is a headline claim.
Against Mem0 and MemMachine this rests on the registered cluster-bootstrap
p (Holm 0.038 and 0.025). An exact 20-conversation sign-flip test, which
was not registered, gives 0.118 and 0.059.
7. On BEAM-100K its leads over Hindsight with observations on (+4.55 points
[+1.63, +7.91]) and over Cognee (+8.86 [+6.26, +11.42]) are not confirmed
on AMB's native prompt path (+2.93 [−0.40, +6.36]; +2.66 [−1.10, +6.45]),
so neither is a 'beats'.
8. It trails none of the seven systems: no primary interval lies below zero in
the 20 registered comparisons that were run. Graphiti was not run on LME-84
(cost; user decision 2026-10-11).
9. Of the 21 pre-registered comparisons (development sets), 13 are 'beats', 4
'matches', 3 lead on the primary path without meeting every 'beats'
condition, none 'trails', and one was not run.
### Sensitivities
None of these changes a registered verdict. Two of them qualify the
BEAM-100K results against Mem0 and MemMachine.
- **Exact tests.** With an exact test on every dataset instead of the
registered bootstrap p on LME-84 and BEAM-100K, the BEAM-100K comparisons
with Mem0 and MemMachine would have Holm-adjusted p 0.118 and 0.059, and
would not be "beats". Every other verdict stays.
- **Bonferroni intervals** (reported, not part of the rule). Every "beats" has
a Bonferroni interval above zero except BEAM-100K against Mem0
([−0.45, +8.88]) and against MemMachine ([−0.00, +10.60]).
- **The failed BEAM-100K request.** Scoring the one request that failed at the
metering proxy as correct moves no second-path interval across zero.
- **LoCoMo-10 without its 99 audited gold-answer errors.** No verdict changes;
against Hindsight with observations on, the difference is +0.62
[−0.67, +1.81].
### Method
The protocol was written on 11 October 2026, before any scored answer was
read or judged, and each later change is a dated amendment (19 in all). The
Graphicle arm's configuration was registered on 13 October 2026, before its
first model call. Two amendments were decided after its weak-reader scores
had been seen: one changed the order of the remaining runs, the other added
two model servers. Neither changed a request, prompt, setting, statistic or
decision rule.
- **Datasets.** All three are development sets for Graphicle (see the labels).
- LoCoMo-10: all 1,540 questions in 10 conversations.
- LME-84: 84 LongMemEval-S questions, 12 from each of 7 strata.
- BEAM-100K: 400 questions in 20 conversations, scored by rubric.
- **Same models.** One model, Qwen3.8-27B-FP8 served by vLLM, does every
model step: it is every system's internal LLM, it reads each retrieved
context and answers, and it judges each answer. bge-small-en-v1.5 is every
system's embedder: the other systems called BAAI's weights on the shared
embedding server, and Graphicle ran an int8 ONNX export of it in its own
process (see the labels). These open models stand in for the hosted models
that published benchmark runs use.
- **The judge.** The judge was validated against GPT-4o on LongMemEval answers
only. A seven-case calibration ran before each judging session, as a smoke
test.
- **Ingestion.** Each system ingests the documents that the Agent Memory
Benchmark's loaders produce, with opaque identifiers, following its vendor's
own harness. No system sees a question before its conversation is ingested,
and none sees answers, evidence or categories.
- **Two readers and two prompt paths.**
- The weak reader (primary) does not think, runs at temperature 0 and
answers in at most 4,096 tokens.
- The strong reader (secondary) thinks, with up to 32,768 tokens; the judge
sees only its final answer.
- Each context is read through common prompts and, as a second path,
through the Agent Memory Benchmark's own prompts.
- **Systems and versions.**
- Mem0 OSS 2.2.1 (`mem0`, with dates; `mem0-nodate` was the other declared
configuration)
- Hindsight 0.10.2 (`hindsight` and `hindsight-obs`, observations on)
- Graphiti (graphiti-core 0.30.2)
- MemMachine 0.4.0
- Mastra Observational Memory (@mastra/memory 1.36.0)
- Cognee 1.6.3
- Honcho 3.2.2
A system with two declared configurations is compared, on each dataset,
in the one that scored higher there on the weak reader.
- **Calibration.** One arm replays Hindsight's published contexts through the
same reader and judge. It checks whether this setup handicaps that system.
- **Statistics.**
- The primary comparisons are Graphicle R5 with the evaluation renderer
render_v2.py (not shipped) against each system on each dataset, 21 in
all, Holm-corrected.
- Every question stays in the denominator, and a failure scores 0.
- Intervals come from paired cluster bootstraps (10,000 draws), clustered
by conversation (by question on LME-84).
- p values come from an exact sign-flip test over the 10 conversations on
LoCoMo-10, and from the two-sided cluster bootstrap on LME-84 and
BEAM-100K.
- **The claim rule** is the one under the comparison table above.
- **Records.** The protocol with its amendments, the per-question verdicts
and the analysis scripts are not in this repository yet; this page
summarizes them.
### Calls and tokens
- **What is counted.** LLM calls and tokens are each system's own model calls
while it ingests, counted by the evaluation's metering proxy and divided
among the conversations being ingested at the time. Every system ingested
its three datasets at once (Cognee one at a time), so the per-dataset
figures are estimates; each system's total is exact. Query-time calls are
separate: Mastra OM makes one LLM call per question, Graphicle makes none,
and the other systems make embedding calls only. The evaluator's own calls
(reading and judging) are not a system's cost.
- **Not a cost claim.** The other systems shared 2 to 4 GPUs and one metering
proxy while they ran; Graphicle's arm ran alone. These figures describe the
runs; they are not a speed or cost comparison.
- **Graphicle's calls and tokens** come from the same meter (tag
`tag-graphicle`) and were divided by the same analysis code as the other
systems': 4,456 LLM calls in all, with 16.56M prompt and 6.13M completion
tokens, all while it ingested, and every one answered (HTTP 200); 4 of
them ended at their output limit. It made no embedding calls to the model
servers, because it embeds in its own process.
## Agent memory with GPT models: early pre-release runs
Before the comparison above, in early pre-release evaluations on 8 October 2026, a pre-release build of Graphicle answered LoCoMo (1,540 questions) and LongMemEval-S (500 questions) through three published protocols, on Azure OpenAI models, as memory vendors publish their results:
- **mem0:** Mem0's published prompts, with GPT-5 (2025-08-07) as reader and judge.
- **gpt54-common:** the Omni prompts, with GPT-5.4 (2026-03-05, medium reasoning) as reader and GPT-4o (2024-11-20) as judge. This is not an exact replication of Zep's setup.
- **omni-adapted:** the published Omni prompts, with GPT-4.1-mini (2025-04-14) as reader and GPT-4o (2024-11-20) as judge, in place of the unavailable GPT-4o-mini.
Labels for every number in this section:
- **The build.** A pre-release build of Graphicle, whose memory notes were written by GPT-4.1-mini. `graphicle` is its retrieval alone, `graphicle_observer` adds the notes, and `plain` is a baseline without Graphicle.
- **The other rows are not fresh runs.** `hindsight_replay` and `amb_hybrid_replay` are fresh answers from the published, unchanged retrieval contexts of Hindsight's and the Agent Memory Benchmark's runs. The Mem0 figures are Mem0's own published result files: merged outputs, not a fresh run of the managed service.
- **Missing notes.** When the answers were scored, notes were missing for 142 of the 500 LongMemEval histories and for 1 of the 10 LoCoMo conversations. Every question stayed in the denominator, and a failure scored 0.
- **Intervals and gold labels.** LoCoMo intervals resample its ten conversations. About 6.4% of LoCoMo's gold answers are wrong (an independent audit), which caps a fully correct system near 93.6%.
| Dataset | Protocol | Memory or context | Correct | Accuracy [95% interval] | Reader or judge errors | Context tokens, mean |
| --- | --- | --- | ---: | --- | ---: | ---: |
| LoCoMo | gpt54-common | graphicle_observer | 1,392 / 1,540 | 90.39% [88.9, 91.8] | 0 | 13,232 |
| LoCoMo | gpt54-common | hindsight_replay | 1,395 / 1,540 | 90.58% [88.3, 92.6] | 2 | 35,604 |
| LoCoMo | mem0 | graphicle | 1,413 / 1,540 | 91.75% [89.8, 93.8] | 9 | 6,208 |
| LoCoMo | mem0 | graphicle_observer | 1,440 / 1,540 | 93.51% [92.0, 94.8] | 11 | 12,661 |
| LoCoMo | mem0 | plain | 1,382 / 1,540 | 89.74% [87.9, 91.7] | 7 | 6,233 |
| LoCoMo | omni-adapted | amb_hybrid_replay | 1,201 / 1,540 | 77.99% [75.2, 80.6] | 0 | 21,727 |
| LoCoMo | omni-adapted | graphicle | 1,330 / 1,540 | 86.36% [85.0, 87.8] | 0 | 6,408 |
| LoCoMo | omni-adapted | graphicle_observer | 1,330 / 1,540 | 86.36% [83.4, 89.2] | 0 | 13,232 |
| LoCoMo | omni-adapted | hindsight_replay | 1,347 / 1,540 | 87.47% [85.8, 89.0] | 0 | 35,604 |
| LoCoMo | omni-adapted | plain | 1,284 / 1,540 | 83.38% [82.1, 84.6] | 0 | 6,429 |
| LongMemEval-S | gpt54-common | graphicle_observer | 473 / 500 | 94.60% [92.3, 96.3] | 0 | 25,242 |
| LongMemEval-S | gpt54-common | hindsight_replay | 467 / 500 | 93.40% [90.9, 95.3] | 1 | 43,125 |
| LongMemEval-S | mem0 | graphicle | 411 / 500 | 82.20% [78.6, 85.3] | 1 | 5,771 |
| LongMemEval-S | mem0 | graphicle_observer | 463 / 500 | 92.60% [90.0, 94.6] | 1 | 24,176 |
| LongMemEval-S | mem0 | plain | 385 / 500 | 77.00% [73.1, 80.5] | 0 | 5,806 |
| LongMemEval-S | omni-adapted | amb_hybrid_replay | 385 / 500 | 77.00% [73.1, 80.5] | 0 | 22,907 |
| LongMemEval-S | omni-adapted | graphicle | 386 / 500 | 77.20% [73.3, 80.7] | 0 | 5,997 |
| LongMemEval-S | omni-adapted | graphicle_observer | 429 / 500 | 85.80% [82.5, 88.6] | 0 | 25,242 |
| LongMemEval-S | omni-adapted | hindsight_replay | 446 / 500 | 89.20% [86.2, 91.6] | 0 | 43,125 |
| LongMemEval-S | omni-adapted | plain | 380 / 500 | 76.00% [72.1, 79.5] | 0 | 6,035 |
Paired differences, candidate minus control:
| Dataset | Protocol | Comparison | Difference | Paired 95% interval |
| --- | --- | --- | ---: | --- |
| LongMemEval-S | omni-adapted | graphicle_observer vs hindsight_replay | -3.40 points | [-6.60, -0.20] |
| LongMemEval-S | gpt54-common | graphicle_observer vs hindsight_replay | +1.20 points | [-0.80, +3.20] |
| LoCoMo | omni-adapted | graphicle_observer vs hindsight_replay | -1.10 points | [-3.80, +1.79] |
| LoCoMo | gpt54-common | graphicle_observer vs hindsight_replay | -0.19 points | [-1.28, +0.83] |
| LoCoMo | mem0 | graphicle_observer vs Mem0's published files | +1.95 points | [+0.55, +3.55] |
| LoCoMo | mem0 | graphicle vs Mem0's published files | +0.19 points | [-1.27, +1.88] |
Mem0's published files score 1,410 of 1,540 (91.56%) on LoCoMo and 467 of 500 (93.4%) on LongMemEval-S under the mem0 protocol. These differ from the headlines in Mem0's README. No paired interval was computed for LongMemEval-S.
A citation audit checked the notes' quoted byte spans against the source files: 3,894 spans on LoCoMo and 507,874 on LongMemEval, with 0 integrity errors. It checks that each quote is exact, not that each note is complete or correct.
## Agent memory: how the retrieval defaults were chosen
Model-free retrieval runs chose the defaults. They ask whether the evidence
packet contains the gold evidence, not whether an answer is right. The
comparison above measured answers with a pre-release build and an evaluation
renderer that is not shipped, so **the answer accuracy of the shipped
defaults as they are has not been measured**. The run records of this
section are not published yet, so this page gives the decisions and not the
numbers.
- **On by default: `stem`, `speaker: "auto"` and `pack_focus`.** Paired runs
on LongMemEval-S and LongMemEval-M questions and on 120 questions about two
code repositories (httpx and click) chose them. Each option was added to the
one before it and tested with McNemar's test. These datasets are development
sets: the options were tuned on them.
- **Dense arm at weight 0.5.** On BEAM-100K units 5–20, which were held out
from the retrieval-weight tuning only (BEAM-100K is otherwise a development
set; see the [labels](#labels)), a dense arm at weight 0.5 tied stemmed BM25
alone, so the dense arm stays optional, at weight 0.5 (it was 2).
- **No cross-encoder by default.** A local cross-encoder reranker failed its
held-out check, whose pass rule was fixed before it ran, and it took many
times as long per question. It stays off, and it is not recommended for one
conversation's history.
- **`note_keys: "merge"`**, which keys passages by the notes that quote them,
raised evidence recall in the held-out check. It is kept, but off until its
effect on answers is measured.
## Independent measurements
People outside the project who measured Graphicle with their own scripts,
on their own machines, and published the results. The numbers below are
theirs, apart from our own run of the same questions, which says so.
### `graphicle context` on kubernetes, 0.1.3 and 0.1.5
[@selimaytac](https://github.com/selimaytac), who reported
[issue #8](https://github.com/Graphicle-AI/graphicle/issues/8), ran their 22
questions about kubernetes on Graphicle 0.1.3 and again on 0.1.5, and
published the script, the questions and the rows of both runs:
[selimaytac/benchmarks, graphicle-context](https://github.com/selimaytac/benchmarks/tree/main/graphicle-context).
Thank you for the report, the questions and the rerun.
**Label:** kubernetes at `ca8a2a9e4`, a shallow clone with the history since
1 June 2026; the 22 questions of issue #8; an Apple M3 Pro; no answer model
configured, so no model calls; published 23 October 2026.
| | 0.1.3 | 0.1.5 |
|---|---|---|
| `graphicle context`, median time per question | 153.5 s | 9.5 s |
| The prompt hook returned a packet (one pass) | not run | 18 of 22 |
- **A fixed cost per call.** On that machine each call of 0.1.5 takes
about 9 seconds whatever the question, just under the prompt hook's
default budget of 10 seconds. `GRAPHICLE_PROMPT_CONTEXT_SECONDS`, or
`graphicle config set prompt_context.seconds N` (1 to 25 seconds), raises
the budget.
- **The hook's 4 misses.** 2 of the 22 questions name no code, and the hook
does not read them as code questions; the other 2 ran past the budget in
that pass.
- **Rough ratio.** The 0.1.3 column is one round per question, measured
while the machine had other work for part of the run; the 0.1.5 column
is three rounds per question.
- **Our own run.** On 16 cores of a Linux server, the same 22 questions took
a median of 3.1 seconds with 0.1.5 (the 0.1.5 entry of the
[CHANGELOG](../CHANGELOG.md)). Our run of 0.1.8 against 0.1.7 is
[below](#our-own-run-on-kubernetes-017-and-018).
### Our own run on kubernetes, 0.1.7 and 0.1.8
0.1.8 reads the code graph's query file in place, instead of decoding the
whole saved graph at each call as 0.1.7 does. We ran the same 22 questions on
both releases.
**Label:** one Linux server (Intel Xeon Platinum 8480C), 16 of its cores, or
4 for a laptop-like run; kubernetes at `ca8a2a9e4`, a shallow clone (30,315
files); the 22 questions of issue #8, and 8 lookups such as "Where is X
defined?"; each call a new process, as the prompt hook runs it; both releases
on the same cores, interleaved; medians; 25 October 2026.
| Release | `graphicle context`, 22 questions, 16 cores | 22 questions, 4 cores | 8 lookups, 16 cores | 22 questions, 4 cores, file cache dropped before each call | Peak memory of a call, 22 questions, 16 cores |
|---|---|---|---|---|---|
| 0.1.7 | 2.99 s | 3.89 s | 2.52 s | 4.55 s | 3.5 GB |
| 0.1.8 | 1.34 s | 1.38 s | 0.96 s | 1.90 s | 0.6 GB |
- **Rounds.** The times are medians over 3 rounds of every question on 16
cores and 2 rounds on 4 cores, after one round that is not counted; with
the data folder and the program dropped from the file cache before each
call, over 1 round. The peak memory is the median of each call's peak
resident memory.
- **Same packets.** On the same store, both releases gave the same packet
for every question, byte for byte.
- **After upgrading.** Until the first `graphicle sync` after upgrading,
0.1.8 reads the code graph from the store instead (a median of 22.5 s per
question over the 22 questions, 16 cores); the
[CHANGELOG](../CHANGELOG.md) has the details.
- **The chart.** [`benchmarks/kubernetes_chart.py`](benchmarks/kubernetes_chart.py)
draws it from the table above: `assets/speed-kubernetes-light.svg` and
`-dark.svg`, with a PNG of each at twice the size.
## Reproducing
The memory benchmark kit is in `bench/memory`. It runs the real `graphicle`
program and contains the recall runners, an Agent Memory Benchmark provider and
the scorers. The datasets are not included; you pass their paths. The harness
of the comparison with seven memory systems and its evaluation renderer are not
part of this repository. The checks of the code-graph engine run from
`crates/graphicle-graph/` and need the pinned Python Graphify 0.9.88 reference;
see `crates/graphicle-graph/README.md`, section "Verification".