## Table of Contents
- [What is My Daily Monitor?](#-what-is-my-daily-monitor)
- [Quick Start](#-quick-start)
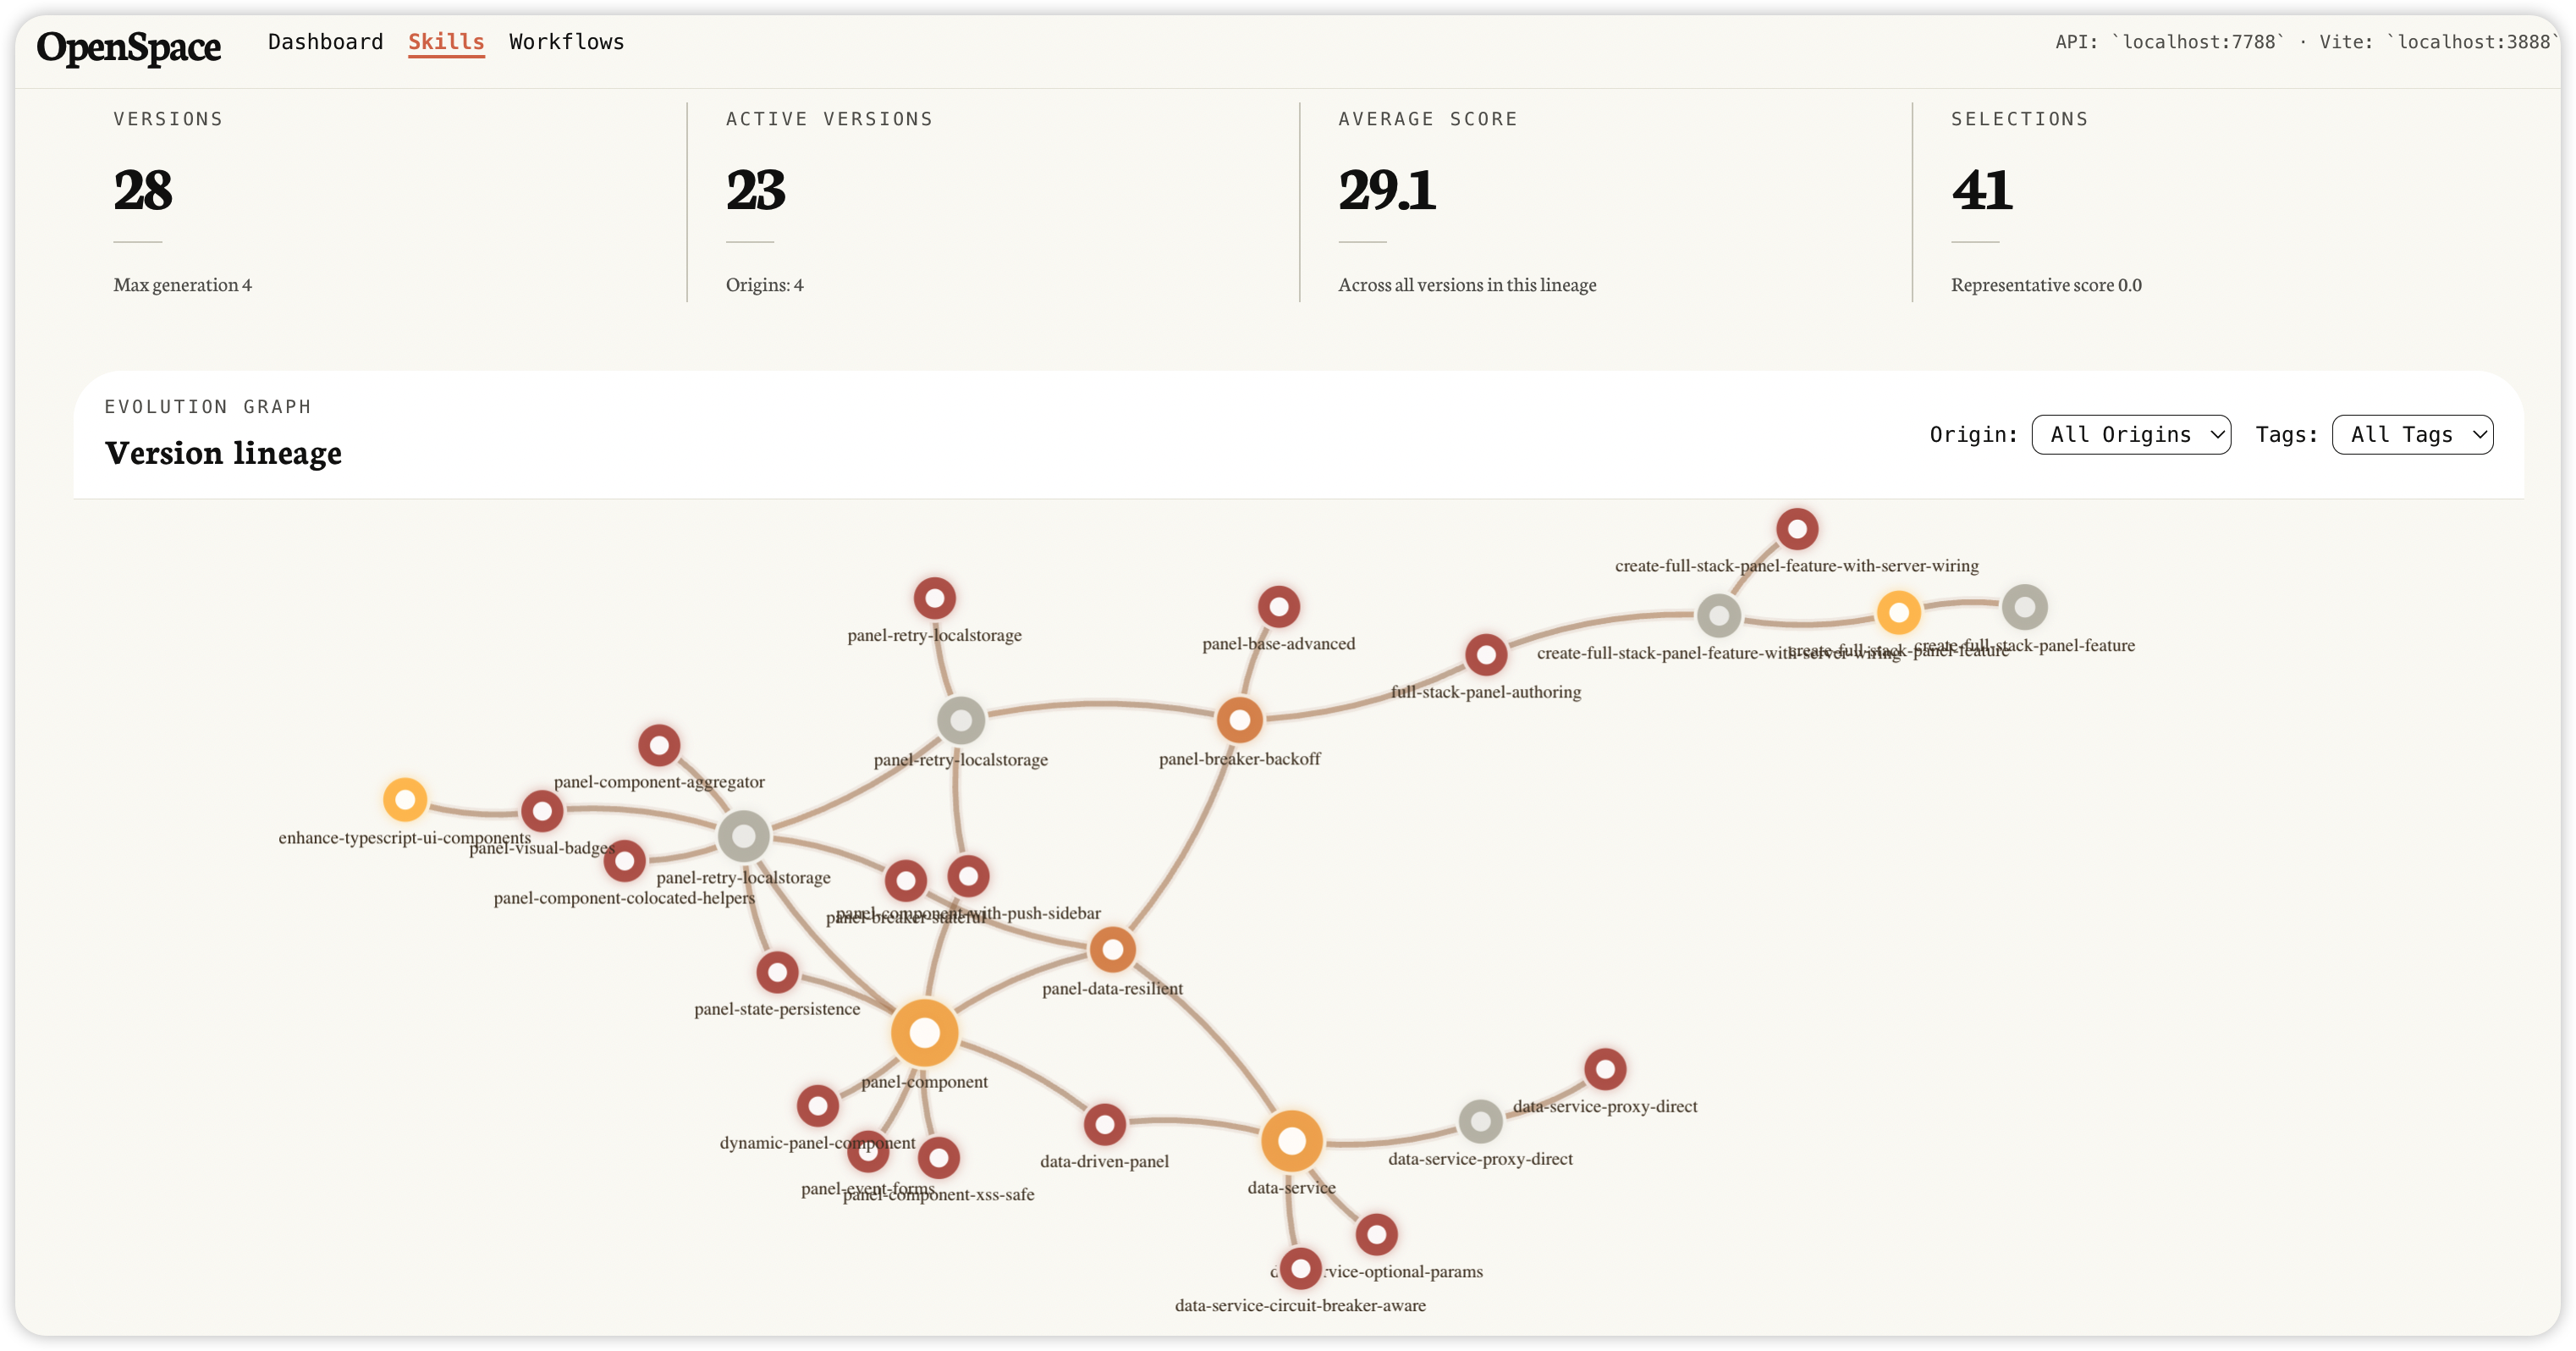
- [How Was It Generated?](#-how-was-it-generated--openspace-skill-evolution)
- [Project Structure](#%EF%B8%8F-project-structure)
- [Related](#-related)
---
## 📖 What is My Daily Monitor?
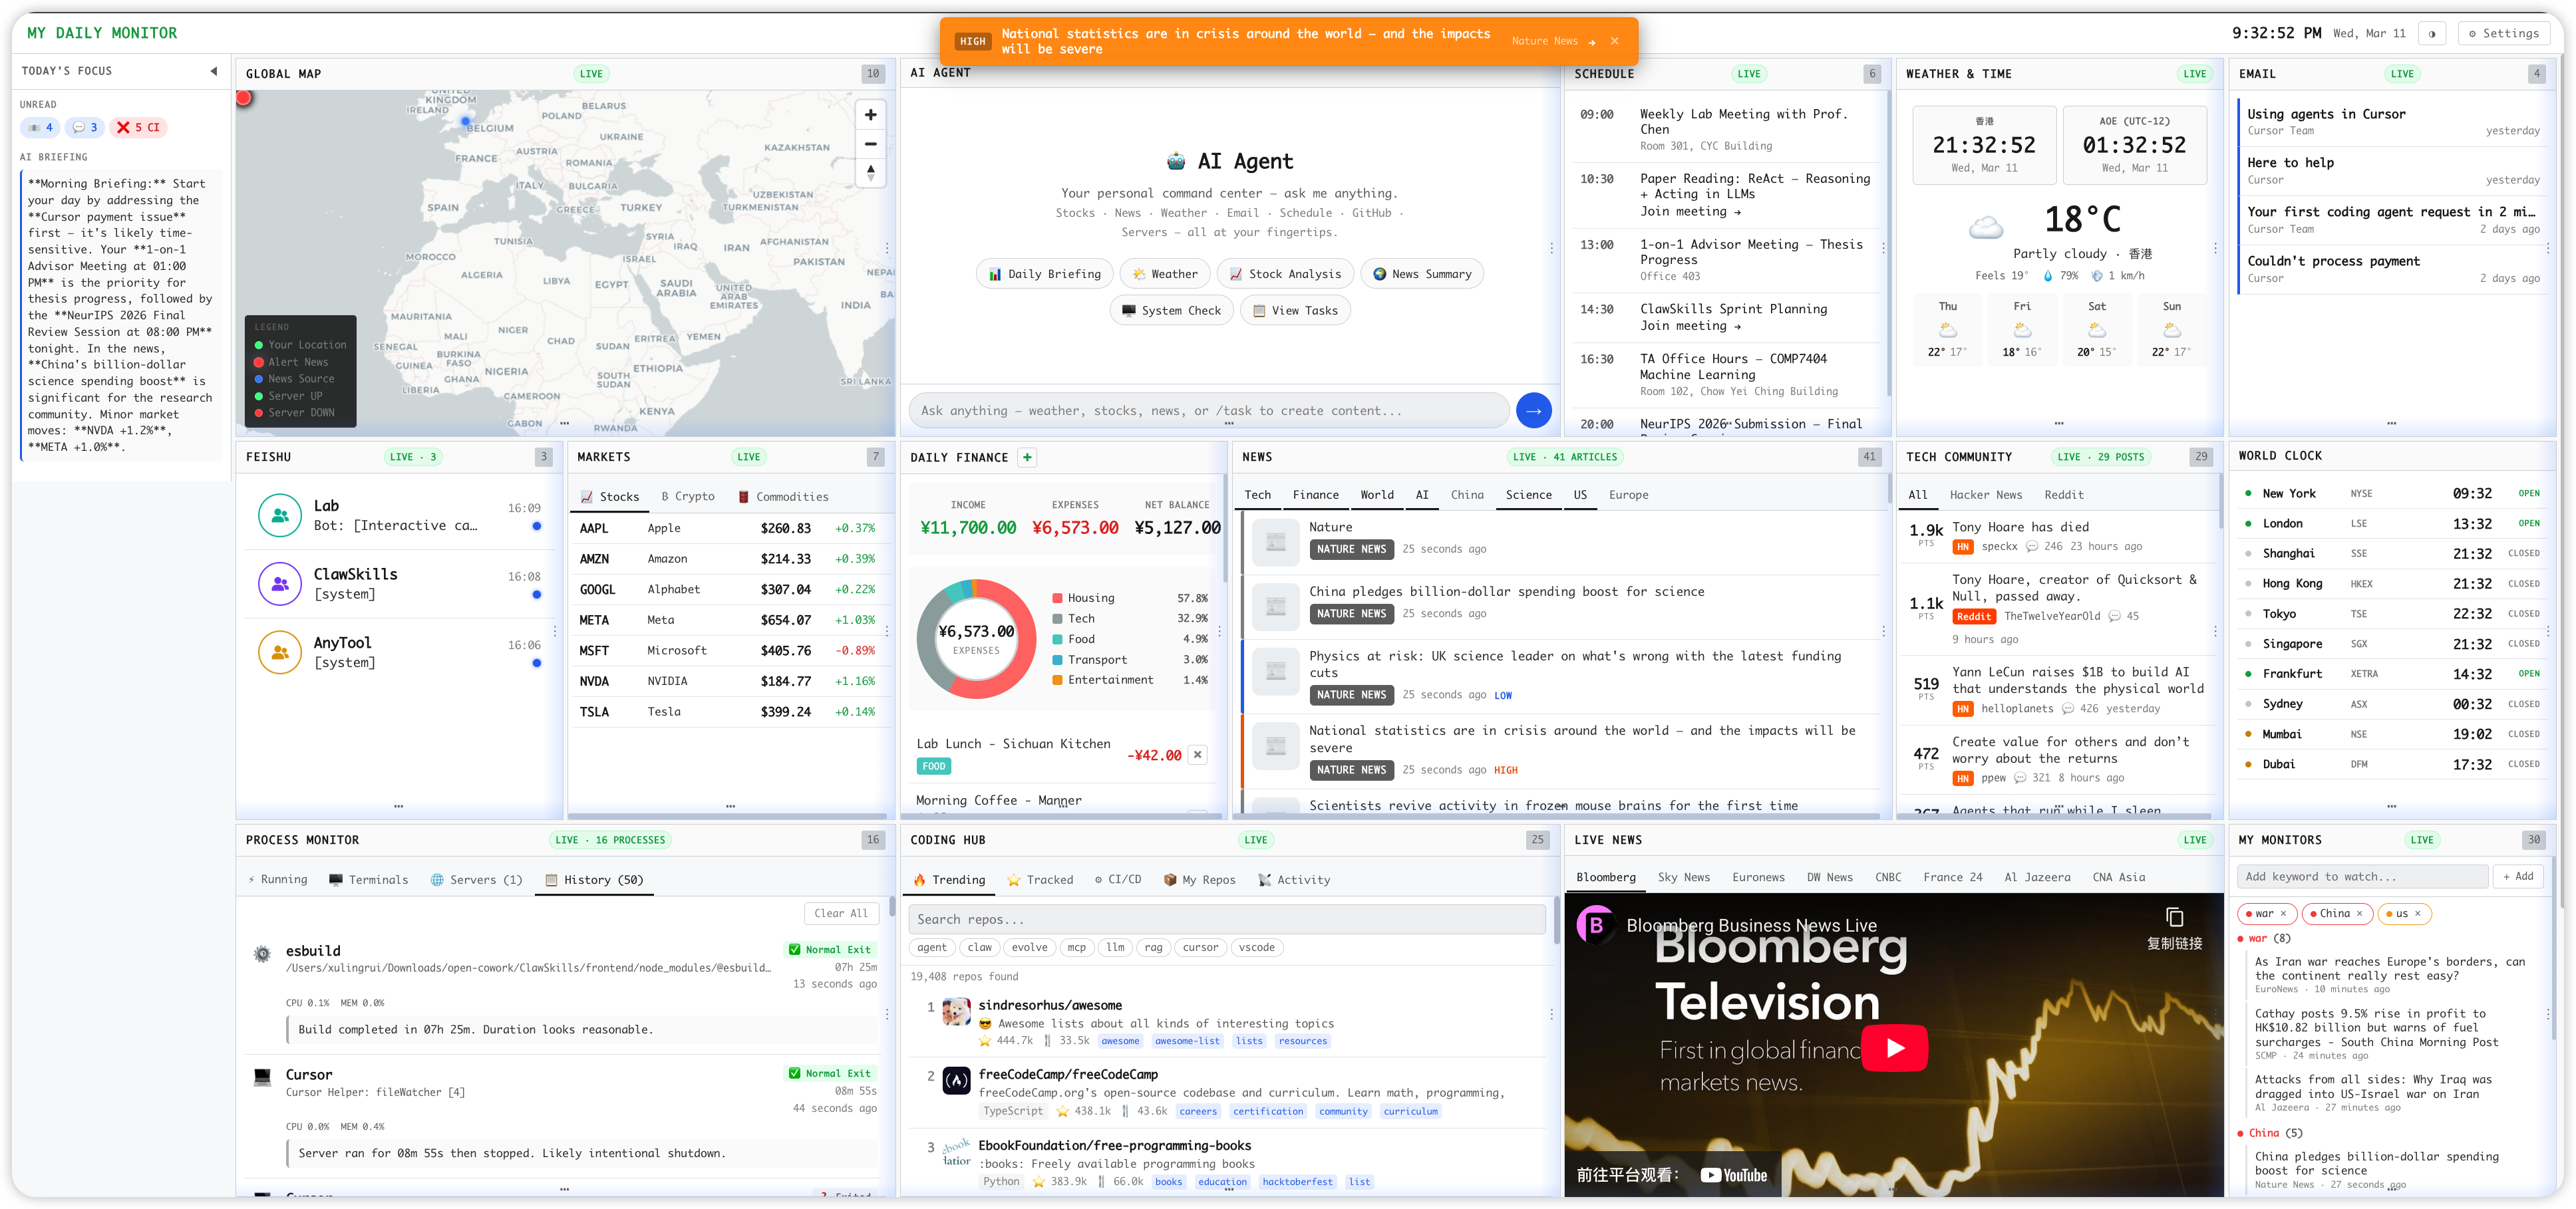
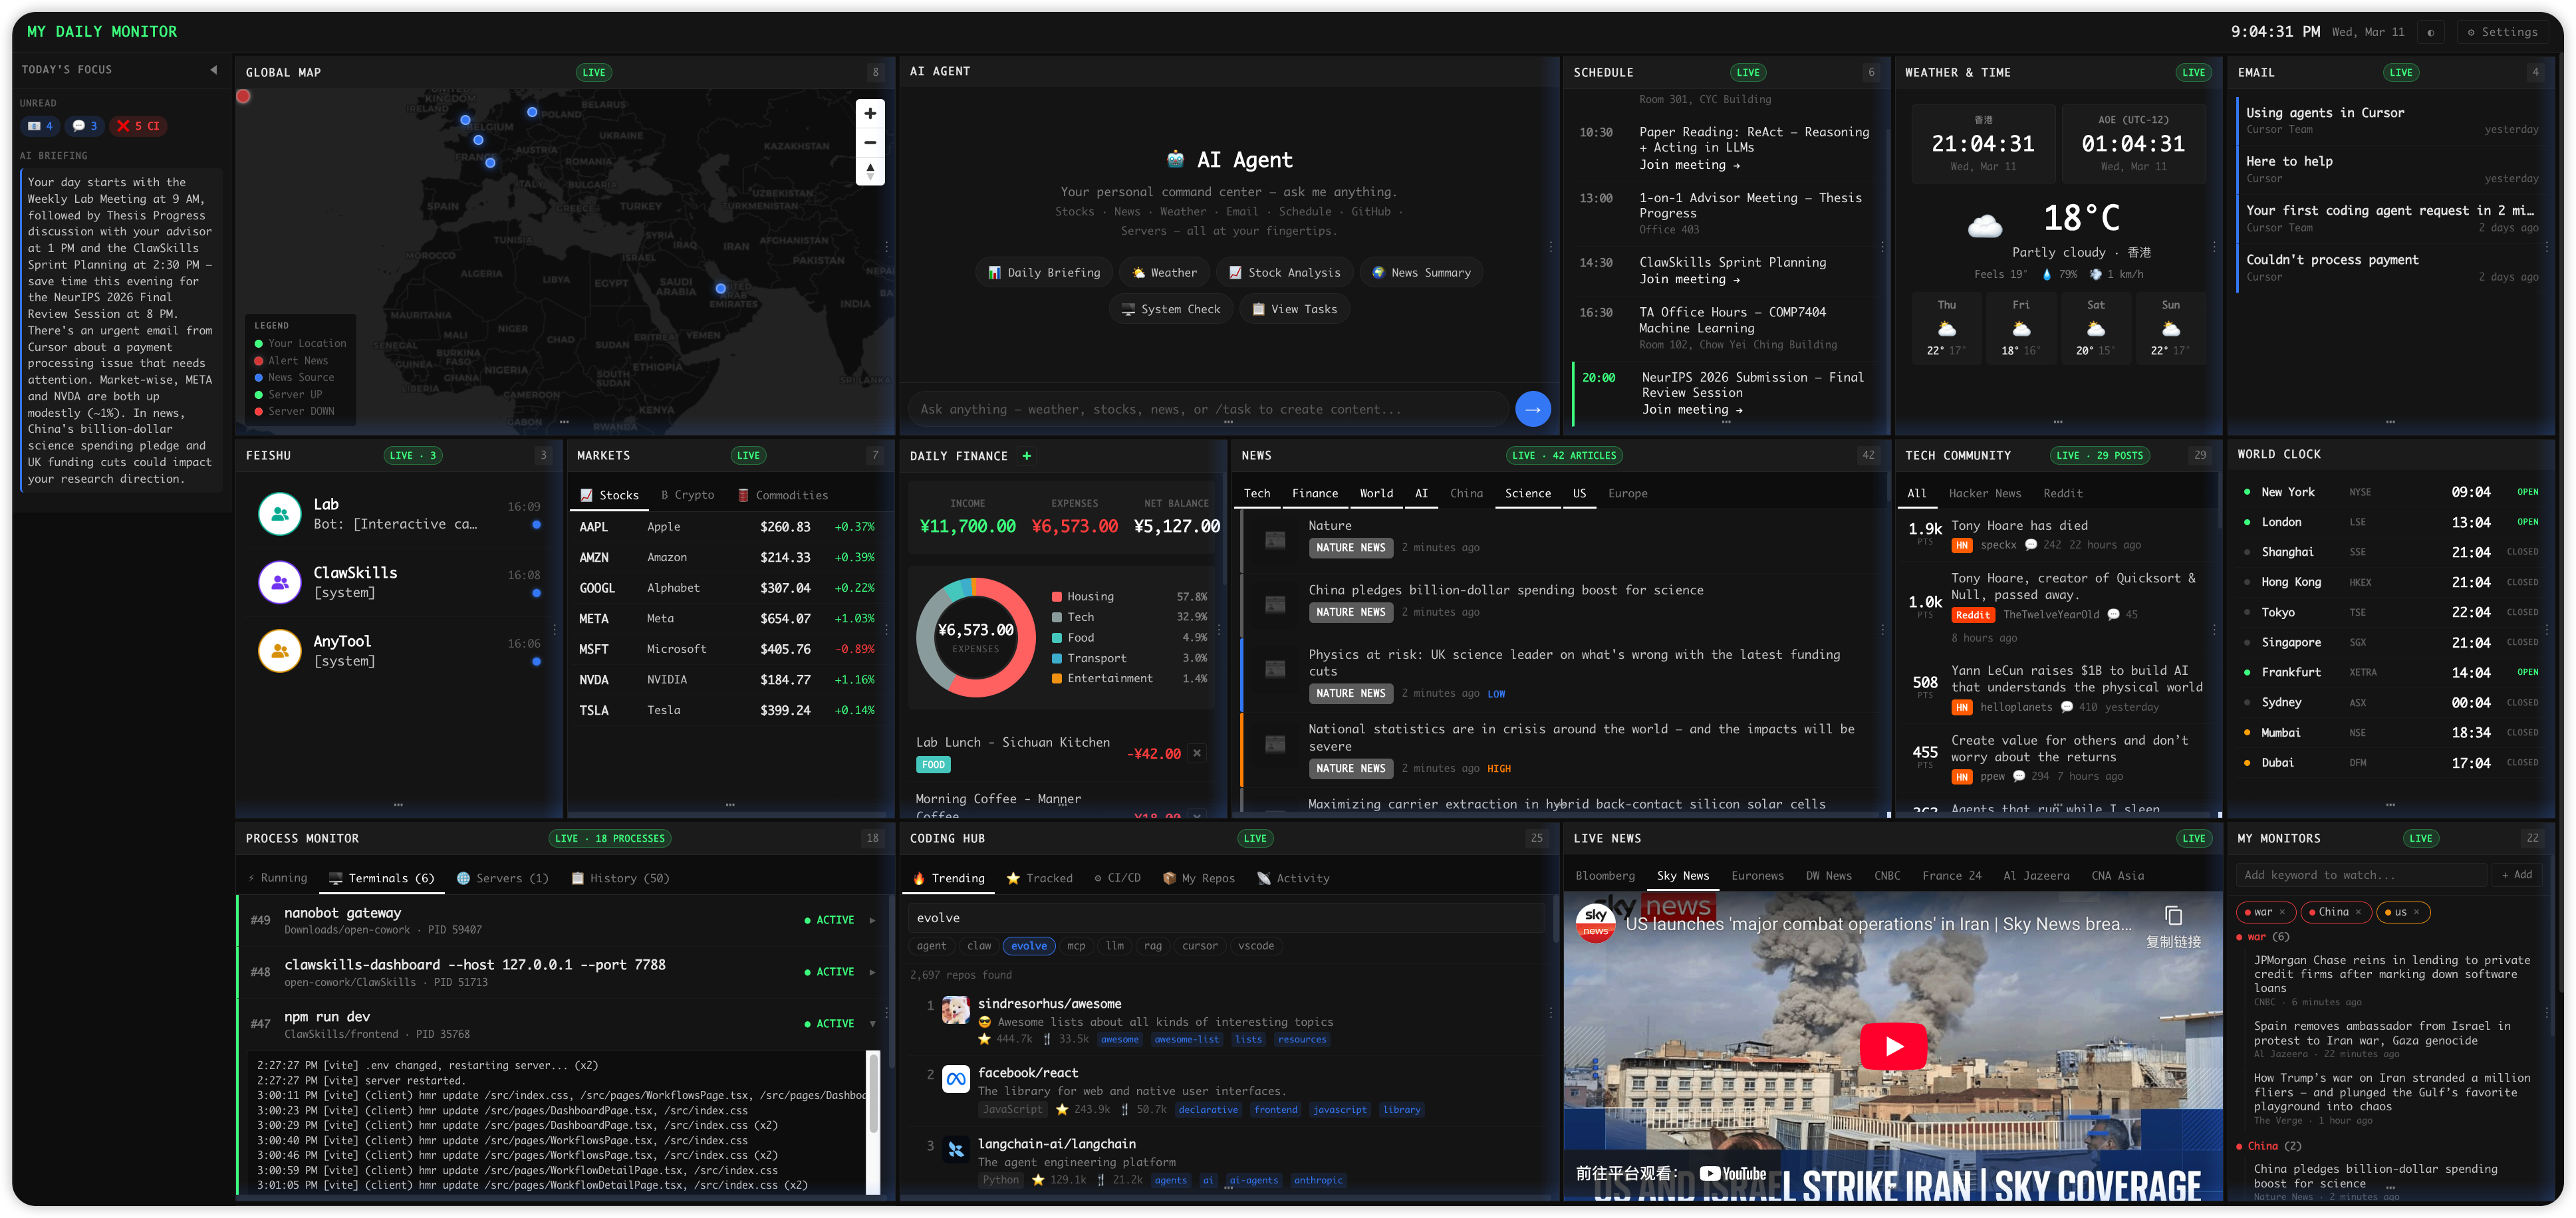
**My Daily Monitor** is an always-on **live** dashboard that streams your processes, servers, terminals, news, markets, messages, and schedules into one screen — with a built-in AI agent that can answer questions, provide analysis, and get work done for you.
### 🔑 Why It Matters
- **🖥️ Live Process & Terminal Monitor** — Dev servers, training jobs, SSH sessions, Docker containers — all visible with live CPU/memory bars, PID tracking, and terminal output tailing. Remote server URL probes for instant UP/DOWN checks. Crash/OOM detection tells you what happened without digging through logs.
- **🤖 An Expert Always by Your Side** — The AI Agent has live access to every data source on your dashboard. "Why did my build fail?" — it pulls CI logs + process history to analyze. "Summarize today's Feishu threads" — done. Need a PPT? It generates and executes Python code. Always-on, wake it anytime for answers, analysis, or real work.
- **📡 Everything Streams, Nothing Is Stale** — Stock tickers, Bloomberg live TV, world news, HN/Reddit, Gmail, Calendar, Feishu — all auto-refreshing. Breaking news triggers desktop notifications. Keyword monitors track any topic across all sources in real time.
- **📋 Today's Focus** — Sidebar with next-meeting countdown, unread badges, CI failure alerts, stock movers, and AI daily briefing — open the dashboard and know what needs attention.
- **🔧 One Screen, Zero Context Switching** — No more jumping between `htop`, terminal tabs, Gmail, stock apps, and Slack. Every panel is self-contained, auto-refreshing, and resilient.
### 📋 Panel Overview
| Category | Panels | What You See |
|----------|--------|-------------|
| 🖥️ **DevOps & System** | Process Monitor, System Health, Coding Hub | All running processes & terminals, remote server probes, CPU/MEM, GitHub CI/CD, trending repos |
| 🤖 **AI Agent** | AI Agent, Today's Focus | Chat with your data, generate content, daily briefing with aggregated alerts |
| 📊 **Markets & Finance** | Stock Market, Daily Finance | Live stock/crypto/commodity tickers, income & expense tracking |
| 📰 **Information** | News, Live News, Tech Community, My Monitors | Categorized news feeds, Bloomberg live stream, HN/Reddit, custom keyword alerts |
| 📅 **Productivity** | Schedule, Email, Feishu | Google Calendar, Gmail inbox, Feishu/Lark bot messages |
| 🌍 **Overview** | Global Map, Weather, World Clock, Quick Links | News pinned on a world map, weather forecast, multi-timezone clocks |
---
## 🚀 Quick Start
### 1. Install Dependencies
```bash
cd my-daily-monitor
npm install
```
### 2. Start the Development Server
```bash
npm run dev
```
This starts the Vite dev server with the embedded API plugin at [http://localhost:5173](http://localhost:5173). No separate backend server is needed — API routes are handled by the Vite plugin.
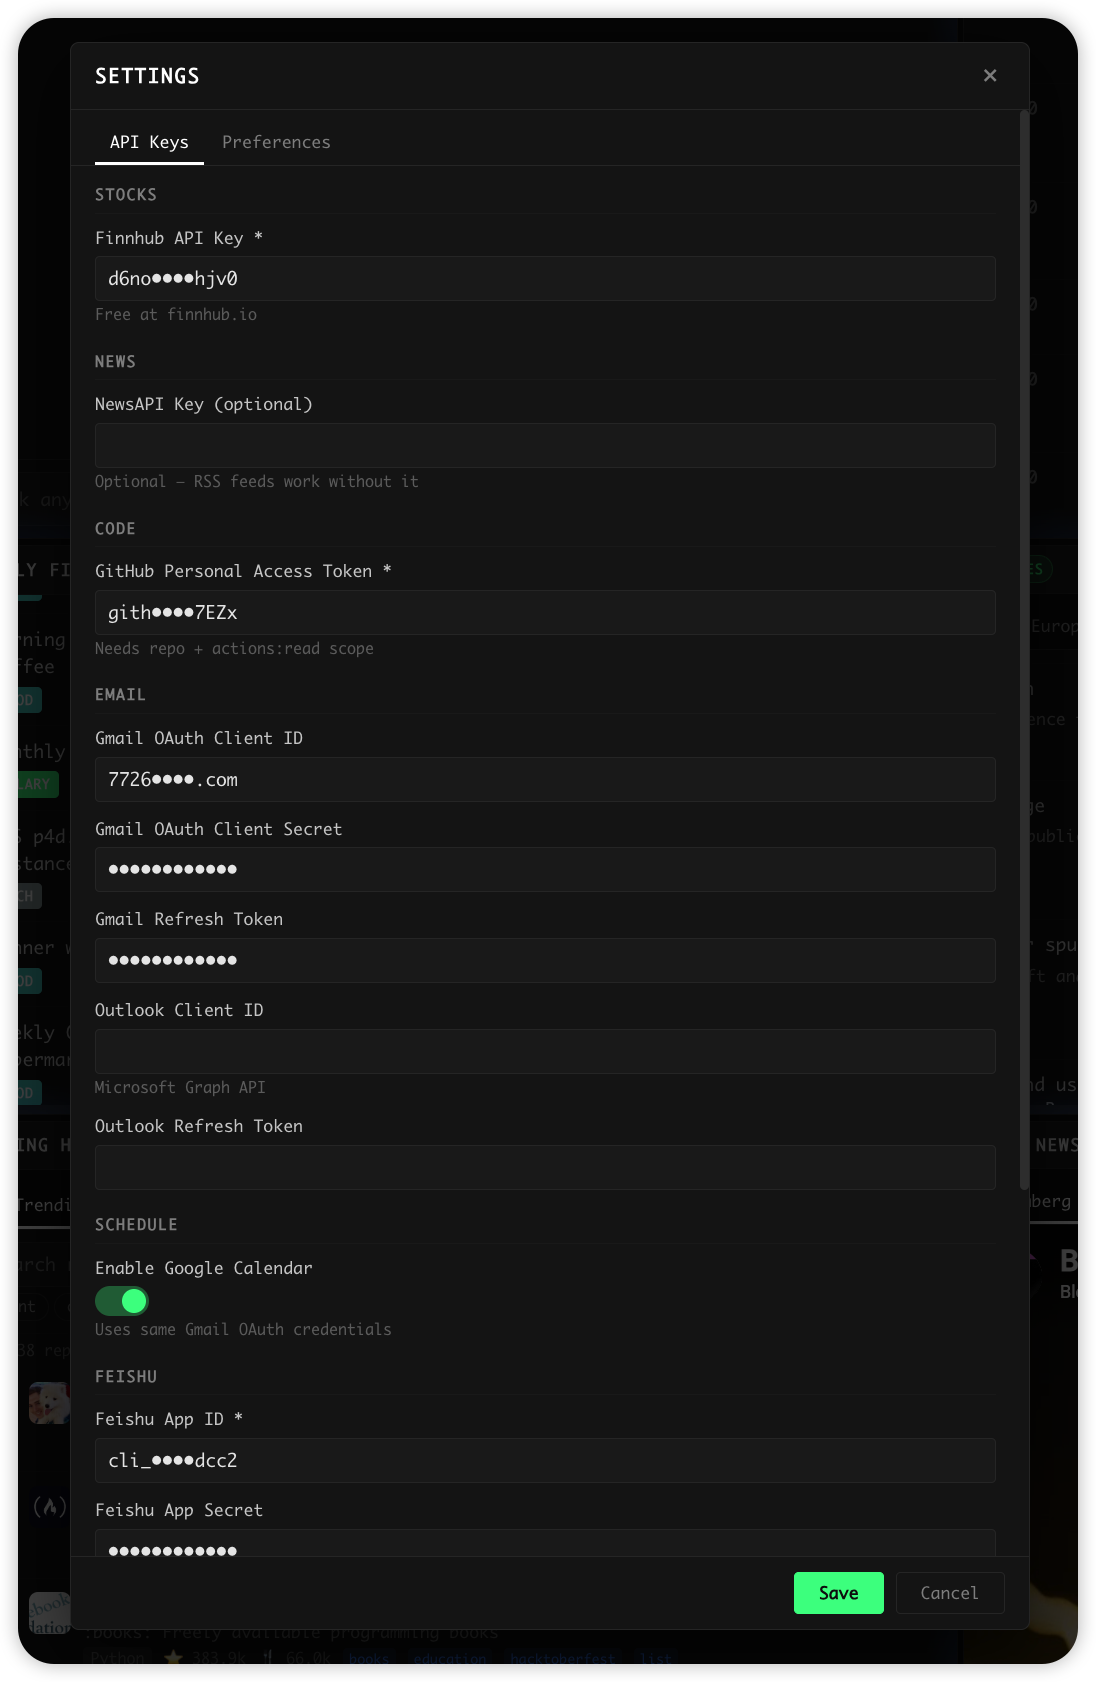
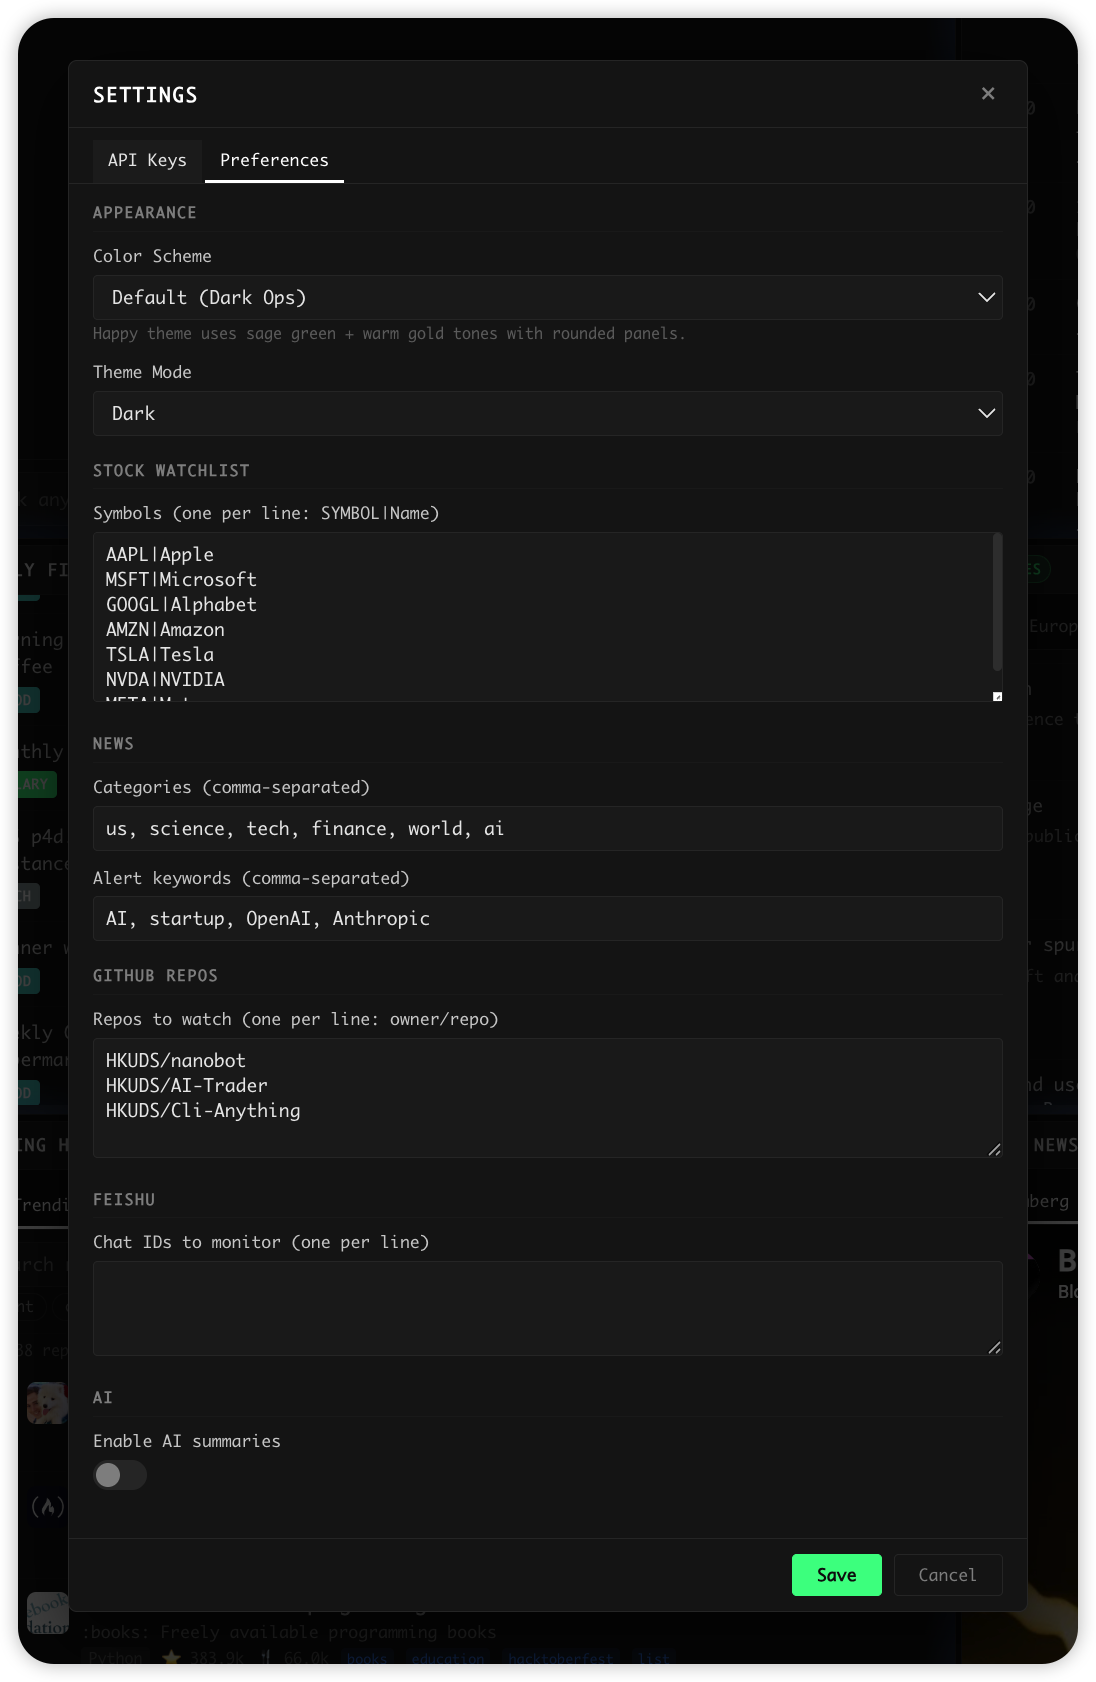
### 3. Configure
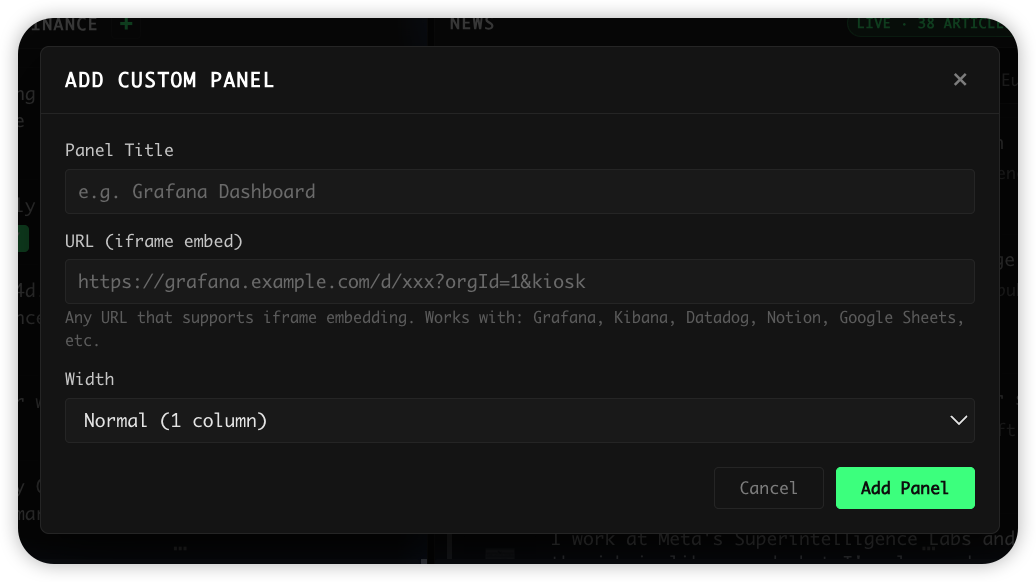
Open the dashboard and click **⚙ Settings** in the top-right corner. Add your API keys for the data sources you want to enable:
 Dark Mode