# Lets-Plot Kotlin API
A **Grammar of Graphics** for Kotlin.
[](https://confluence.jetbrains.com/display/ALL/JetBrains+on+GitHub)
[](https://raw.githubusercontent.com/JetBrains/lets-plot-kotlin/master/LICENSE)
[](https://github.com/JetBrains/lets-plot-kotlin/releases/latest)
**Lets-Plot Kotlin API** is a Kotlin API for [Lets-Plot Multiplatform](https://github.com/JetBrains/lets-plot)
plotting library, \
which is built on the principles of layered graphics first described in the \
Leland Wilkinson work [The Grammar of Graphics](https://www.goodreads.com/book/show/2549408.The_Grammar_of_Graphics).
|
Lets-Plot Kotlin API is largely based on the API provided by
ggplot2 package well-known to data scientists who use R.
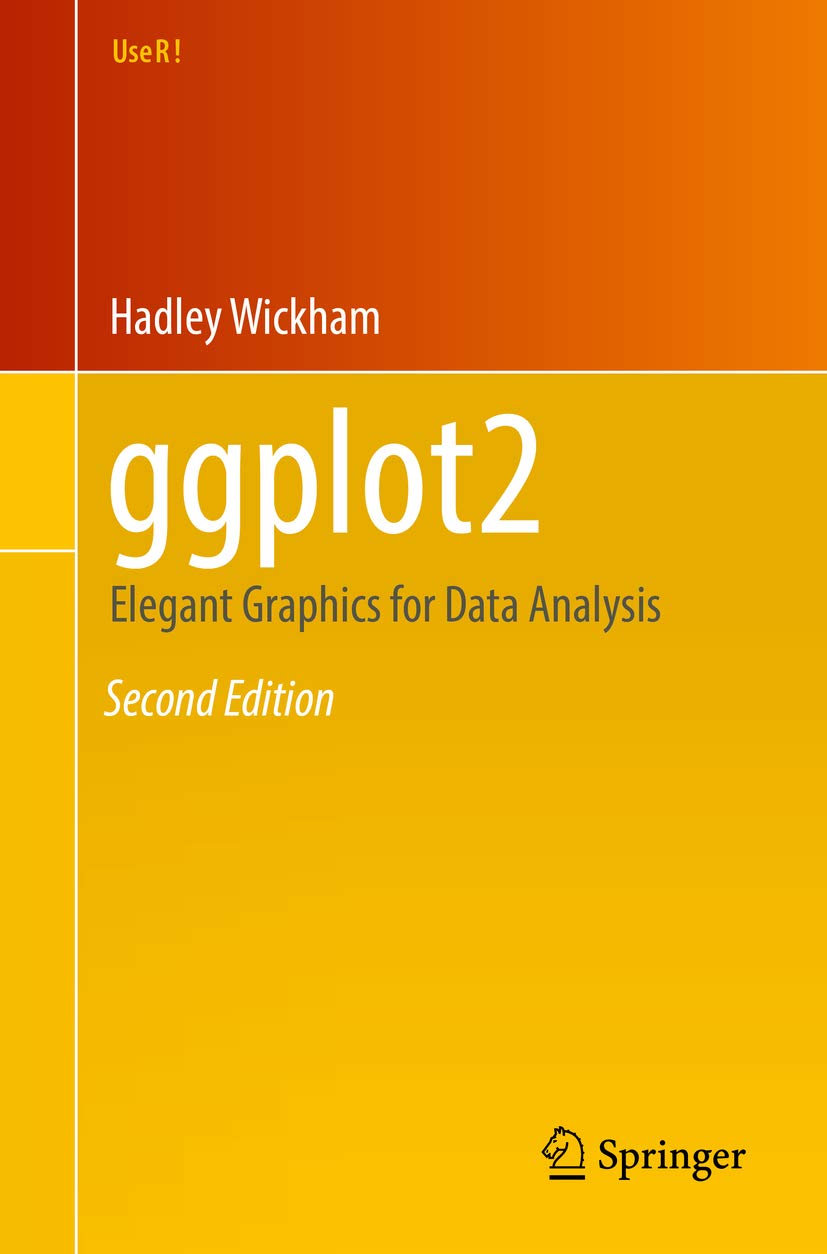
To learn more about the Grammar of Graphics, we recommend an excellent book called
“ggplot2: Elegant Graphics for Data Analysis”.
This will be a good prerequisite for further exploration of the Lets-Plot library.
|
### Quickstart
Inside [Kotlin Notebook](https://plugins.jetbrains.com/plugin/16340-kotlin-notebook),
[Datalore](https://datalore.jetbrains.com/) or
[Jupyter with Kotlin Kernel](https://github.com/Kotlin/kotlin-jupyter#readme):
```
%use lets-plot
```
```kotlin
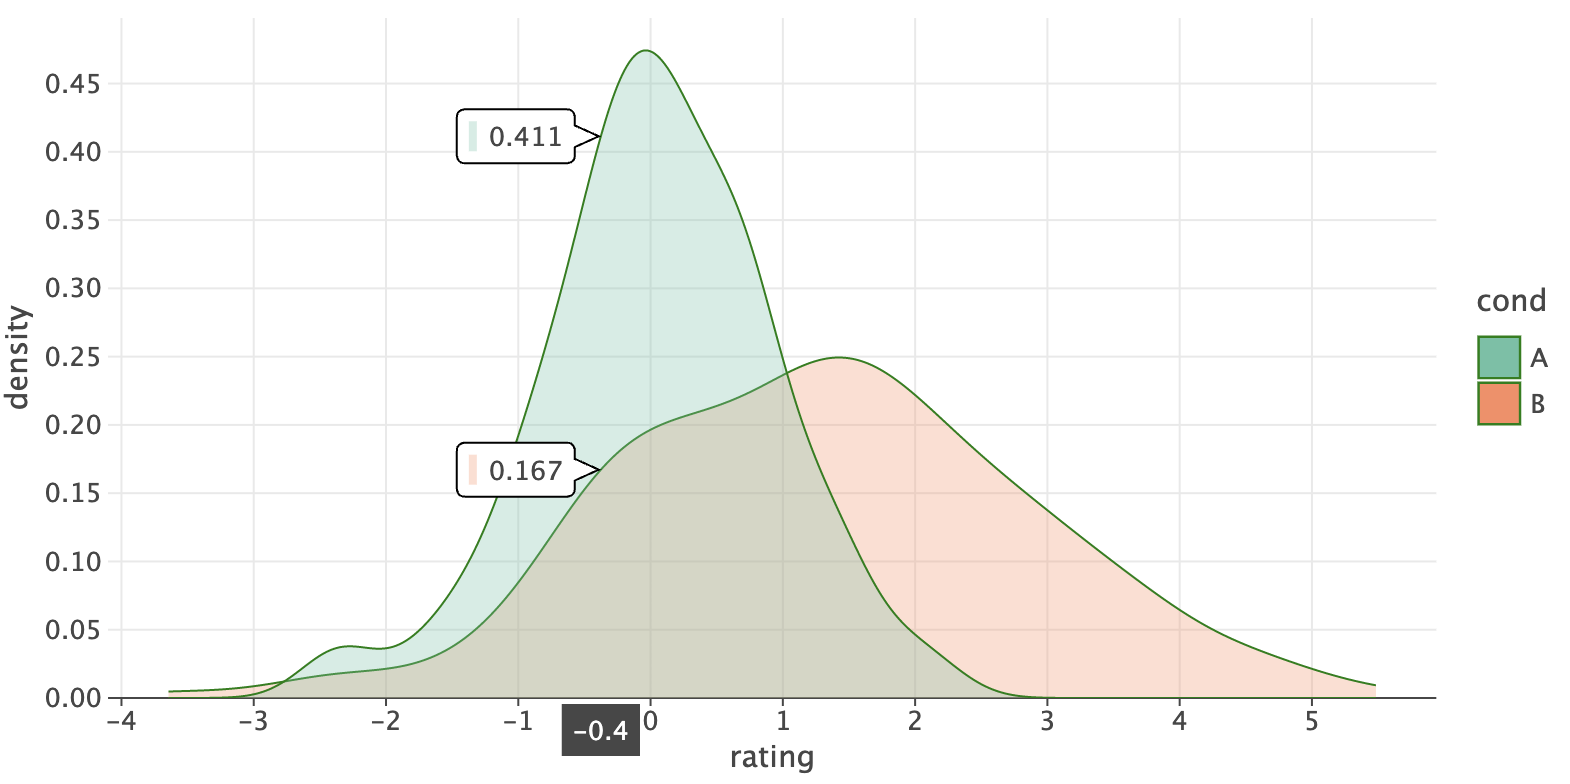
val rand = java.util.Random()
val data = mapOf(
"rating" to List(200) { rand.nextGaussian() } + List(200) { rand.nextGaussian() * 1.5 + 1.5 },
"cond" to List(200) { "A" } + List(200) { "B" }
)
var p = letsPlot(data)
p += geomDensity(color = "dark_green", alpha = .3) { x = "rating"; fill = "cond" }
p + ggsize(700, 350)
```
See the "Quickstart" notebook in [Datalore](https://datalore.jetbrains.com/view/notebook/aTA9lQnPkRwdCzT6uy95GZ) or
[Jupyter nbviewer](https://nbviewer.org/github/JetBrains/lets-plot-docs/blob/master/source/kotlin_examples/cookbook/quickstart.ipynb).
## Table of Contents
- [Usage](#usage)
- [Notebooks](#in-notebook)
- [Compose Multiplatform](#in-compose-multiplatform)
- [JVM and Kotlin/JS](#in-jvm-js)
- [Documentation](#documentation)
- [Recent Updates in the Gallery](#recent_gallery_updates)
- [Change Log](#change_log)
- [Code of Conduct](#CoC)
- [License](#license)
## Usage
### Notebooks
With the help of Lets-Plot Kotlin API you can easily create plots in [Kotlin Notebook](https://plugins.jetbrains.com/plugin/16340-kotlin-notebook),
[Datalore](https://datalore.jetbrains.com/), [Jupyter with Kotlin Kernel](https://github.com/Kotlin/kotlin-jupyter#readme) \
or any other notebook that supports `Kotlin Kernel`.
#### "Line Magics"
```
%use lets-plot
```
This "line magic" will apply **Lets-Plot library descriptor** which adds to your notebook all the boilerplate code necessary to create plots.
By default, `library descriptor` is bundled with the Kotlin Jupyter Kernel installed in your environment. \
However, you can override the default settings using:
```
%useLatestDescriptors
```
In this case the latest `library descriptor` will be pulled from the [Kotlin Jupyter Libraries](https://github.com/Kotlin/kotlin-jupyter-libraries) repository.
#### Library Descriptor Parameters
```
%use lets-plot(v=4.15.0, isolatedFrame=false, output="js, ktnb, svg")
```
- `v` - version of the Lets-Plot Kotlin API.
- `isolatedFrame` - If `false`: load JS just once per notebook (default in Jupyter).
If `true`: include Lets-Plot JS in each output (default in [Datalore](https://datalore.jetbrains.com/) notebooks).
- `output` - comma-separated list of output types to store in notebook cells (default: `"js, ktnb, svg"`). \
Available types:
- `js` - Classic Web output: HTML+JS
- `ktnb` - Kotlin Notebook Swing-based rendering
- `svg` - Static SVG output
- `png` - Static PNG output
**Note:** Static images (SVG/PNG) are hidden when `js` or `ktnb` outputs are present, and only displayed in environments where JavaScript is not executed (e.g., GitHub).
This option can be helpful when file size becomes a problem. For example, storing only static output (SVG or PNG) can significantly reduce file size when working with large datasets where plot interactivity is not a priority.
### Compose Multiplatform
To learn how to embed Lets-Plot charts in [Compose Multiplatform](https://github.com/JetBrains/compose-multiplatform) applications, please check out the [Lets-Plot Compose Frontend](https://github.com/JetBrains/lets-plot-compose) project at GitHub.
### JVM and Kotlin/JS
To learn more about creating plots in JVM or Kotlin/JS environment, please read [USAGE_JVM_JS.md](https://github.com/JetBrains/lets-plot-kotlin/blob/master/USAGE_JVM_JS.md).
#### Examples
Examples of using the Lets-Plot Kotlin API in JVM and Kotlin/JS applications are available in the [Lets-Plot Kotlin Mini Apps (Demos)](https://github.com/alshan/lets-plot-mini-apps) GitHub repository.
## Documentation
* _Lets-Plot Kotlin API_ documentation and API reference: [**Lets-Plot for Kotlin**](https://lets-plot.org/kotlin)
* A quick introduction to the _Grammar of Graphics_ and _Lets-Plot Kotlin API_: [Lets-Plot Usage Guide](https://nbviewer.jupyter.org/github/JetBrains/lets-plot-kotlin/blob/master/docs/guide/user_guide.ipynb)
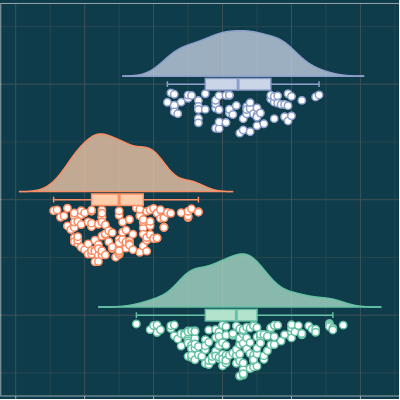
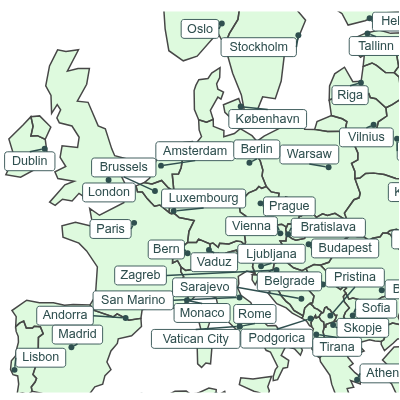
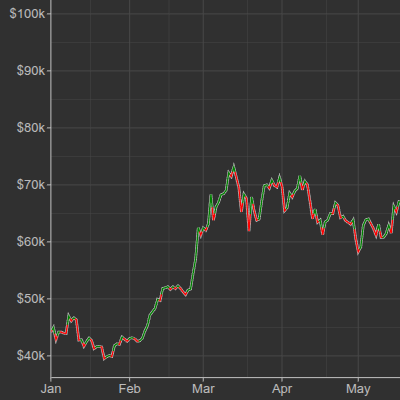
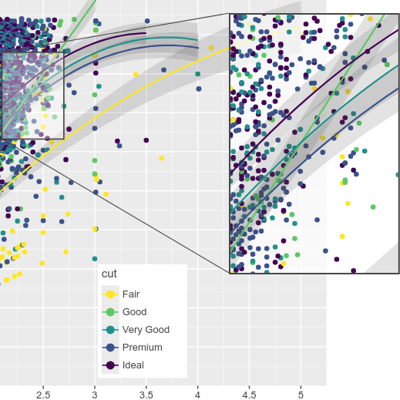
## Recent Updates in the [Gallery](https://lets-plot.org/kotlin/gallery.html)
## Change Log
See [CHANGELOG.md](https://github.com/JetBrains/lets-plot-kotlin/blob/master/CHANGELOG.md).
## Code of Conduct
This project and the corresponding community are governed by the
[JetBrains Open Source and Community Code of Conduct](https://confluence.jetbrains.com/display/ALL/JetBrains+Open+Source+and+Community+Code+of+Conduct).
Please make sure you read it.
## License
Code and documentation released under
the [MIT license](https://github.com/JetBrains/lets-plot-kotlin/blob/master/LICENSE).
Copyright © 2019-2025, JetBrains s.r.o.