 [English](./README.md) | [简体中文](./README.zh-CN.md) | 日本語
# graphic-walker



[](https://twitter.com/kanaries_data)
[](https://discord.gg/WWHraZ8SeV)
[](https://www.youtube.com/@kanaries_data)
[](https://medium.com/@observedobserver)
[](https://www.linkedin.com/company/kanaries-data/)
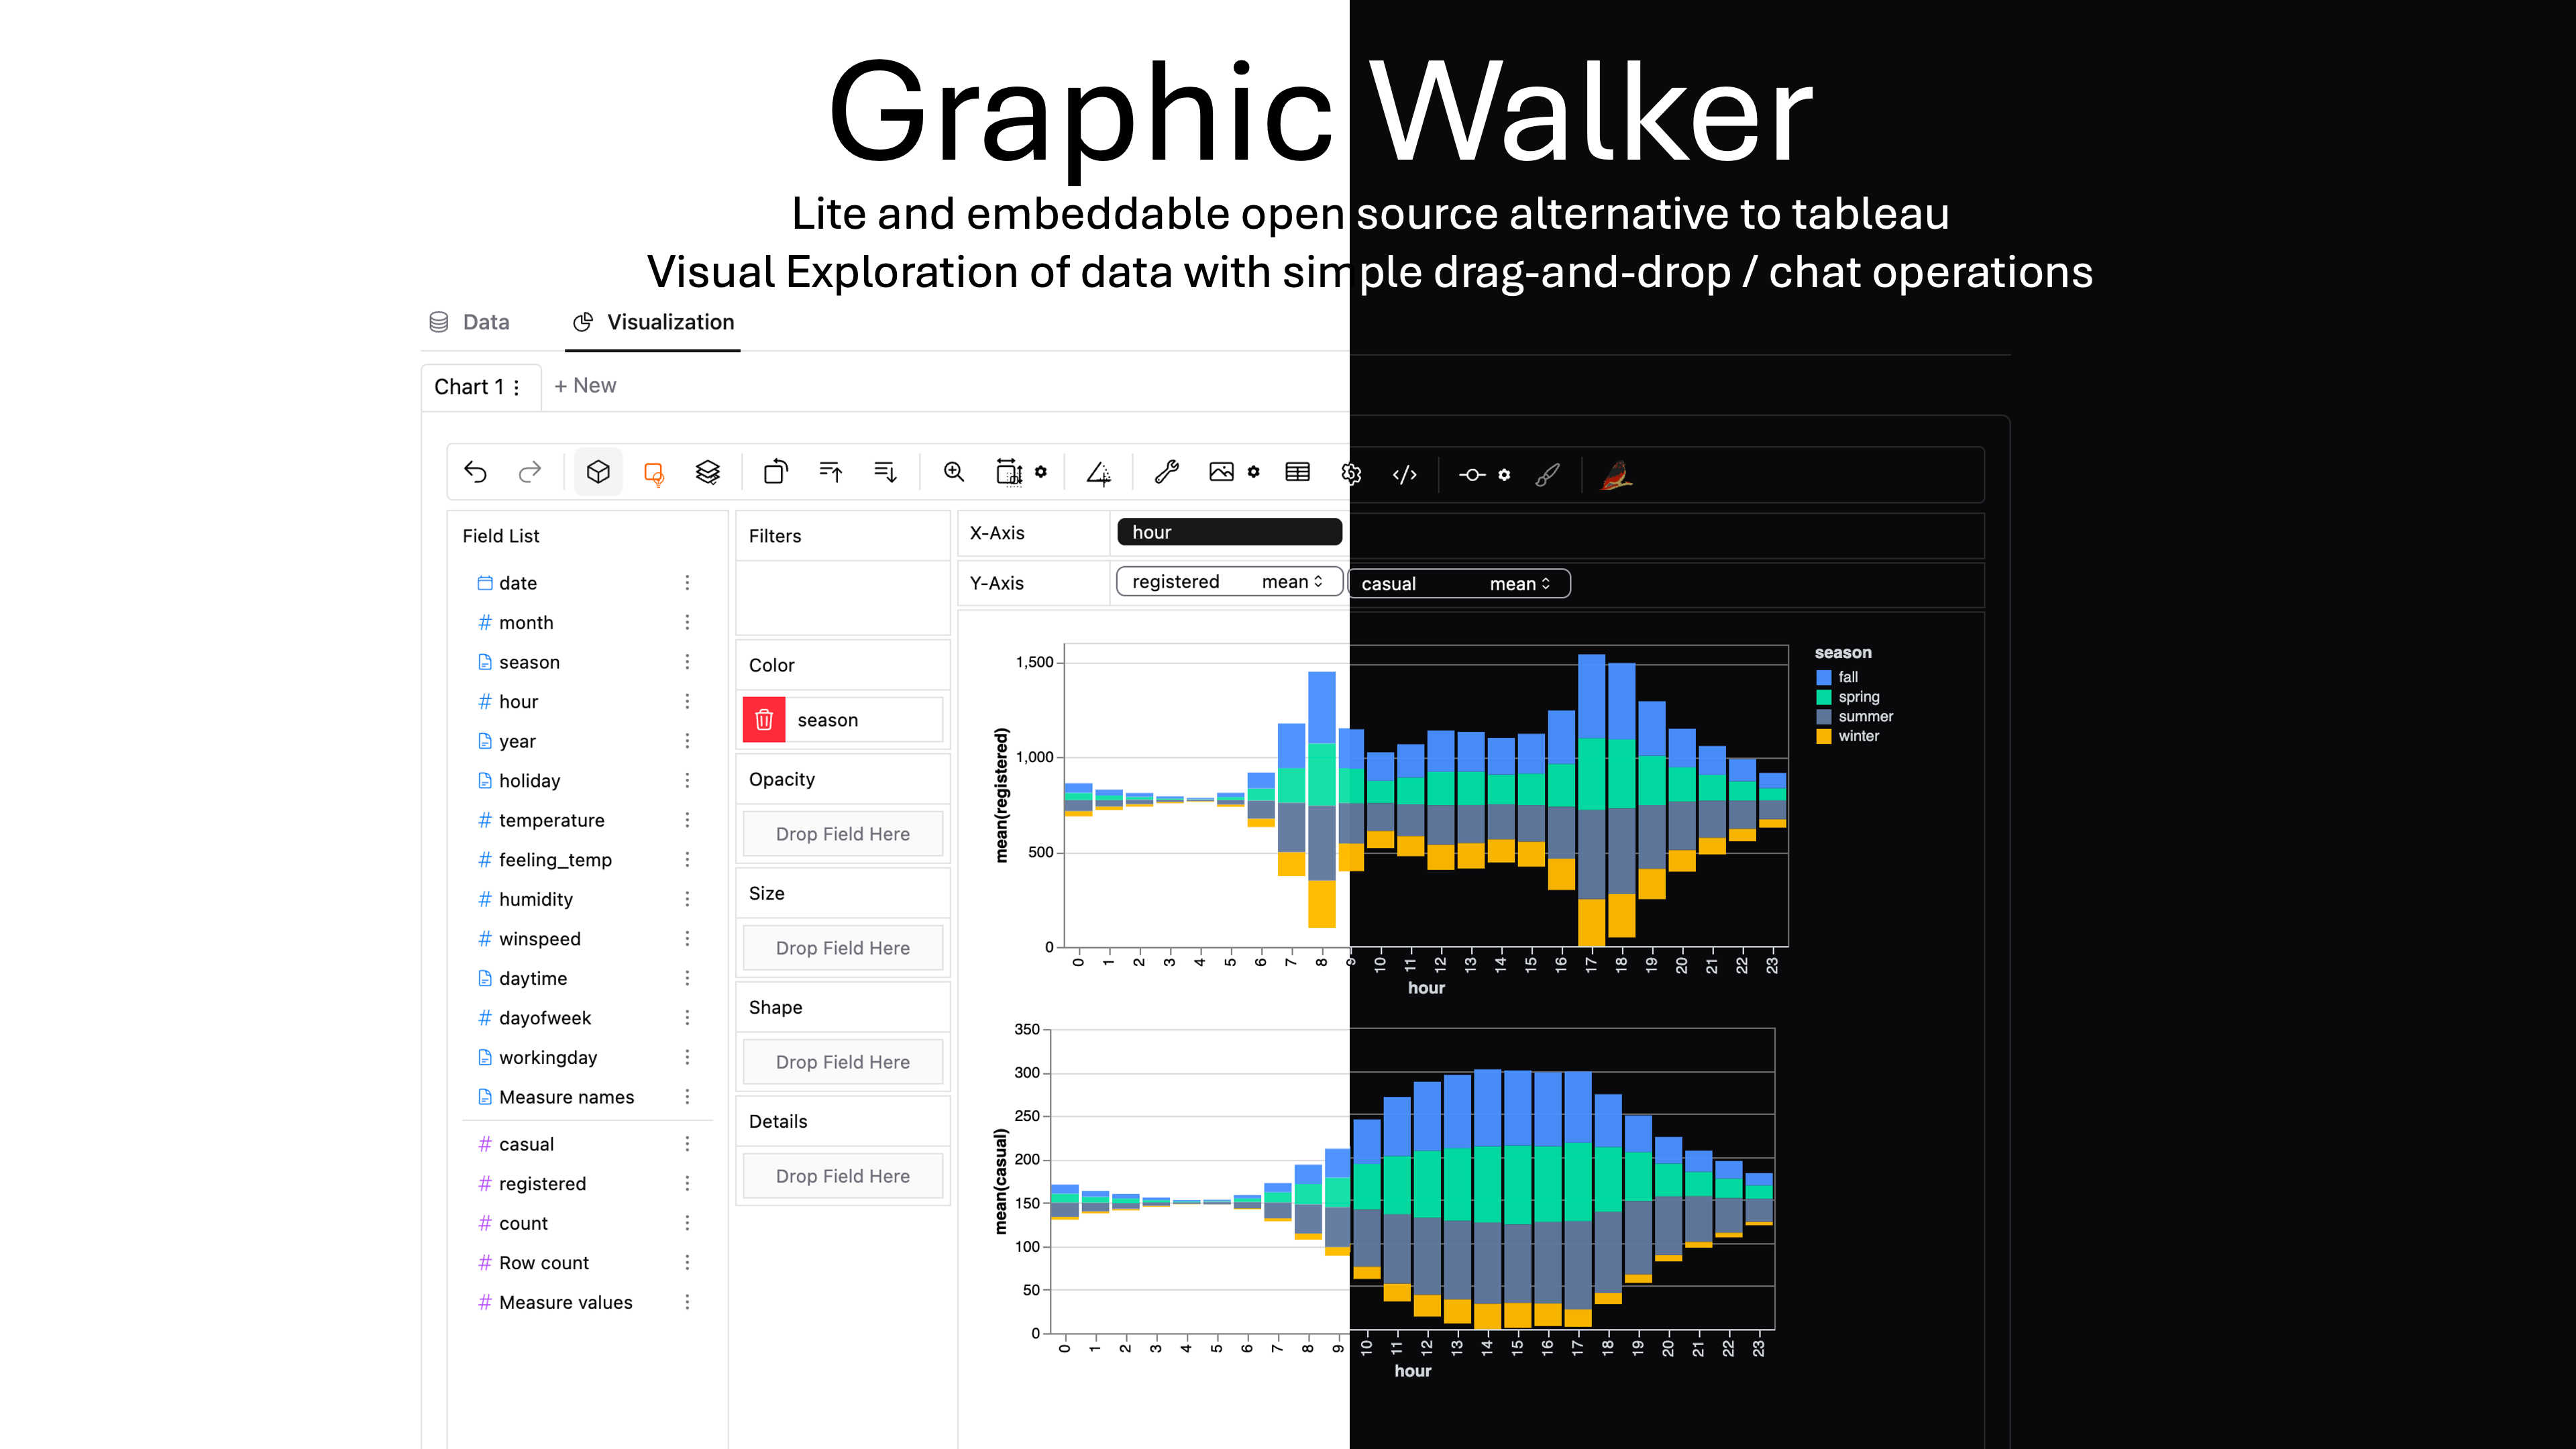
Graphic Walker は Tableau と異なる形で仕組みされて、Tableau のオープンソースの代用品です。簡単なドラッグ・アンド・ドロップ操作でデータ分析と可視化を実現します。データサイエンティストの分析需要を支援する機能を備えています。
#### Tableau との違い
Graphic Walker は React コンポーネントの形で、プラグインとして Web アプリに簡単に埋め込めます。Tableau と違って、Graphic Walker は豊かな機能でできているのではなく、基本の機能を簡単に使用できるようにデザインされている軽量なツールです。Graphic Walker を React アプリに埋め込むことは非常に簡単です !
#### 主な機能
+ 使いやすいインタラクション。簡単な手順でデータの分析と可視化を完成できます。
+ Grammar of graphics に基づく [vega-lite](https://vega.github.io/vega-lite/) で実現する可視化。
+ データの中のパターンと期待はずれの値になったマークを解釈する情報の生成。
+ WebWorker の使用によって純粋なフロントエンドとして埋め込める高い拡張性。
> Graphic Walker は軽量なコンポーネントです。もしより多くの機能がお望みなら、同じくわたしたちのチームで開発した [RATH](https://github.com/Kanaries/Rath) という拡張分析エンジンを使い、自動的なパターン発見、洞察探索、因果分析など多様な機能が備えるツールをご覧ください。
## 手順
最初は、分析したいデータを CSV ファイルとして導入します。データを確認する際に、各列どれがディメンションか、どれがメジャーかを決めます。
> 導入できるデータソースの種類を増やす予定がありますので、追加をご希望する方は気軽に私たちに連絡または issue で教えてください。開発者には、直接にデータを props として Graphic Walker に入力することができます。[Rath](https://github.com/Kanaries/Rath) はその方法で、多くのデータソースをサポートします。また、[Rath](https://github.com/Kanaries/Rath) でデータを導入してセーブするファイルを Graphic Walker に取り込むこともできます。Graphic Walker で導入できないデータを [Rath](https://github.com/Kanaries/Rath) で処理したり、変換したりしてから Graphic Walker で分析する選択肢もあります。
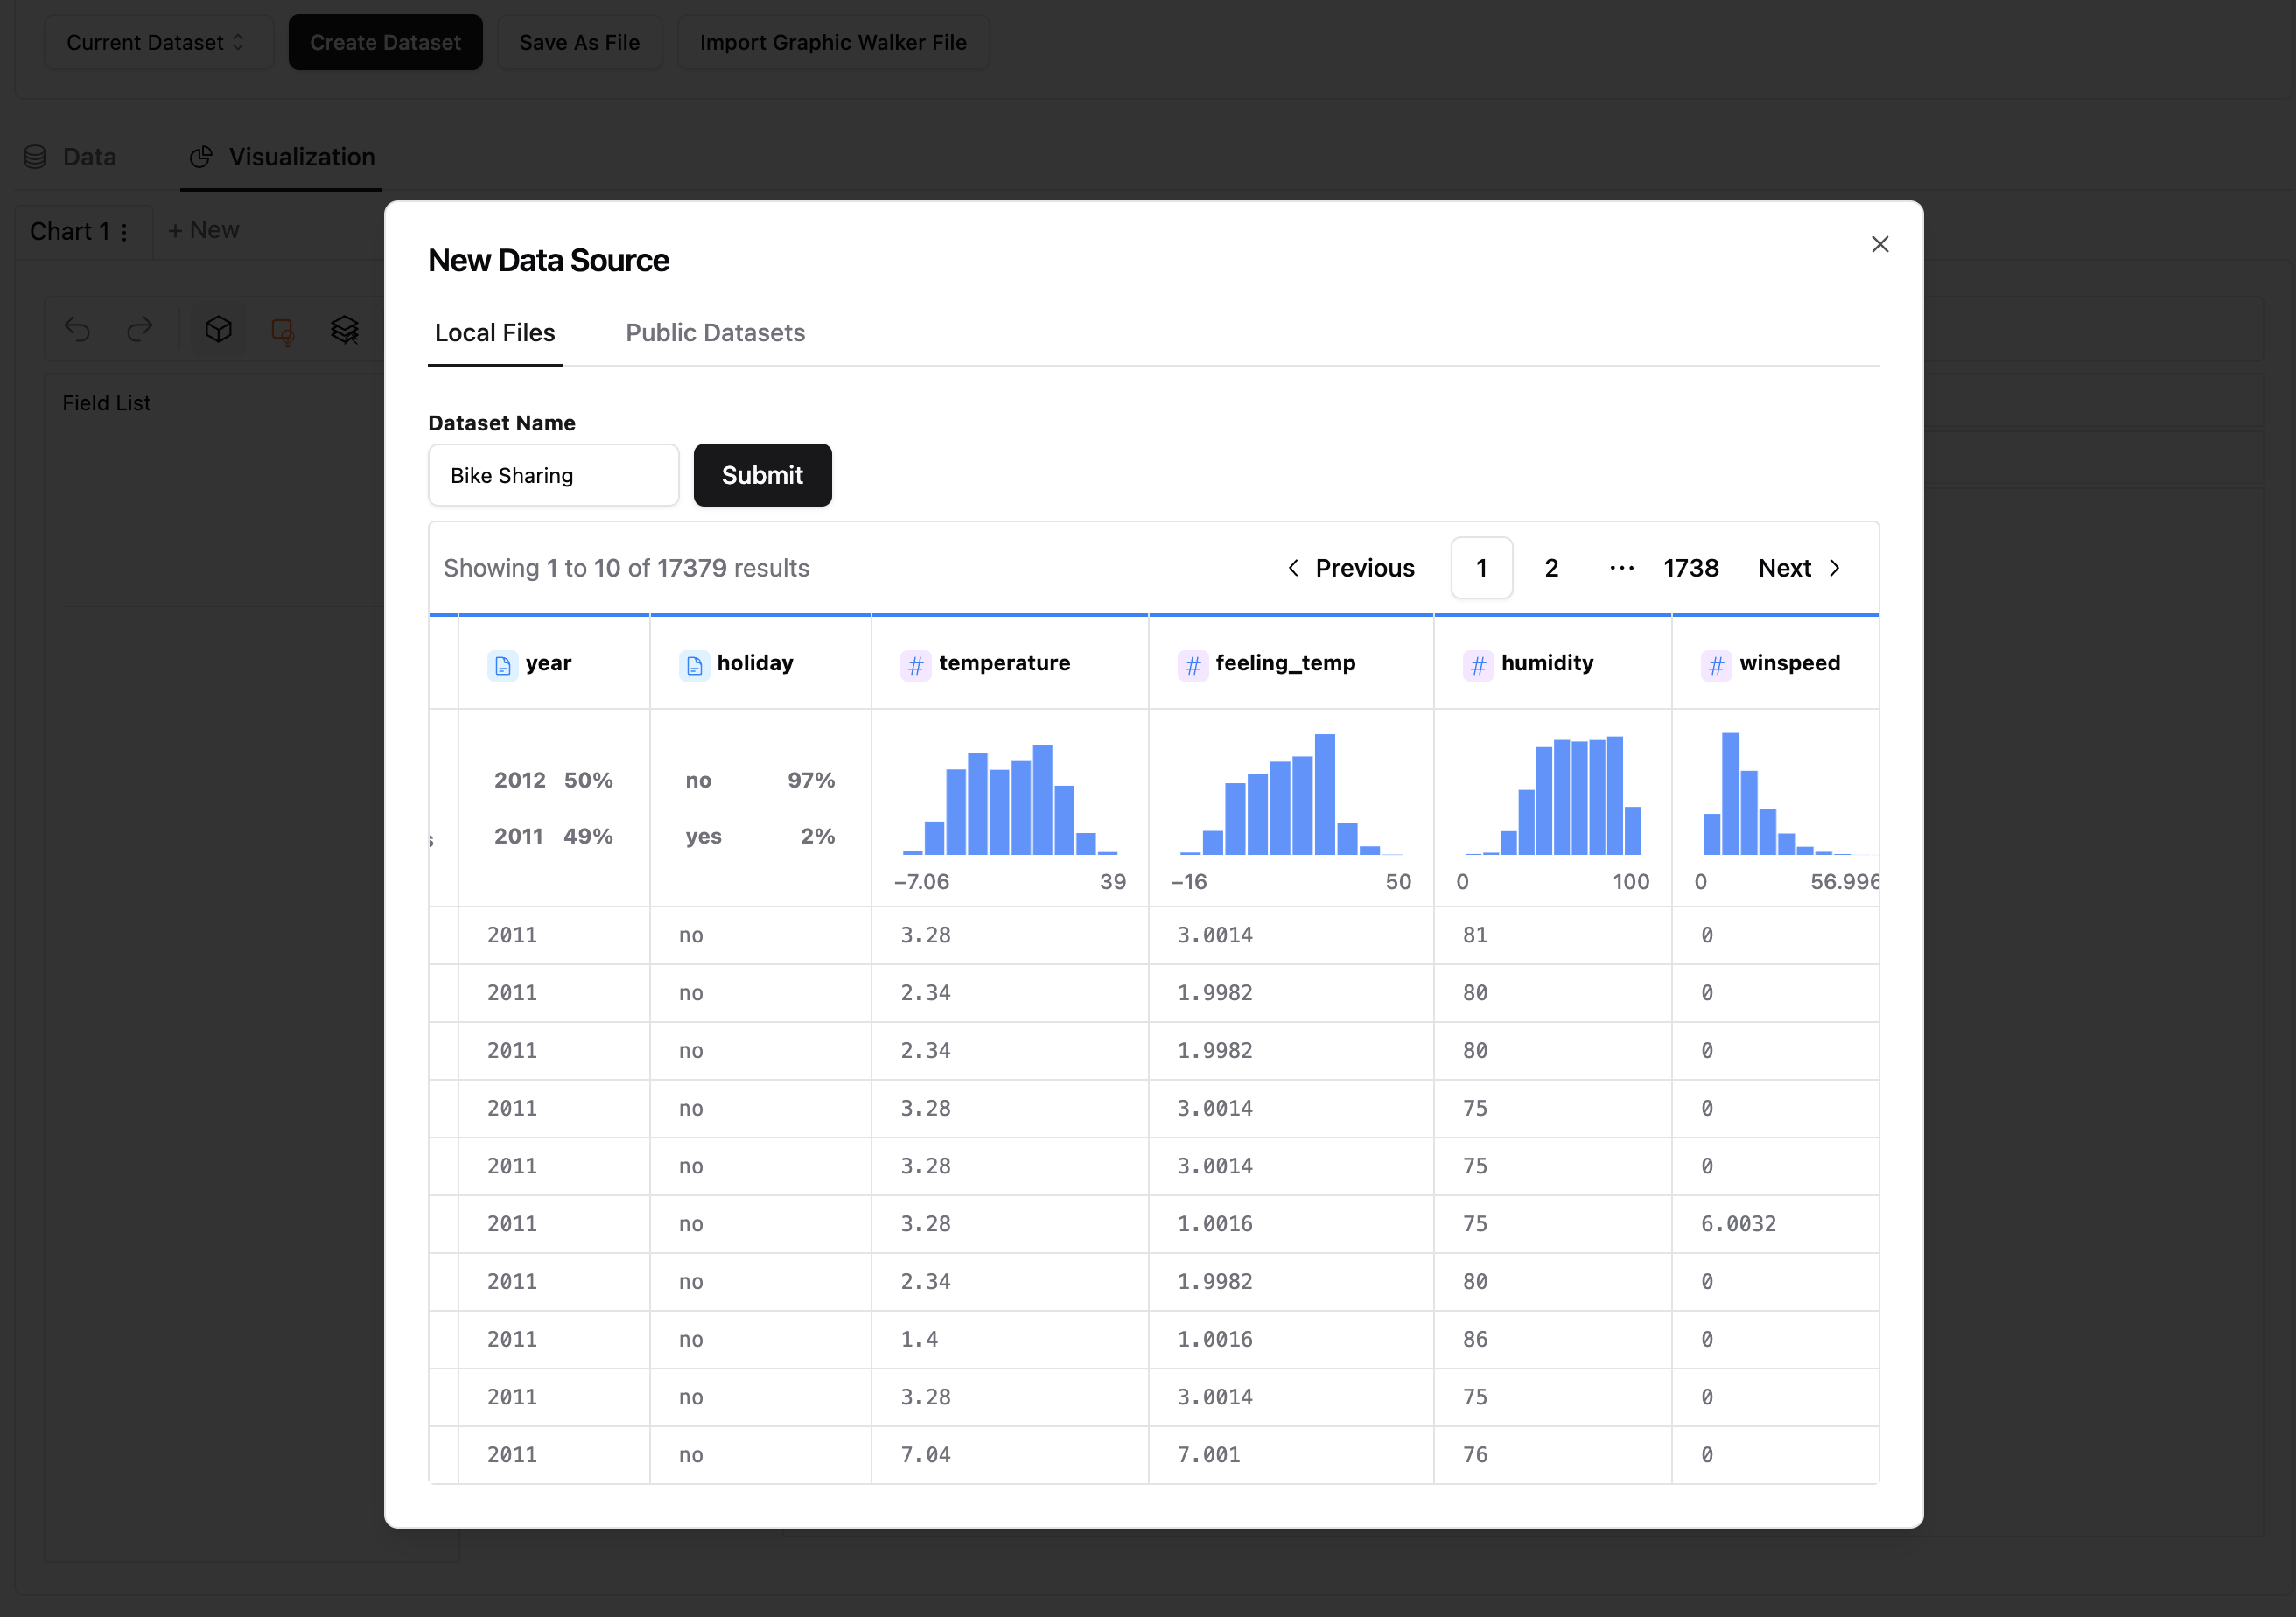
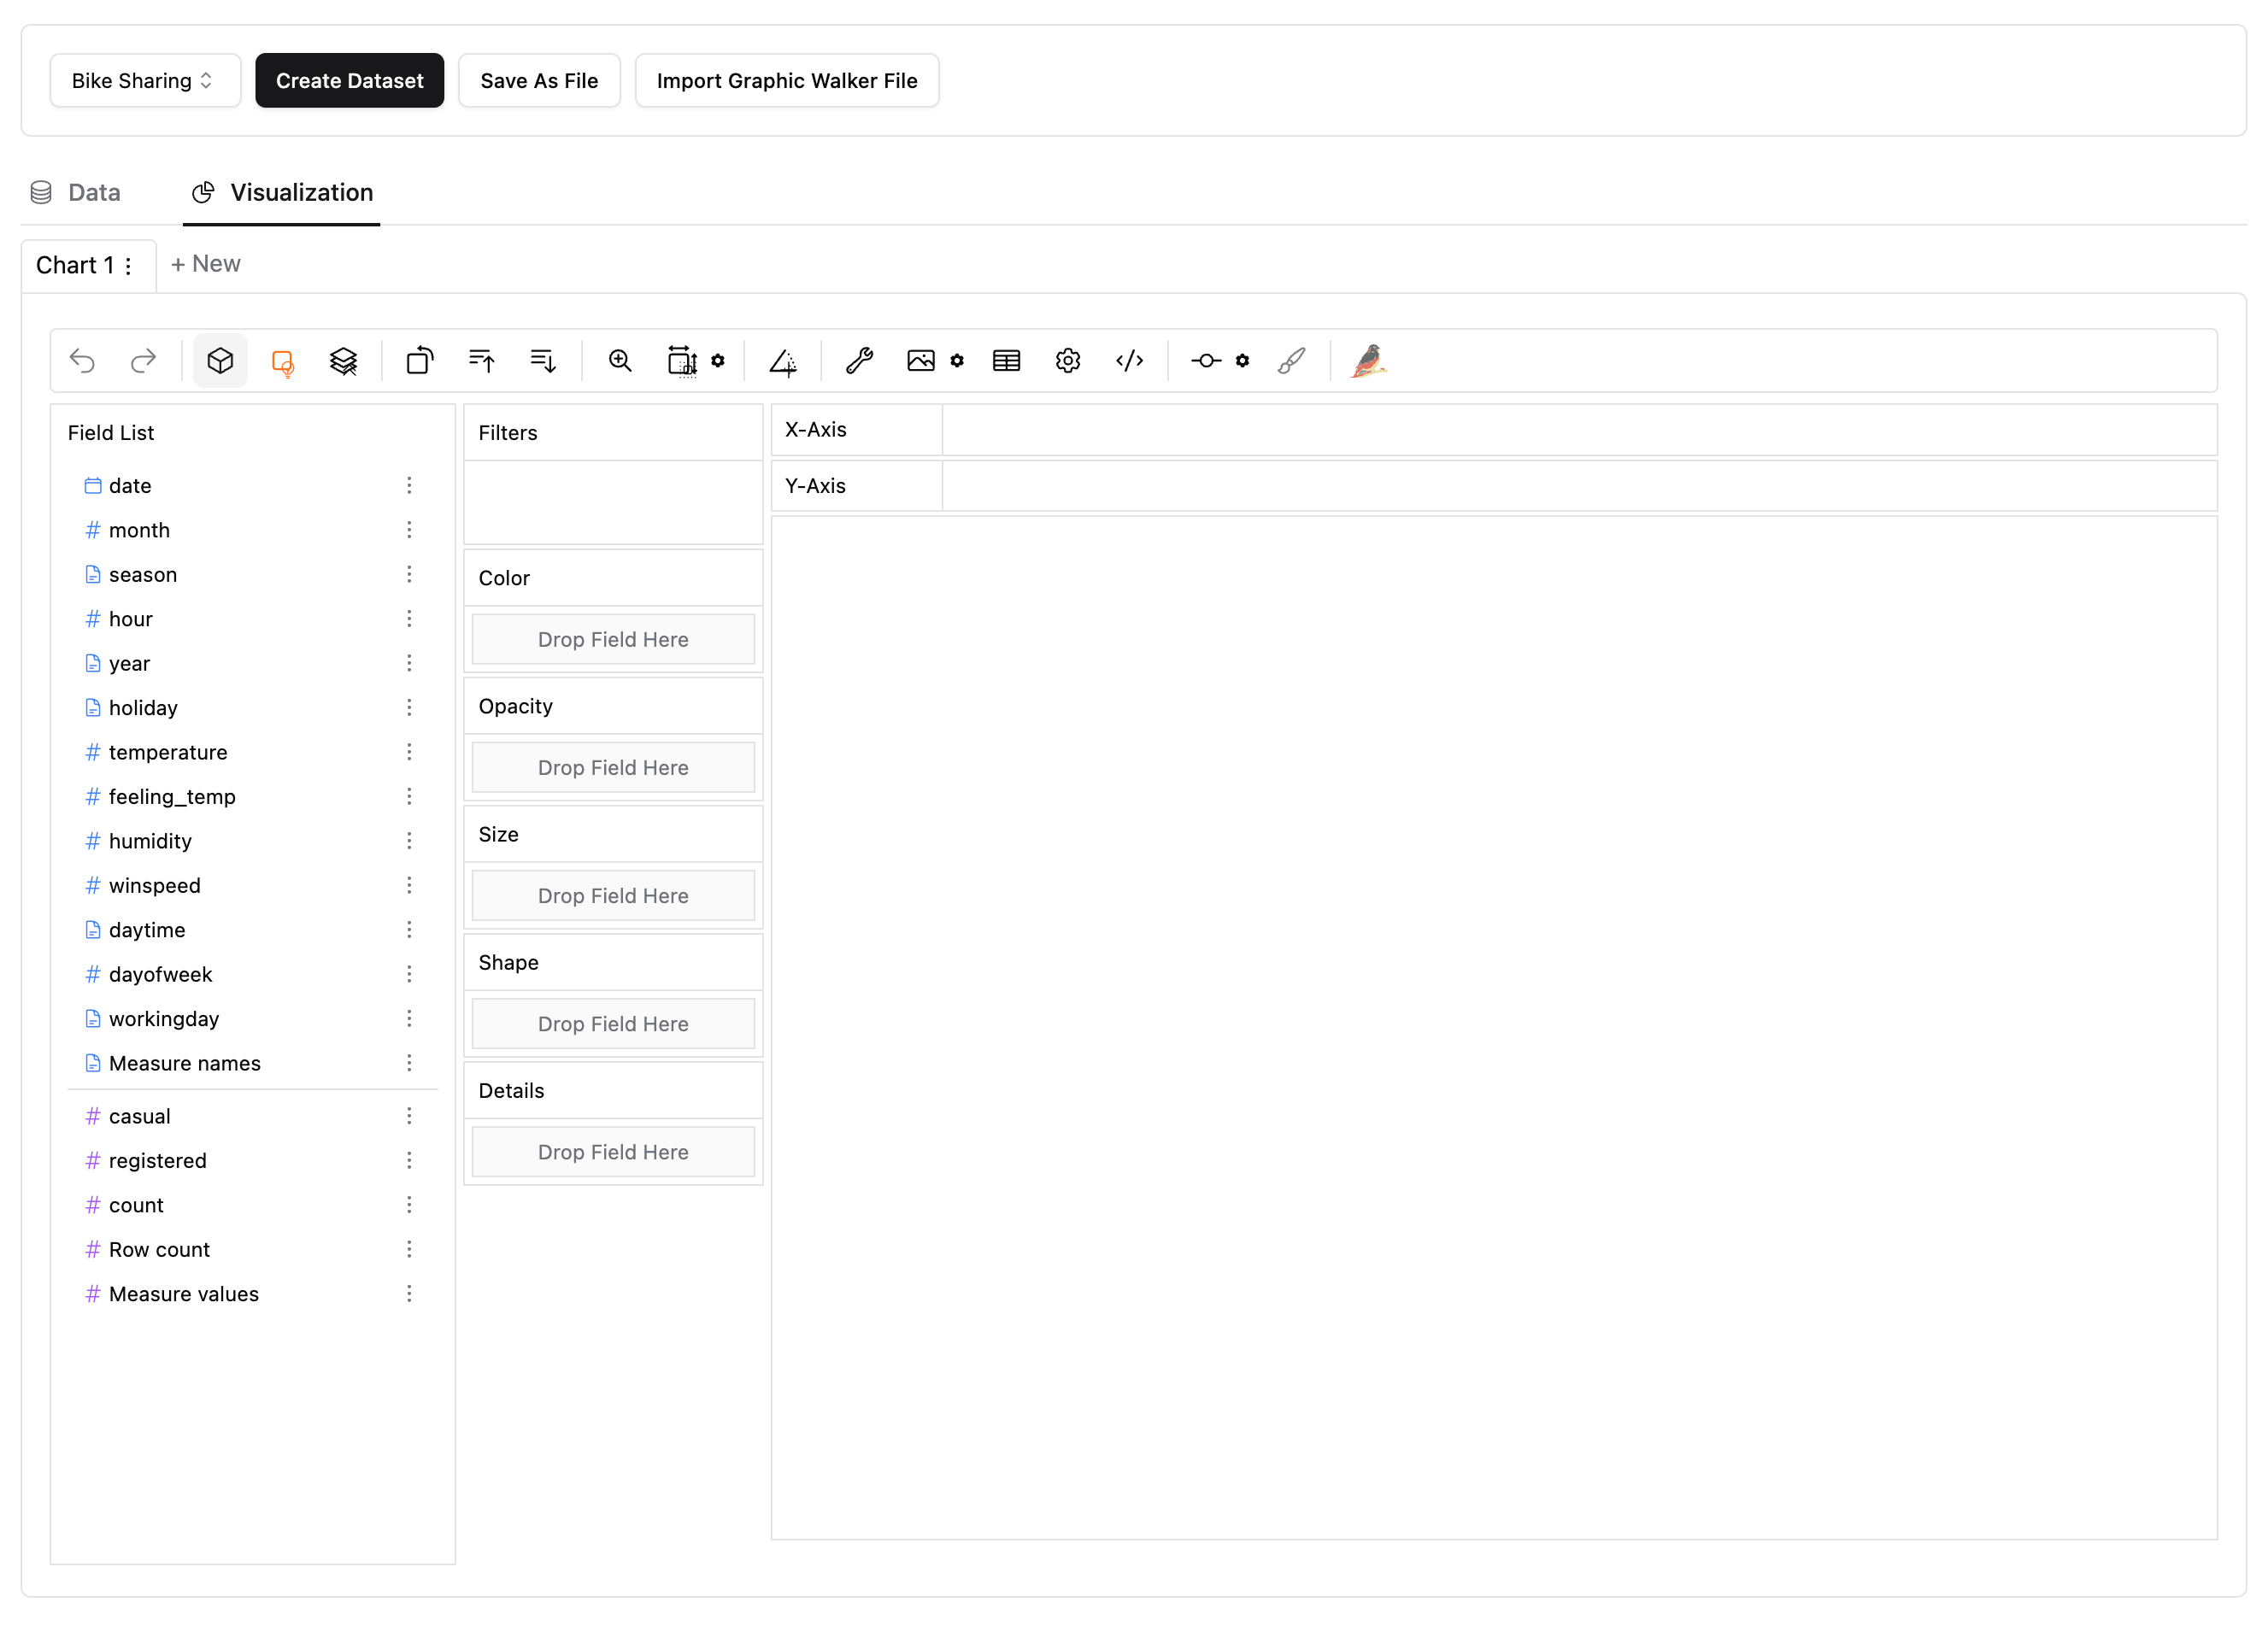
確認が完了したら、『Submit』をクリックしましょう。データの各ディメンションとメジャーは左のリストに表示されます。それらをその右側のスペース(行、列、色、不透明度など)にドロップしたら、可視化が生成します。
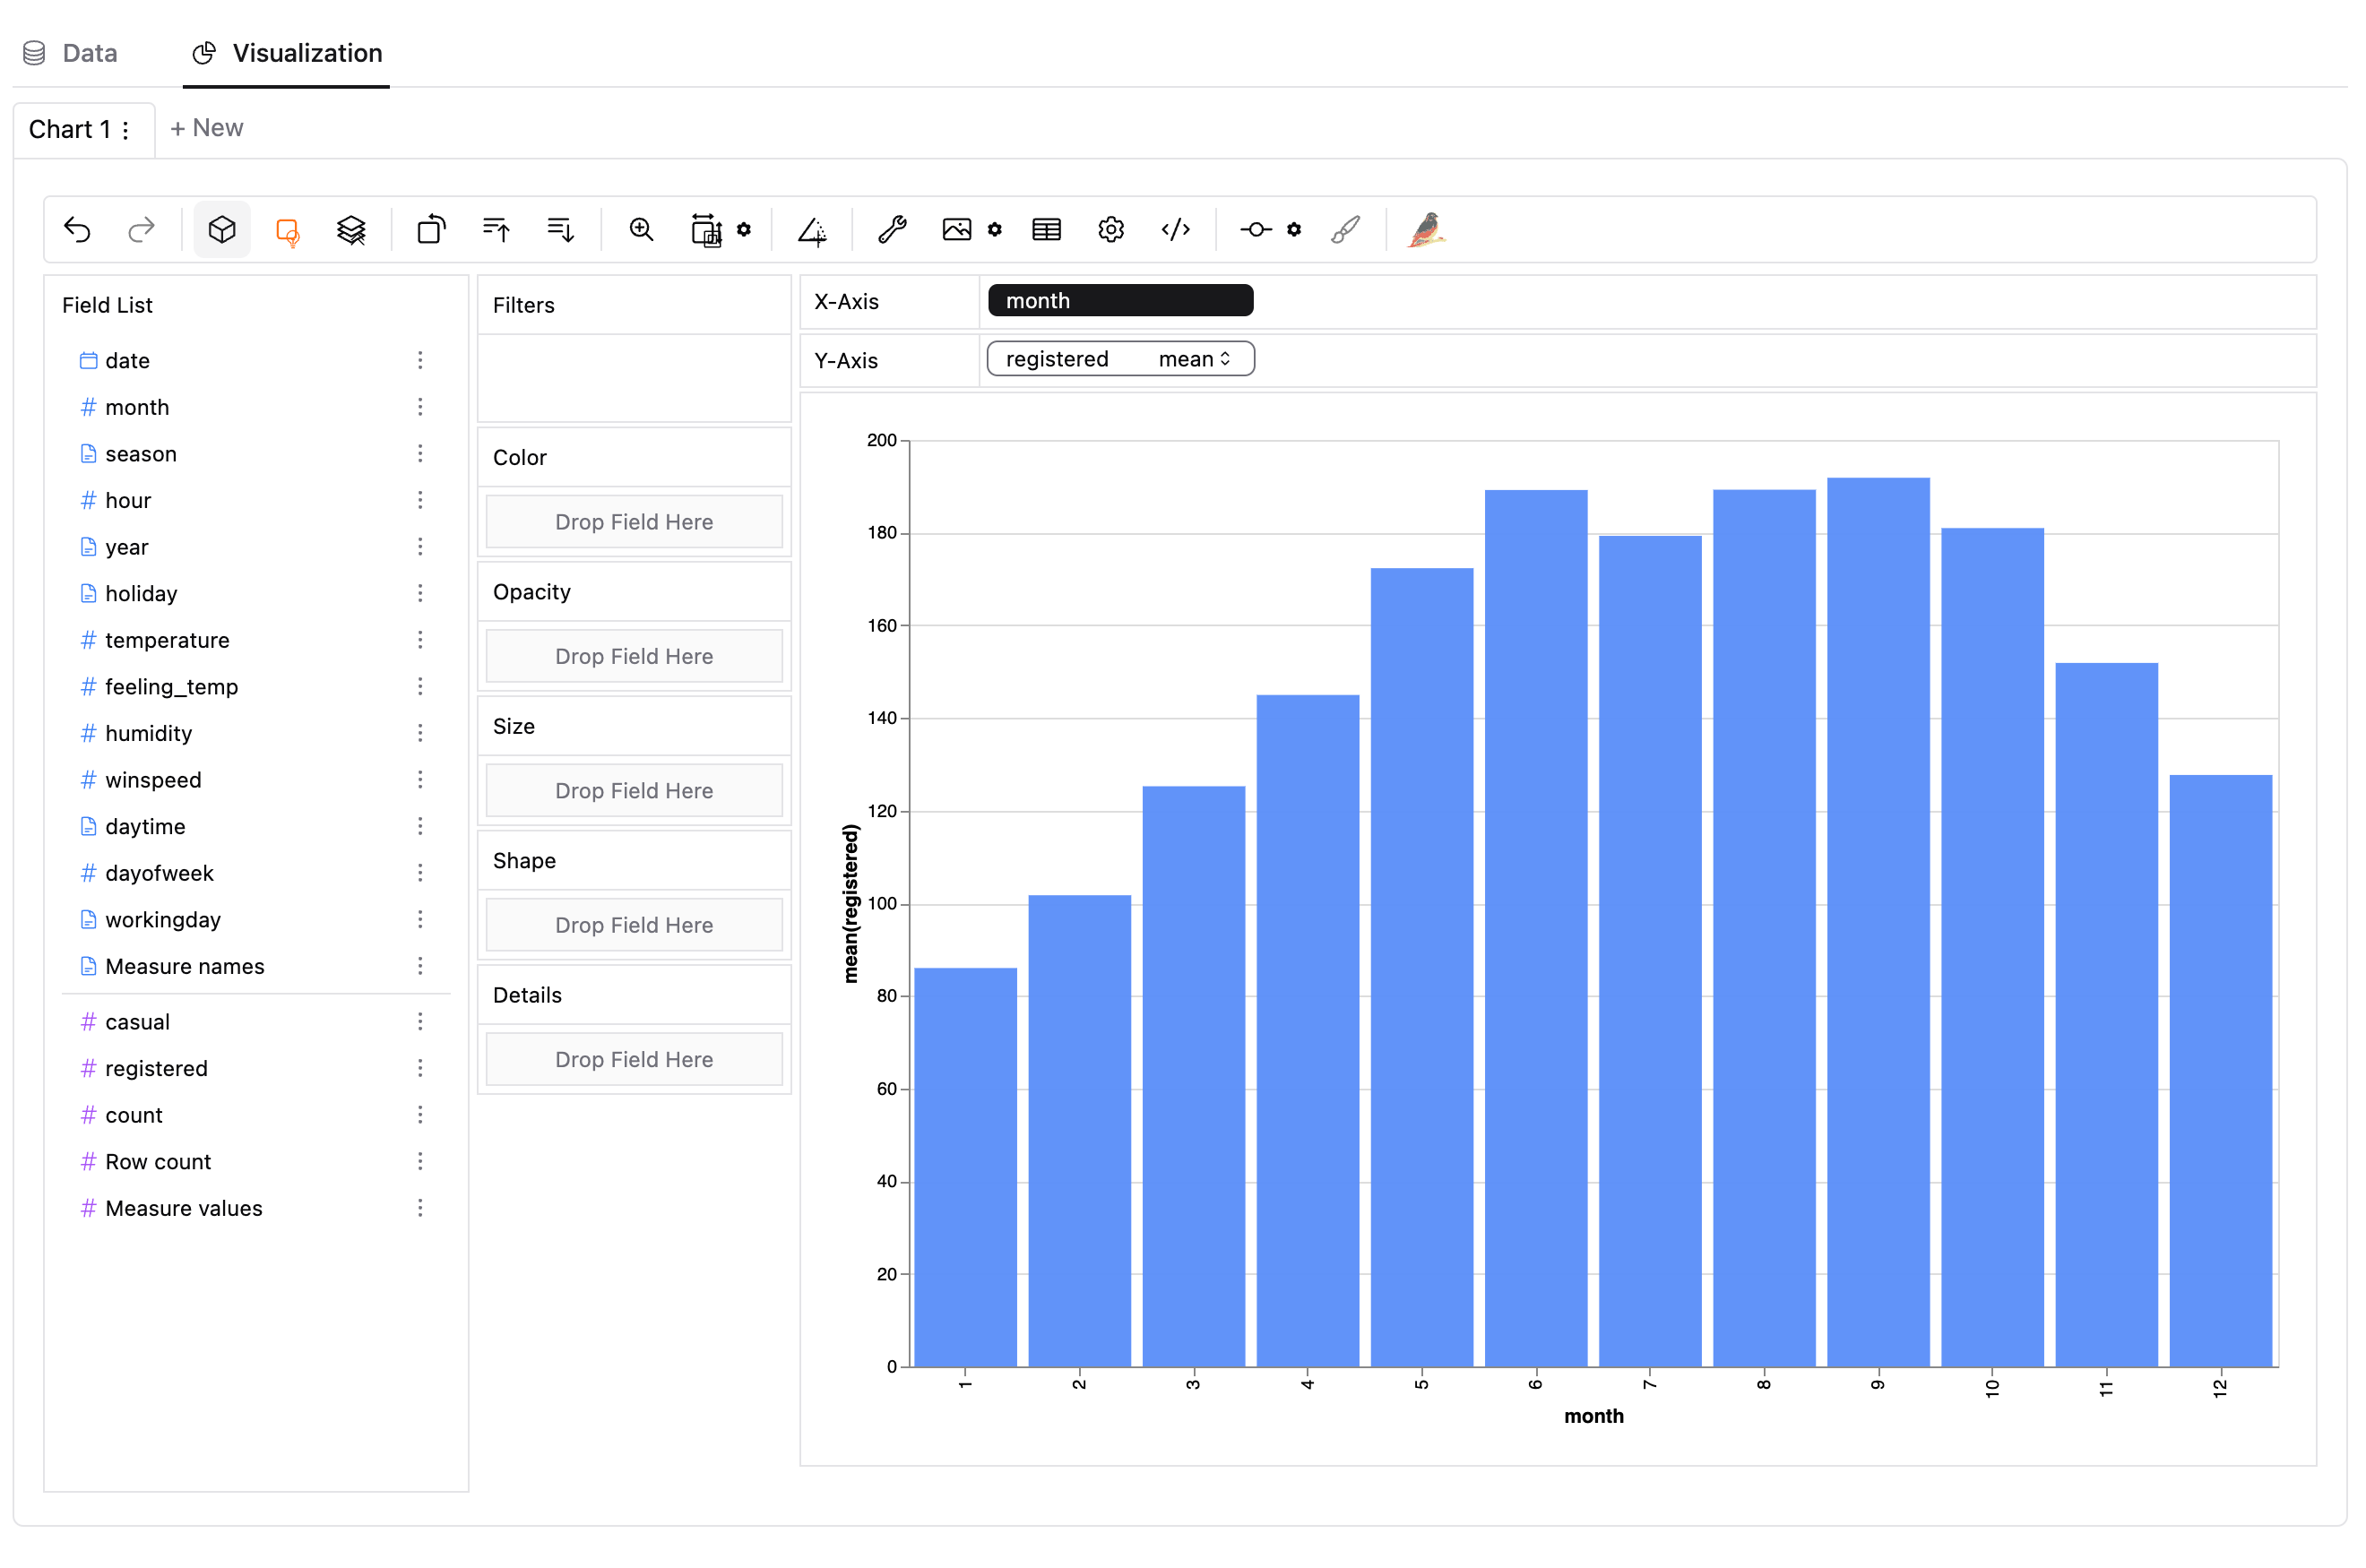
メジャーには、合計、平均、個数などの統計関数が利用できます。
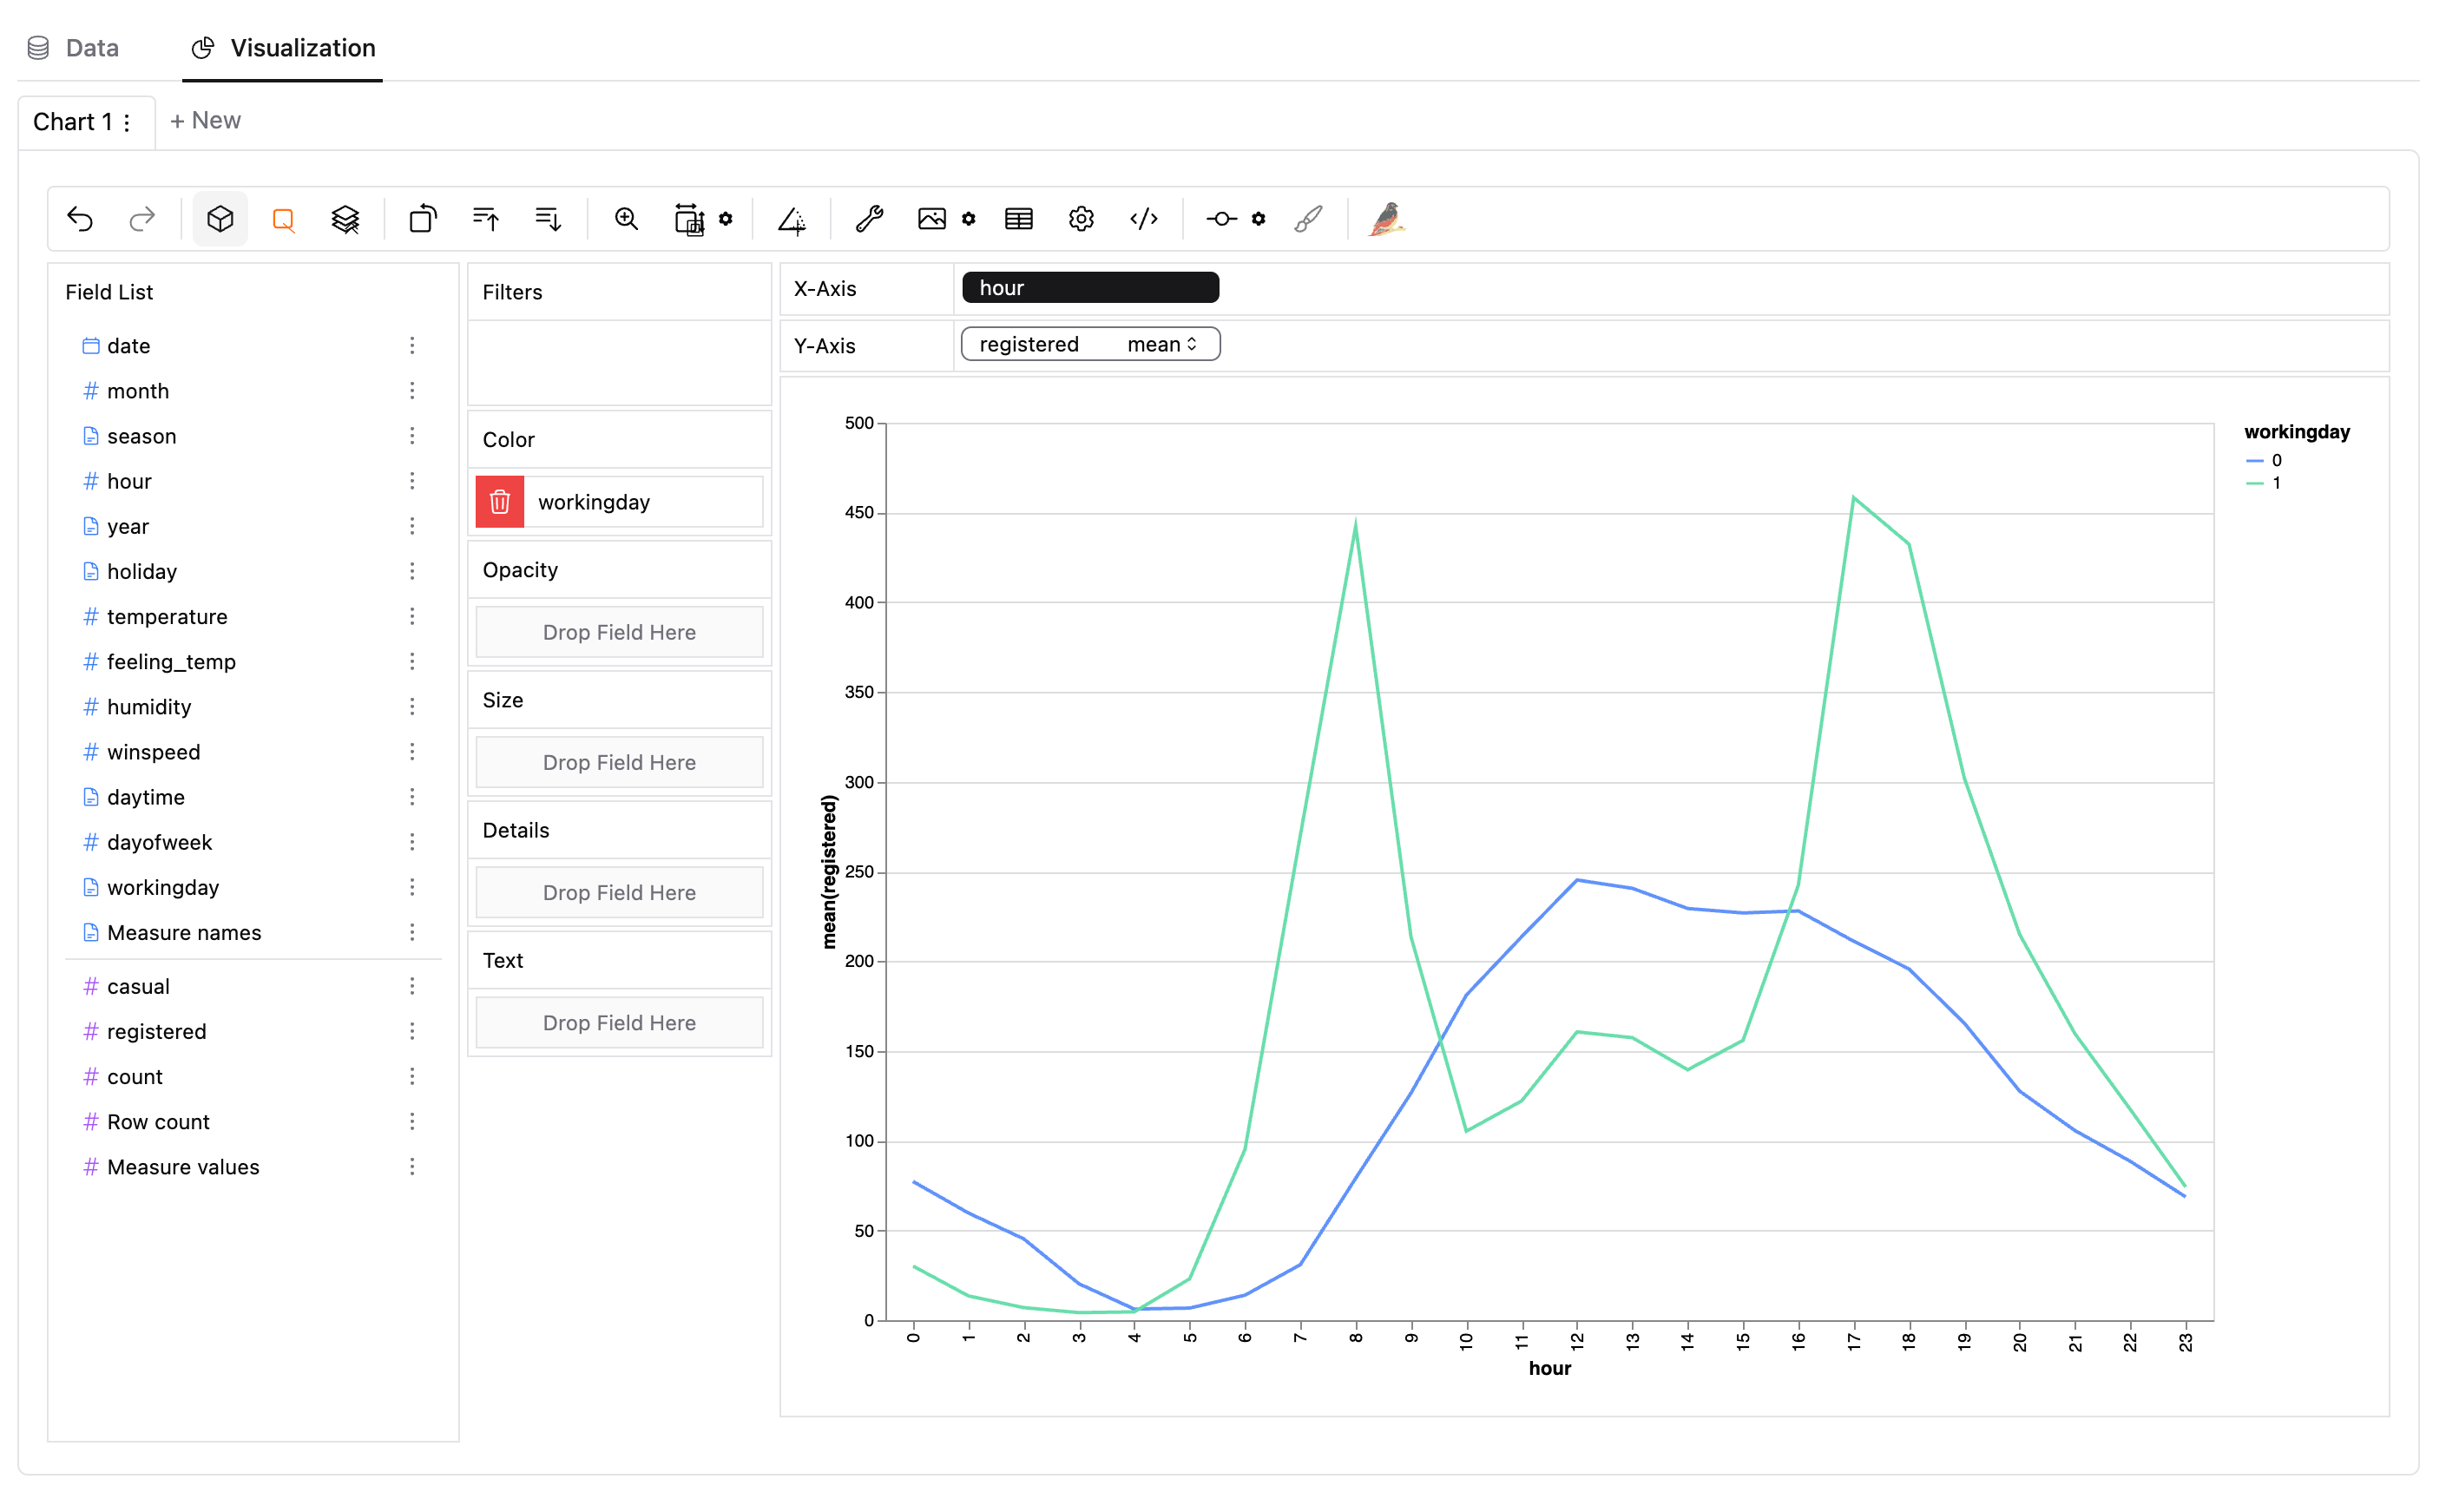
マークを設置して、グラフを別種類、例えば折れ線グラフに変更しましょう。
多数のメジャーを比較するために、行や列の空欄に複数のメジャーを入れましょう。
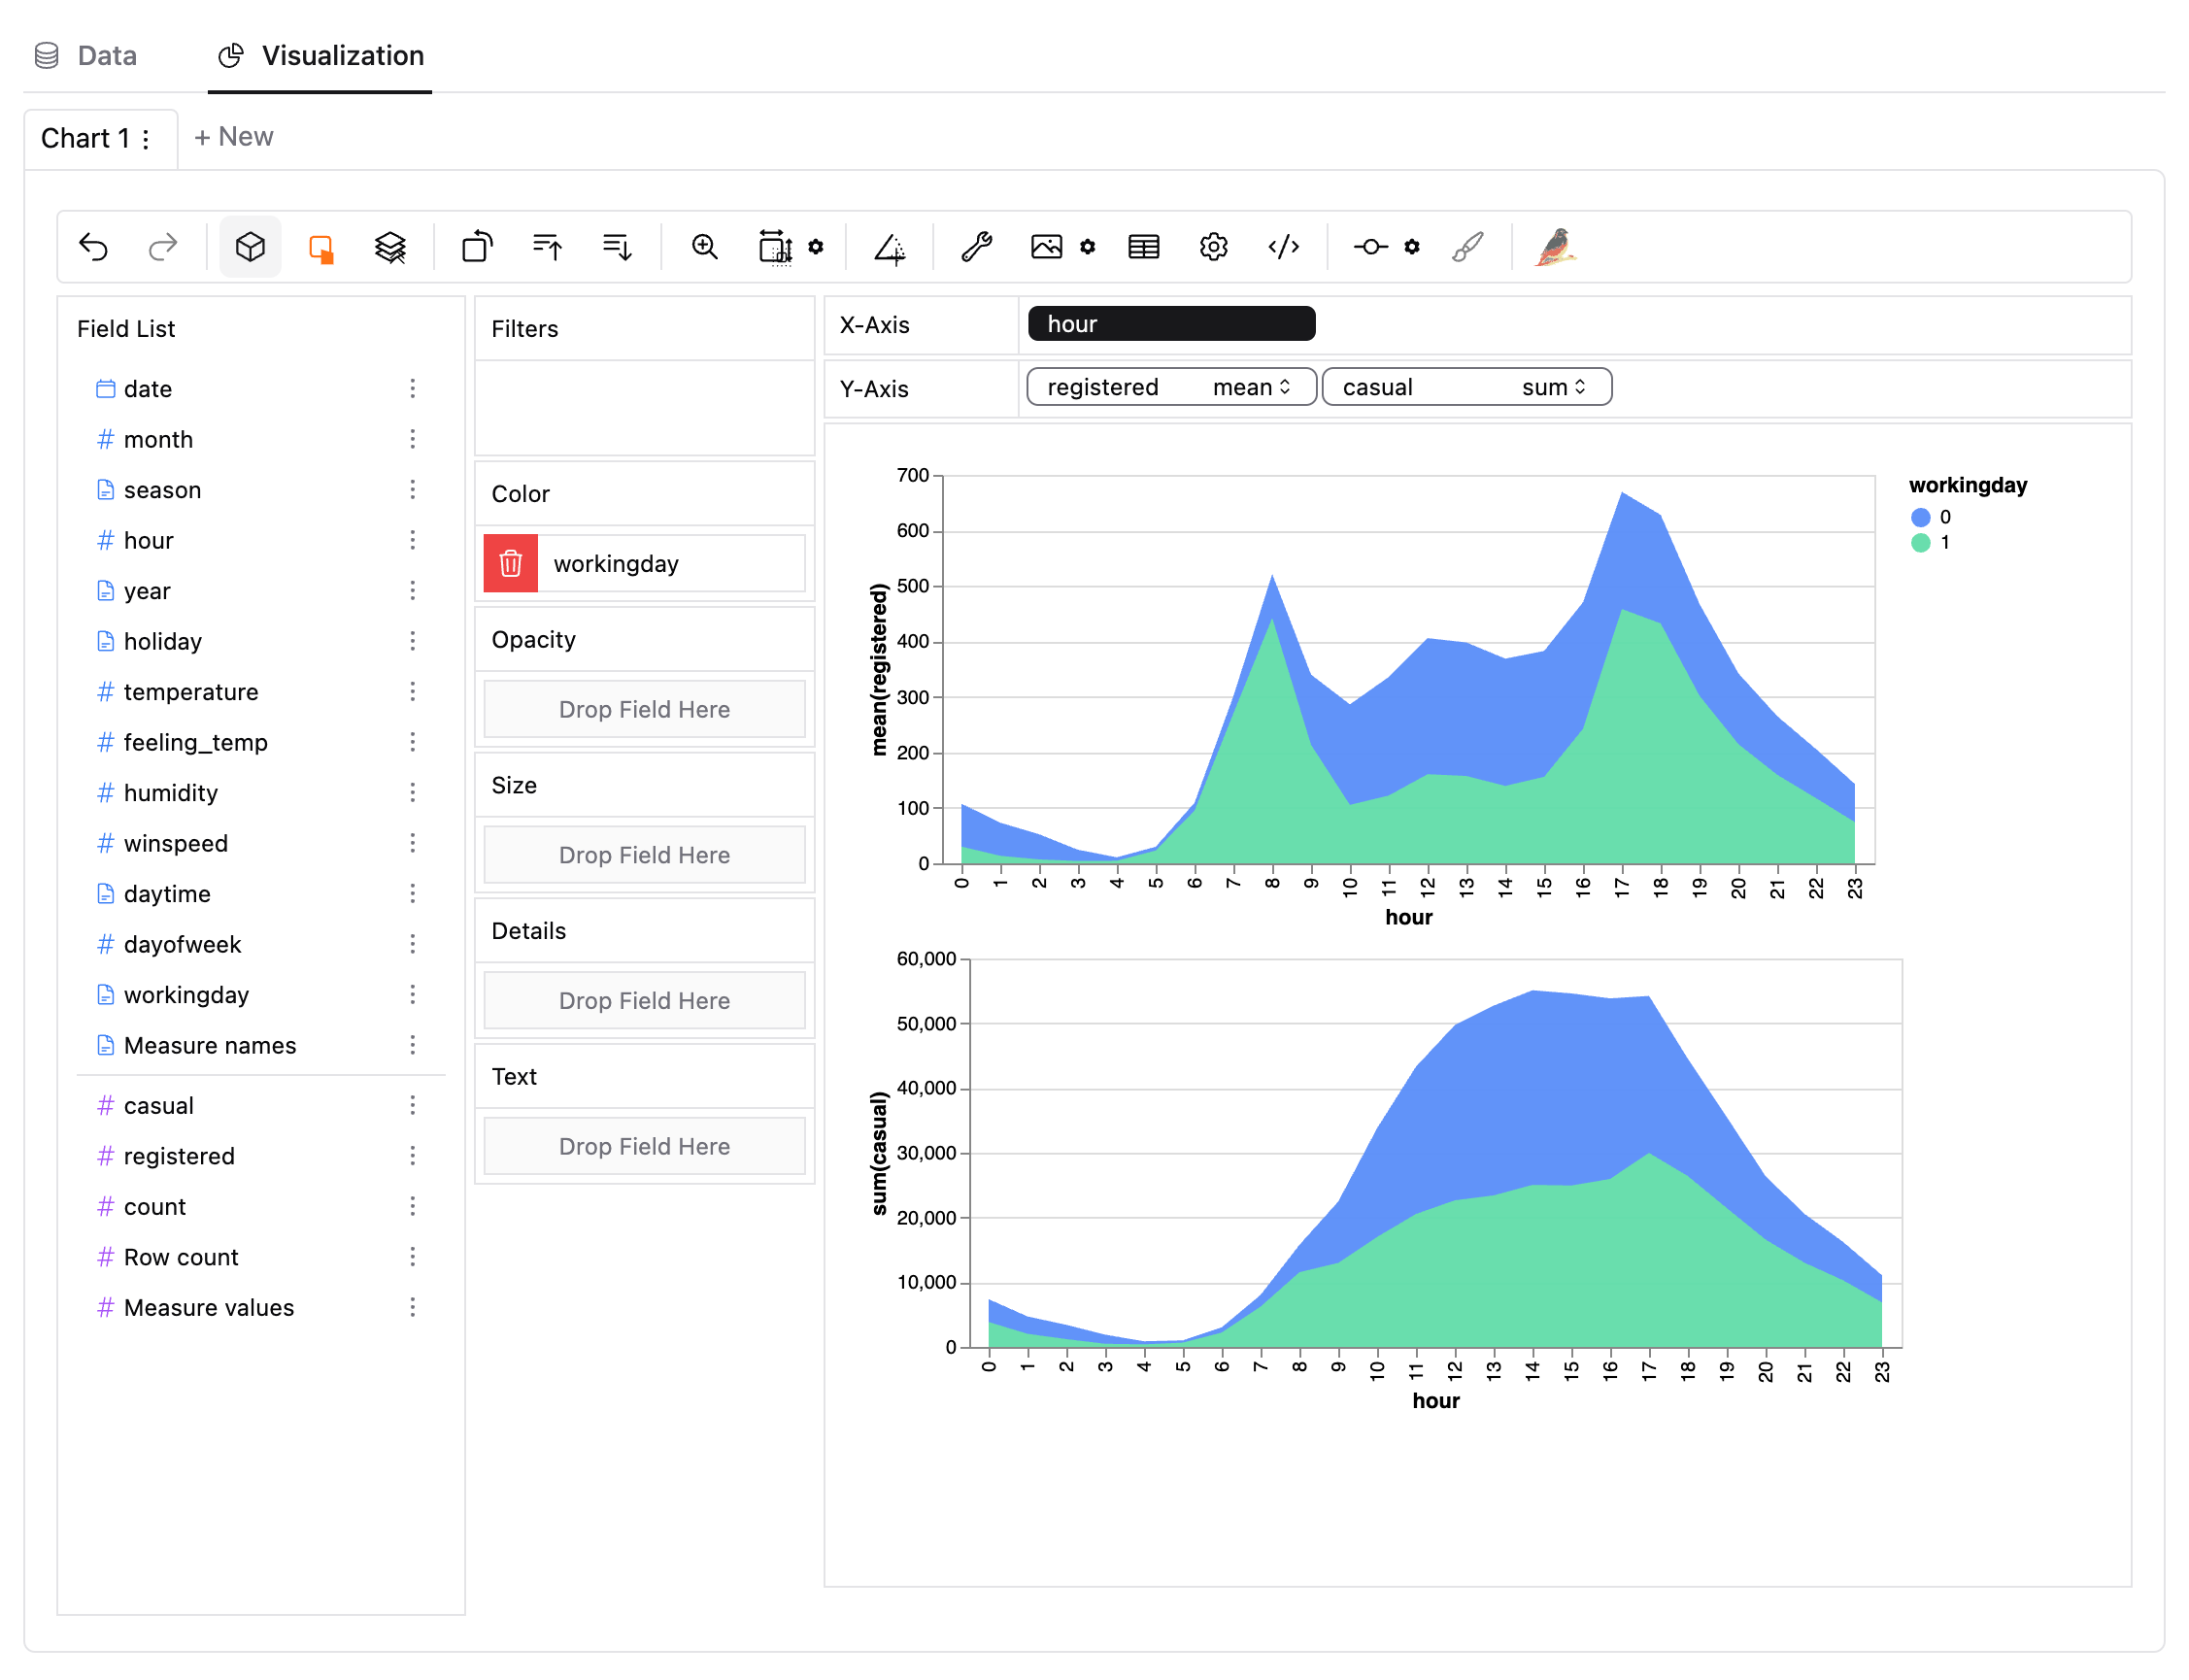
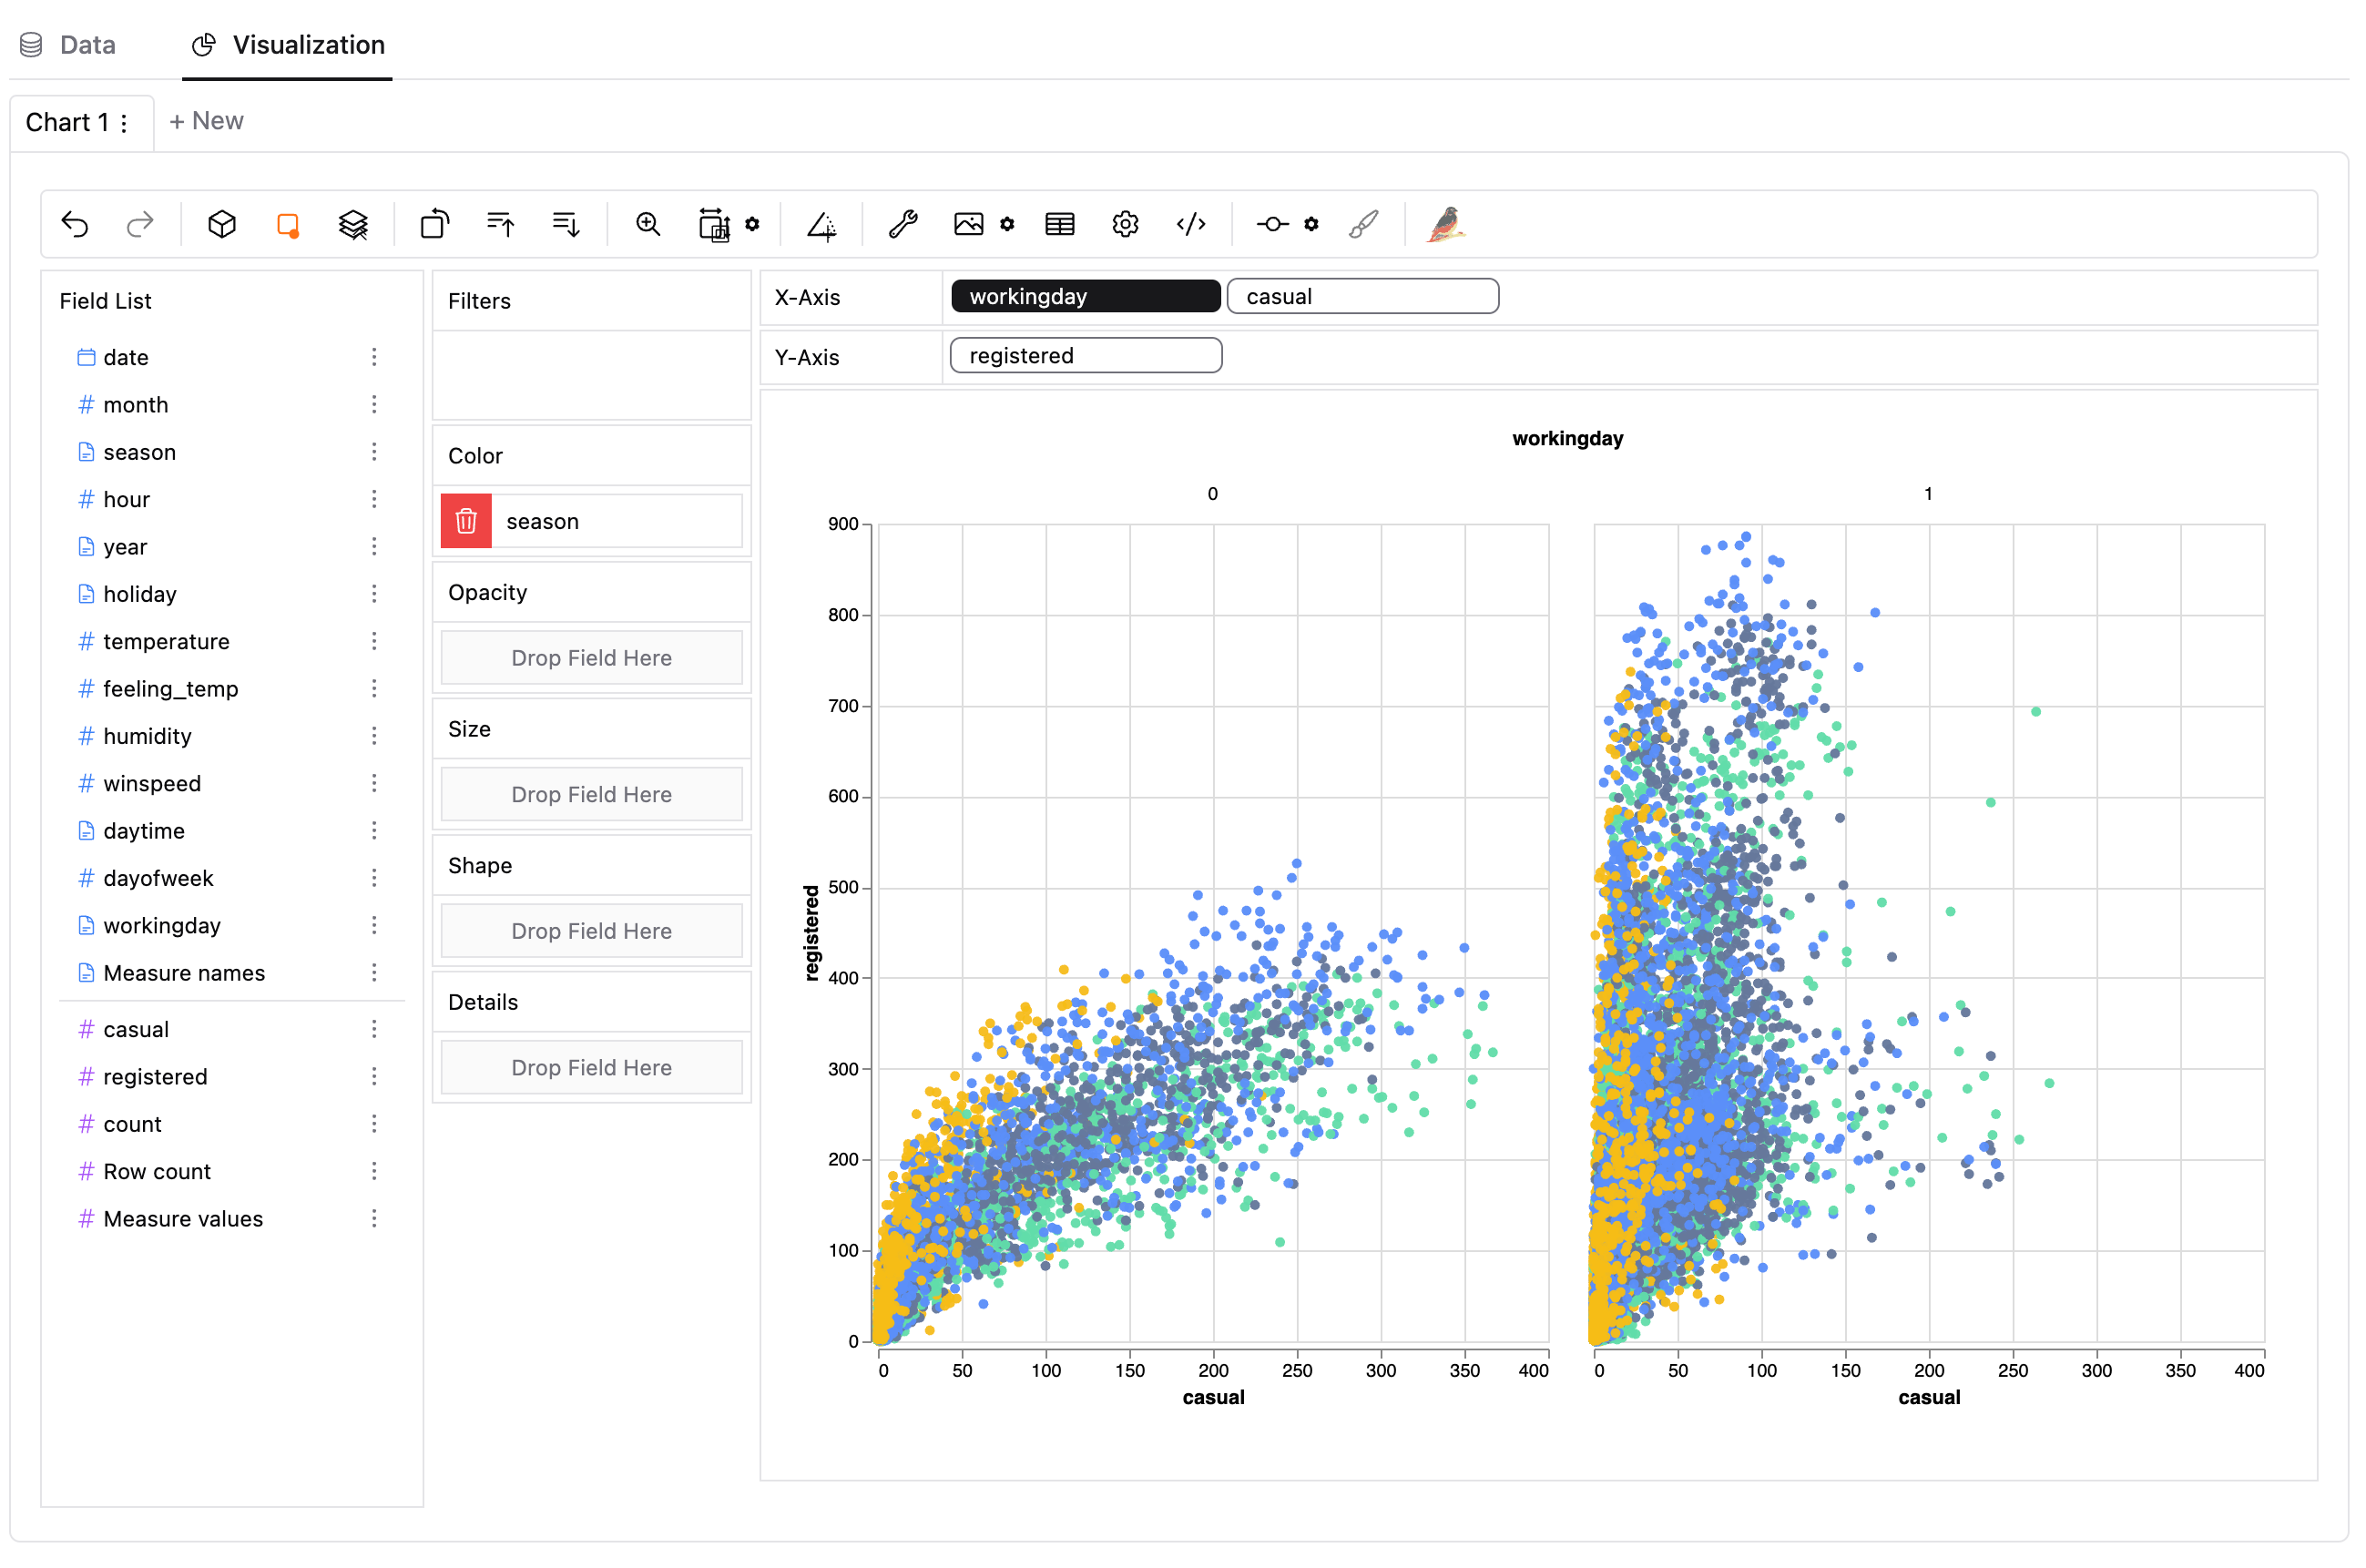
Tableau に似ていて、複数のディメンションを行や列に設置したら、複数のグラフが生成されます。
Graphic Walker は編集した結果をファイルとして保存することができます。今回の分析を続けたい時または結果を残したい時は、セーブ・アンド・ロード機能を利用しましょう。
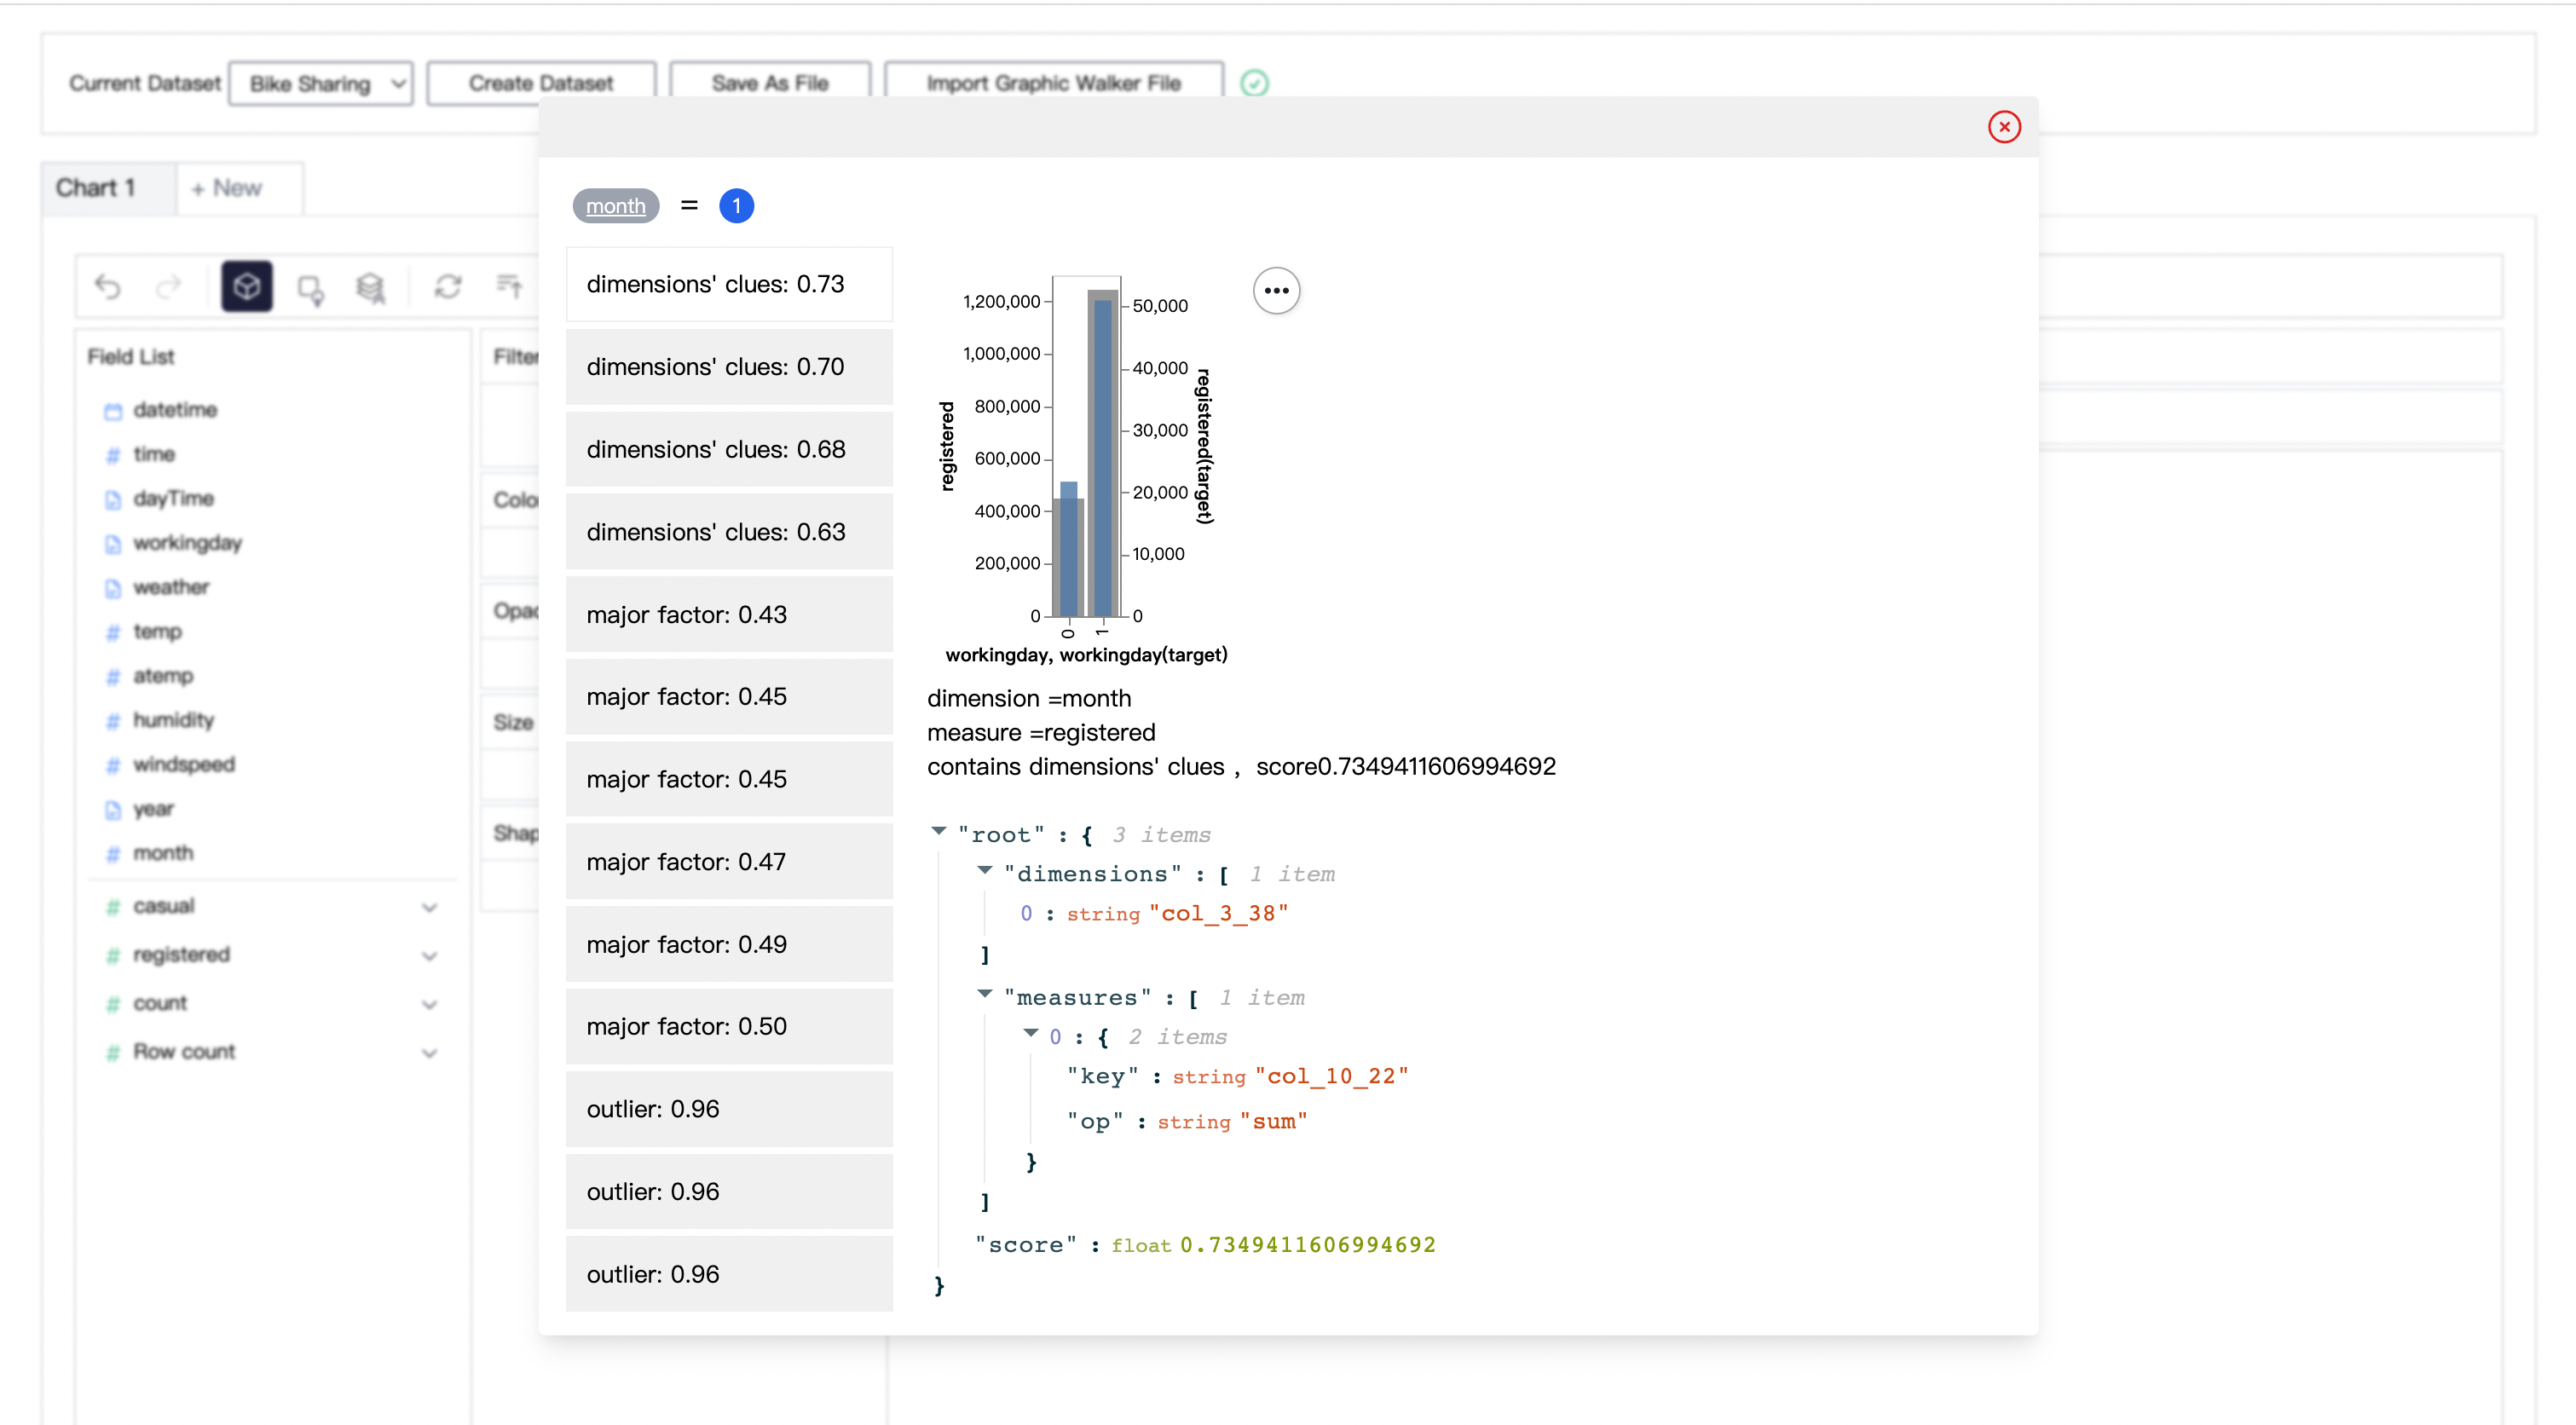
データを探索する時に気になるとこがあったら、インサイト機能を使って補助情報をチェックしてみましょう。
例えば、bike sharing データセットを分析するとき、1月の登録者の利用数が期待された値よりあきらかに低いということに気付きました。マークをクリックしてインサイト機能を使ってみよう。
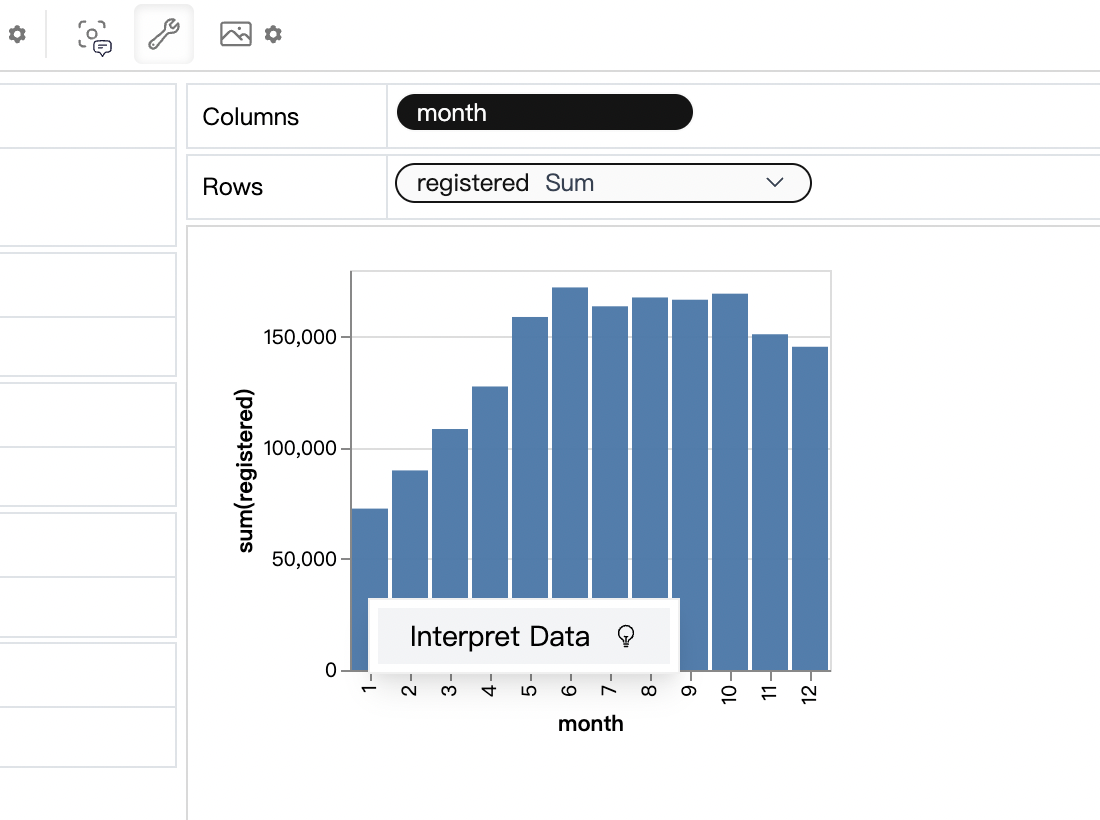
インサイト機能が提供した情報によると、1月には就業日の数が平均より少ないとのことです。
## デプロイ
デプロイより、今すぐ試すことをご希望する方は、オンラインバージョンをご利用ください:[Graphic Walker Online](https://graphic-walker.kanaries.net)
### 方法1:本リポジトリを配置
```bash
yarn install
yarn workspace @kanaries/graphic-walker build
```
### 方法2:あなたの Web アプリに実装
Graphic Walker の埋め込みは非常に簡単です。まずはインストールです。
```bash
yarn add @kanaries/graphic-walker
# or
npm i --save @kanaries/graphic-walker
```
あなたの React アプリで:
```typescript
import { GraphicWalker } from '@kanaries/graphic-walker';
const YourEmbeddingApp: React.FC = props => {
const { data, fields } = props;
return
}
export default YourEmbeddingApp;
```
もし Graphic Walker のコンフィグがある場合、`PureRenderer` コンポーネントを使ってコントロール UI なしのチャートを表示できます。
```typescript
import { PureRenderer } from '@kanaries/graphic-walker';
const YourChart: React.FC = props => {
const { rawData, visualState, visualConfig } = props;
return
}
export default YourChart;
```
### TerseSpec:手書きできるチャート記述文法 🆕
Graphic Walker が内部で保存するチャート仕様(`IChart`)は、生成された id や明示的なチャネル・レイアウト項目を持つ、機械向けの冗長な形式です。**TerseSpec** はその上に載る手書き用の文法で、フィールドを*名前*で参照し、`normalize()` がどのコンポーネントでも受け付けられる完全なチャートに展開します:
```typescript
import { GraphicRenderer, normalize } from '@kanaries/graphic-walker';
const YourChart = ({ data, fields }) => {
const chart = normalize(
{
mark: 'bar',
x: 'Manufacturer',
y: 'mean(Price_in_thousands)',
color: 'Vehicle_type',
},
fields
);
return ;
};
```
集計ショートハンド(`mean(...)` など)、インライン計算フィールド(`computed`)、行フィルタ(`filters`)、クエリレベルの日付ドリル(`timeUnit`)などをサポートします。TerseSpec は記述専用であり、永続化とエクスポート/インポートは従来どおり canonical 形式を使うため、保存済みのチャートには一切影響しません。
👉 [playground](https://graphic-walker.kanaries.net/examples/TerseSpec) で対話的な文法サンプルを試せます。詳細な仕様は [docs/terse-spec-design.md](./docs/terse-spec-design.md) を参照してください。
### ローカルに試す (dev mode)
```bash
# packages/graphic-walker
npm run dev
```
## オープンソースコミュニティに共有
> もし [graphic walker](https://github.com/Kanaries/graphic-walker) がよいと思ったら、ぜひオープンソースコミュニティにご意見をシェアしてください。
[](https://twitter.com/share?url=https://github.com/Kanaries/graphic-walker&text=Graphic-Walker:%20A%20different%20type%20of%20open-source%20alternative%20to%20Tableau)
[](https://www.facebook.com/sharer/sharer.php?u=https://github.com/Kanaries/graphic-walker)
[](https://www.linkedin.com/shareArticle?url=https://github.com/Kanaries/graphic-walker&title=Graphic-Walker:%20A%20different%20type%20of%20open-source%20alternative%20to%20Tableau)
[](https://news.ycombinator.com/submitlink?u=https://github.com/Kanaries/graphic-walker)
[](https://reddit.com/submit?url=https://github.com/Kanaries/graphic-walker&title=Graphic-Walker:%20A%20different%20type%20of%20open-source%20alternative%20to%20Tableau)
## 多言語サポート
Graphic Walker は現在_英語_(コード `"en"` または `"en-US"`)と中国語(コード `"zh"` または `"zh-CN"`)を完全にサポートします。以下のように `props.i18nLang` で指定した言語が設置できます:
```typescript
const YourApp = props => {
// ...
const curLang = /* get your i18n language */;
return
}
```
### 多言語インタフェース
もしいまだにサポートされていない言語を使いたいなら、Graphic Walker はリソースを JSON として読み取ることができます。開発者は
Graphic Walker のソースコードを変更する必要なく、多言語データを入力することで他の言語を使えます。以下のように、`props.i18nResources` を設置します。
```typescript
const yourResources = {
'ja-JP': {
'key': 'value',
...
},
'fr-FR': {
...
},
};
const YourApp = props => {
// ...
const curLang = /* get your i18n language */;
return
}
```
Graphic Walker は `i18next` に基づく `react-i18next` を使用します。多言語インタフェースについては[こちら](https://www.i18next.com/misc/json-format)で参照しましょう。また、本リポジトリにある `/locales/en-US.json` を参照して翻訳を始めることもおすすめです。
## API
Graphic Walker Props interface
```ts
export interface IGWProps {
data?: IRow[];
fields?: IMutField[];
spec?: Specification;
i18nLang?: string;
i18nResources?: { [lang: string]: Record };
keepAlive?: boolean;
}
```
関数
+ `data`, type `Array<{[key: string]: any}>`, key-value オブジェクトの配列。
+ `fields`, type [IMutField](./packages/graphic-walker/src/interfaces.ts). 列の配列。
+ `spec`, type [Specification](./packages/graphic-walker/src/interfaces.ts). 可視化の配置データ。
+ `i18nLang`, type `string`. 言語コード。
+ `i18nResources` 多言語データ。
+ `keepAlive`, type `boolean`. `true` に設置したら、Graphic Walker はコンポーネントが削除されても、また使う必要のあるデータをセーブします。
## つづく
Graphic Walker は主に基本的な分析任務をサポートします。複雑なデータを分析するには、少し足りない部分があるかも知れません。その時に [Rath](https://github.com/Kanaries/Rath) がおすすめです。
## LICENSE
Please refer to [LICENSE](./LICENSE) and [LICENSE2](./LICENSE2) file.
[English](./README.md) | [简体中文](./README.zh-CN.md) | 日本語

# graphic-walker



[](https://twitter.com/kanaries_data)
[](https://discord.gg/WWHraZ8SeV)
[](https://www.youtube.com/@kanaries_data)
[](https://medium.com/@observedobserver)
[](https://www.linkedin.com/company/kanaries-data/)
Graphic Walker は Tableau と異なる形で仕組みされて、Tableau のオープンソースの代用品です。簡単なドラッグ・アンド・ドロップ操作でデータ分析と可視化を実現します。データサイエンティストの分析需要を支援する機能を備えています。
#### Tableau との違い
Graphic Walker は React コンポーネントの形で、プラグインとして Web アプリに簡単に埋め込めます。Tableau と違って、Graphic Walker は豊かな機能でできているのではなく、基本の機能を簡単に使用できるようにデザインされている軽量なツールです。Graphic Walker を React アプリに埋め込むことは非常に簡単です !
#### 主な機能
+ 使いやすいインタラクション。簡単な手順でデータの分析と可視化を完成できます。
+ Grammar of graphics に基づく [vega-lite](https://vega.github.io/vega-lite/) で実現する可視化。
+ データの中のパターンと期待はずれの値になったマークを解釈する情報の生成。
+ WebWorker の使用によって純粋なフロントエンドとして埋め込める高い拡張性。
> Graphic Walker は軽量なコンポーネントです。もしより多くの機能がお望みなら、同じくわたしたちのチームで開発した [RATH](https://github.com/Kanaries/Rath) という拡張分析エンジンを使い、自動的なパターン発見、洞察探索、因果分析など多様な機能が備えるツールをご覧ください。
## 手順
最初は、分析したいデータを CSV ファイルとして導入します。データを確認する際に、各列どれがディメンションか、どれがメジャーかを決めます。
> 導入できるデータソースの種類を増やす予定がありますので、追加をご希望する方は気軽に私たちに連絡または issue で教えてください。開発者には、直接にデータを props として Graphic Walker に入力することができます。[Rath](https://github.com/Kanaries/Rath) はその方法で、多くのデータソースをサポートします。また、[Rath](https://github.com/Kanaries/Rath) でデータを導入してセーブするファイルを Graphic Walker に取り込むこともできます。Graphic Walker で導入できないデータを [Rath](https://github.com/Kanaries/Rath) で処理したり、変換したりしてから Graphic Walker で分析する選択肢もあります。

確認が完了したら、『Submit』をクリックしましょう。データの各ディメンションとメジャーは左のリストに表示されます。それらをその右側のスペース(行、列、色、不透明度など)にドロップしたら、可視化が生成します。

メジャーには、合計、平均、個数などの統計関数が利用できます。

マークを設置して、グラフを別種類、例えば折れ線グラフに変更しましょう。

多数のメジャーを比較するために、行や列の空欄に複数のメジャーを入れましょう。

Tableau に似ていて、複数のディメンションを行や列に設置したら、複数のグラフが生成されます。

Graphic Walker は編集した結果をファイルとして保存することができます。今回の分析を続けたい時または結果を残したい時は、セーブ・アンド・ロード機能を利用しましょう。
データを探索する時に気になるとこがあったら、インサイト機能を使って補助情報をチェックしてみましょう。
例えば、bike sharing データセットを分析するとき、1月の登録者の利用数が期待された値よりあきらかに低いということに気付きました。マークをクリックしてインサイト機能を使ってみよう。

インサイト機能が提供した情報によると、1月には就業日の数が平均より少ないとのことです。

## デプロイ
デプロイより、今すぐ試すことをご希望する方は、オンラインバージョンをご利用ください:[Graphic Walker Online](https://graphic-walker.kanaries.net)
### 方法1:本リポジトリを配置
```bash
yarn install
yarn workspace @kanaries/graphic-walker build
```
### 方法2:あなたの Web アプリに実装
Graphic Walker の埋め込みは非常に簡単です。まずはインストールです。
```bash
yarn add @kanaries/graphic-walker
# or
npm i --save @kanaries/graphic-walker
```
あなたの React アプリで:
```typescript
import { GraphicWalker } from '@kanaries/graphic-walker';
const YourEmbeddingApp: React.FC = props => {
const { data, fields } = props;
return
}
export default YourEmbeddingApp;
```
もし Graphic Walker のコンフィグがある場合、`PureRenderer` コンポーネントを使ってコントロール UI なしのチャートを表示できます。
```typescript
import { PureRenderer } from '@kanaries/graphic-walker';
const YourChart: React.FC = props => {
const { rawData, visualState, visualConfig } = props;
return
}
export default YourChart;
```
### TerseSpec:手書きできるチャート記述文法 🆕
Graphic Walker が内部で保存するチャート仕様(`IChart`)は、生成された id や明示的なチャネル・レイアウト項目を持つ、機械向けの冗長な形式です。**TerseSpec** はその上に載る手書き用の文法で、フィールドを*名前*で参照し、`normalize()` がどのコンポーネントでも受け付けられる完全なチャートに展開します:
```typescript
import { GraphicRenderer, normalize } from '@kanaries/graphic-walker';
const YourChart = ({ data, fields }) => {
const chart = normalize(
{
mark: 'bar',
x: 'Manufacturer',
y: 'mean(Price_in_thousands)',
color: 'Vehicle_type',
},
fields
);
return ;
};
```
集計ショートハンド(`mean(...)` など)、インライン計算フィールド(`computed`)、行フィルタ(`filters`)、クエリレベルの日付ドリル(`timeUnit`)などをサポートします。TerseSpec は記述専用であり、永続化とエクスポート/インポートは従来どおり canonical 形式を使うため、保存済みのチャートには一切影響しません。
👉 [playground](https://graphic-walker.kanaries.net/examples/TerseSpec) で対話的な文法サンプルを試せます。詳細な仕様は [docs/terse-spec-design.md](./docs/terse-spec-design.md) を参照してください。
### ローカルに試す (dev mode)
```bash
# packages/graphic-walker
npm run dev
```
## オープンソースコミュニティに共有
> もし [graphic walker](https://github.com/Kanaries/graphic-walker) がよいと思ったら、ぜひオープンソースコミュニティにご意見をシェアしてください。
[](https://twitter.com/share?url=https://github.com/Kanaries/graphic-walker&text=Graphic-Walker:%20A%20different%20type%20of%20open-source%20alternative%20to%20Tableau)
[](https://www.facebook.com/sharer/sharer.php?u=https://github.com/Kanaries/graphic-walker)
[](https://www.linkedin.com/shareArticle?url=https://github.com/Kanaries/graphic-walker&title=Graphic-Walker:%20A%20different%20type%20of%20open-source%20alternative%20to%20Tableau)
[](https://news.ycombinator.com/submitlink?u=https://github.com/Kanaries/graphic-walker)
[](https://reddit.com/submit?url=https://github.com/Kanaries/graphic-walker&title=Graphic-Walker:%20A%20different%20type%20of%20open-source%20alternative%20to%20Tableau)
## 多言語サポート
Graphic Walker は現在_英語_(コード `"en"` または `"en-US"`)と中国語(コード `"zh"` または `"zh-CN"`)を完全にサポートします。以下のように `props.i18nLang` で指定した言語が設置できます:
```typescript
const YourApp = props => {
// ...
const curLang = /* get your i18n language */;
return
}
```
### 多言語インタフェース
もしいまだにサポートされていない言語を使いたいなら、Graphic Walker はリソースを JSON として読み取ることができます。開発者は
Graphic Walker のソースコードを変更する必要なく、多言語データを入力することで他の言語を使えます。以下のように、`props.i18nResources` を設置します。
```typescript
const yourResources = {
'ja-JP': {
'key': 'value',
...
},
'fr-FR': {
...
},
};
const YourApp = props => {
// ...
const curLang = /* get your i18n language */;
return
}
```
Graphic Walker は `i18next` に基づく `react-i18next` を使用します。多言語インタフェースについては[こちら](https://www.i18next.com/misc/json-format)で参照しましょう。また、本リポジトリにある `/locales/en-US.json` を参照して翻訳を始めることもおすすめです。
## API
Graphic Walker Props interface
```ts
export interface IGWProps {
data?: IRow[];
fields?: IMutField[];
spec?: Specification;
i18nLang?: string;
i18nResources?: { [lang: string]: Record };
keepAlive?: boolean;
}
```
関数
+ `data`, type `Array<{[key: string]: any}>`, key-value オブジェクトの配列。
+ `fields`, type [IMutField](./packages/graphic-walker/src/interfaces.ts). 列の配列。
+ `spec`, type [Specification](./packages/graphic-walker/src/interfaces.ts). 可視化の配置データ。
+ `i18nLang`, type `string`. 言語コード。
+ `i18nResources` 多言語データ。
+ `keepAlive`, type `boolean`. `true` に設置したら、Graphic Walker はコンポーネントが削除されても、また使う必要のあるデータをセーブします。
## つづく
Graphic Walker は主に基本的な分析任務をサポートします。複雑なデータを分析するには、少し足りない部分があるかも知れません。その時に [Rath](https://github.com/Kanaries/Rath) がおすすめです。
## LICENSE
Please refer to [LICENSE](./LICENSE) and [LICENSE2](./LICENSE2) file.