# rHarmonics
[](https://zenodo.org/badge/latestdoi/256769269)
R package for harmonic modelling of time-series data.
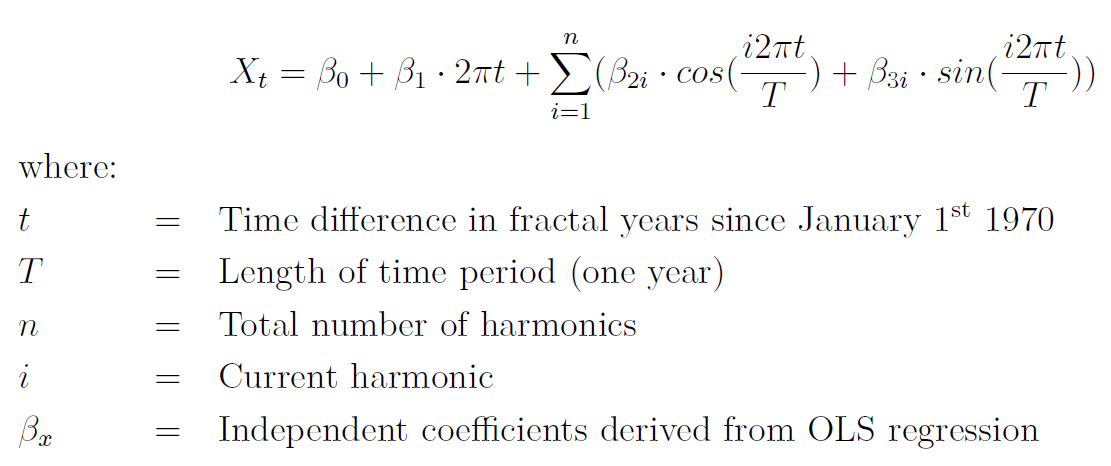
 To calculate the harmonic fitted curve of a periodic signal, ordinary least squares regressions are computed using coupled sine and cosine curves on time-series data. The underlying algorithm which is based Shumway, R. H., & Stoffer, D. S. (2017) equations 4.1 - 4.2 can be seen below:
 ## Installation
To install the current version, use `devtools`.
```R
devtools::install_github("MBalthasar/rHarmonics")
```
## Available Functions
The following functions are currently available and tested on Windows 10.
* `harmonics_fun()` This function enables the user to model different number of cycles per year for a given time series data set.
## Example
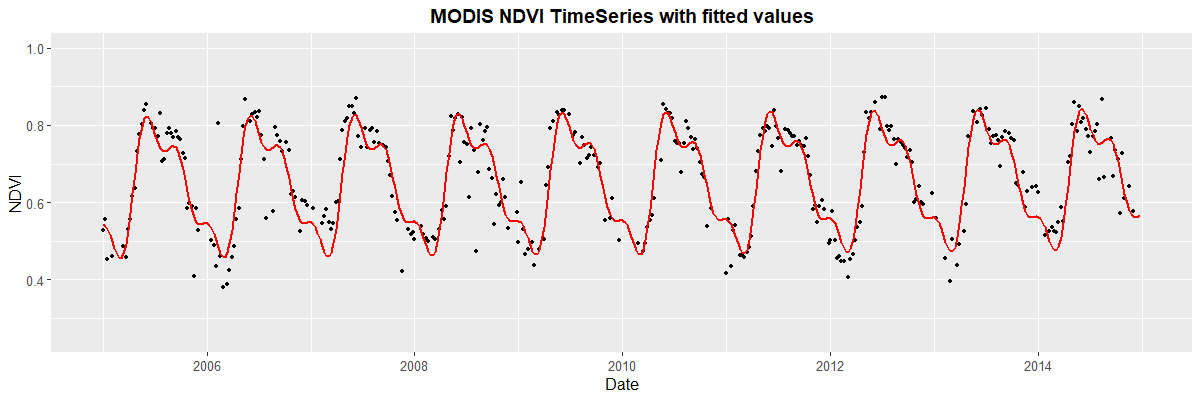
In this example a fitted curve using three cylces per year based on a NDVI MODIS timeseries is computed:
```R
library(ggplot2)
# Load sample NDVI time-series data.frame
ndvi_df <- base::readRDS(system.file(package = "rHarmonics",
"extdata", "MODIS_NDVI_TimeSeries.rda"))
# Apply harmonic function using 3 cycles per year
fitted_3rd_deg <- harmonics_fun(user_vals = ndvi_df$ndvi,
user_dates = ndvi_df$dates,
harmonic_deg = 3)
# Combine fitted values with original df
combined_df <- cbind(ndvi_df, fitted_3rd_deg)
names(combined_df) <- c("dates", "ndvi", "fitted")
# Plot original data with fitted values
ggplot2::ggplot() +
geom_point(data=combined_df, aes(x = dates, y = ndvi), color='black', size=1) +
geom_line(data=combined_df, aes(x = dates, y = fitted), colour = "red", size=1)+
labs(title="MODIS NDVI TimeSeries with fitted values", x="Date", y="NDVI") +
theme(plot.title = element_text(hjust = 0.5, face="bold", size=14),
axis.text=element_text(size=10),
axis.title=element_text(size=12),
legend.title=element_text(size=13, face="bold"),
legend.text=element_text(size=13))+
ylim(0,1)
```
## Installation
To install the current version, use `devtools`.
```R
devtools::install_github("MBalthasar/rHarmonics")
```
## Available Functions
The following functions are currently available and tested on Windows 10.
* `harmonics_fun()` This function enables the user to model different number of cycles per year for a given time series data set.
## Example
In this example a fitted curve using three cylces per year based on a NDVI MODIS timeseries is computed:
```R
library(ggplot2)
# Load sample NDVI time-series data.frame
ndvi_df <- base::readRDS(system.file(package = "rHarmonics",
"extdata", "MODIS_NDVI_TimeSeries.rda"))
# Apply harmonic function using 3 cycles per year
fitted_3rd_deg <- harmonics_fun(user_vals = ndvi_df$ndvi,
user_dates = ndvi_df$dates,
harmonic_deg = 3)
# Combine fitted values with original df
combined_df <- cbind(ndvi_df, fitted_3rd_deg)
names(combined_df) <- c("dates", "ndvi", "fitted")
# Plot original data with fitted values
ggplot2::ggplot() +
geom_point(data=combined_df, aes(x = dates, y = ndvi), color='black', size=1) +
geom_line(data=combined_df, aes(x = dates, y = fitted), colour = "red", size=1)+
labs(title="MODIS NDVI TimeSeries with fitted values", x="Date", y="NDVI") +
theme(plot.title = element_text(hjust = 0.5, face="bold", size=14),
axis.text=element_text(size=10),
axis.title=element_text(size=12),
legend.title=element_text(size=13, face="bold"),
legend.text=element_text(size=13))+
ylim(0,1)
```
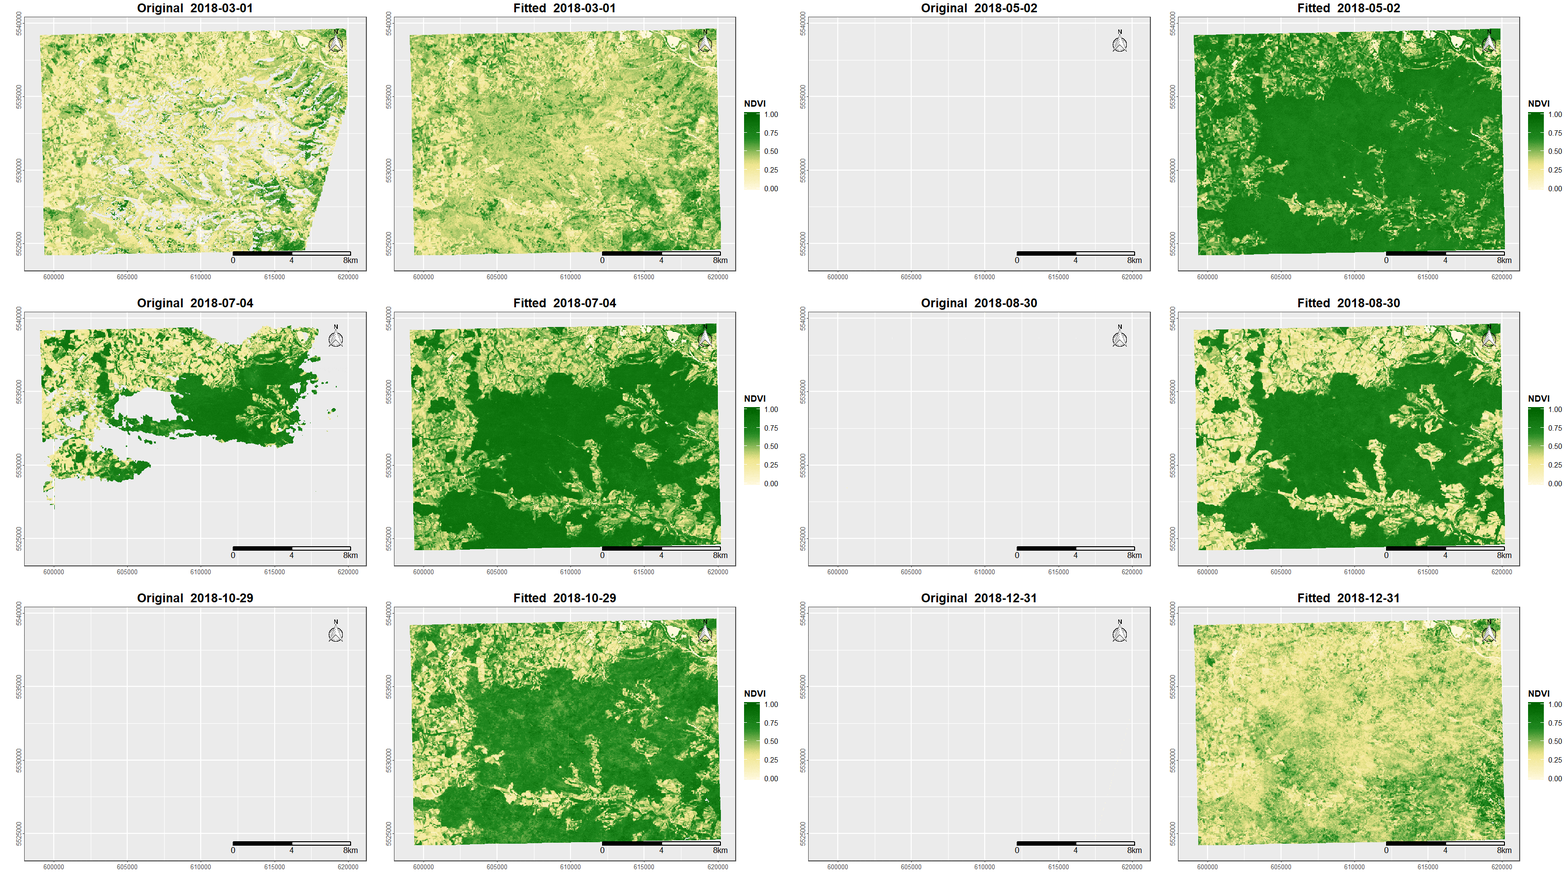
 The function can also be applied on a multi-layer raster stack to create a cloud-interpolated psuedo times-series data set:
```R
# Apply harmonic function on multi-layer raster file
library(raster)
# Load sample cloud- and snow-free MODIS TimeSeries
sample_raster <- raster::brick(system.file(package = "rHarmonics",
"extdata",
"MODIS_NDVI_stack.tif"))
fitted_raster <- raster::calc(sample_raster,
function(x){
harmonics_fun(x, user_dates = ndvi_df$dates,
harmonic_deg = 3)
})
```
## Citation
Philipp, M. B. (2020): rHarmonics V.1.0. Zenodo. https://doi.org/10.5281/zenodo.3994381.
## Literature
Shumway, R. H., & Stoffer, D. S. (2017). Time series analysis and its applications: with r examples. Springer.
The function can also be applied on a multi-layer raster stack to create a cloud-interpolated psuedo times-series data set:
```R
# Apply harmonic function on multi-layer raster file
library(raster)
# Load sample cloud- and snow-free MODIS TimeSeries
sample_raster <- raster::brick(system.file(package = "rHarmonics",
"extdata",
"MODIS_NDVI_stack.tif"))
fitted_raster <- raster::calc(sample_raster,
function(x){
harmonics_fun(x, user_dates = ndvi_df$dates,
harmonic_deg = 3)
})
```
## Citation
Philipp, M. B. (2020): rHarmonics V.1.0. Zenodo. https://doi.org/10.5281/zenodo.3994381.
## Literature
Shumway, R. H., & Stoffer, D. S. (2017). Time series analysis and its applications: with r examples. Springer.