# Heron **The Wireshark for AI Agents** Passive agent observability — reconstructed from the traffic itself, off the wire or at the host's TLS boundary, never in the request path. [![CI](https://github.com/Netis/heron/actions/workflows/ci.yml/badge.svg)](https://github.com/Netis/heron/actions/workflows/ci.yml) [![Release](https://img.shields.io/github/v/release/Netis/heron?sort=semver)](https://github.com/Netis/heron/releases/latest) [![License](https://img.shields.io/badge/license-Apache--2.0-blue.svg)](LICENSE) [![Platforms](https://img.shields.io/badge/platforms-linux%20%C2%B7%20macOS-informational)](docs/install.md) > **Zero SDK. Zero Proxy. Zero Intrusion.** > Replay a `.pcap` and instantly see every agent turn, tool call, and LLM > interaction. No code changes. No cooperation from the workloads being observed.

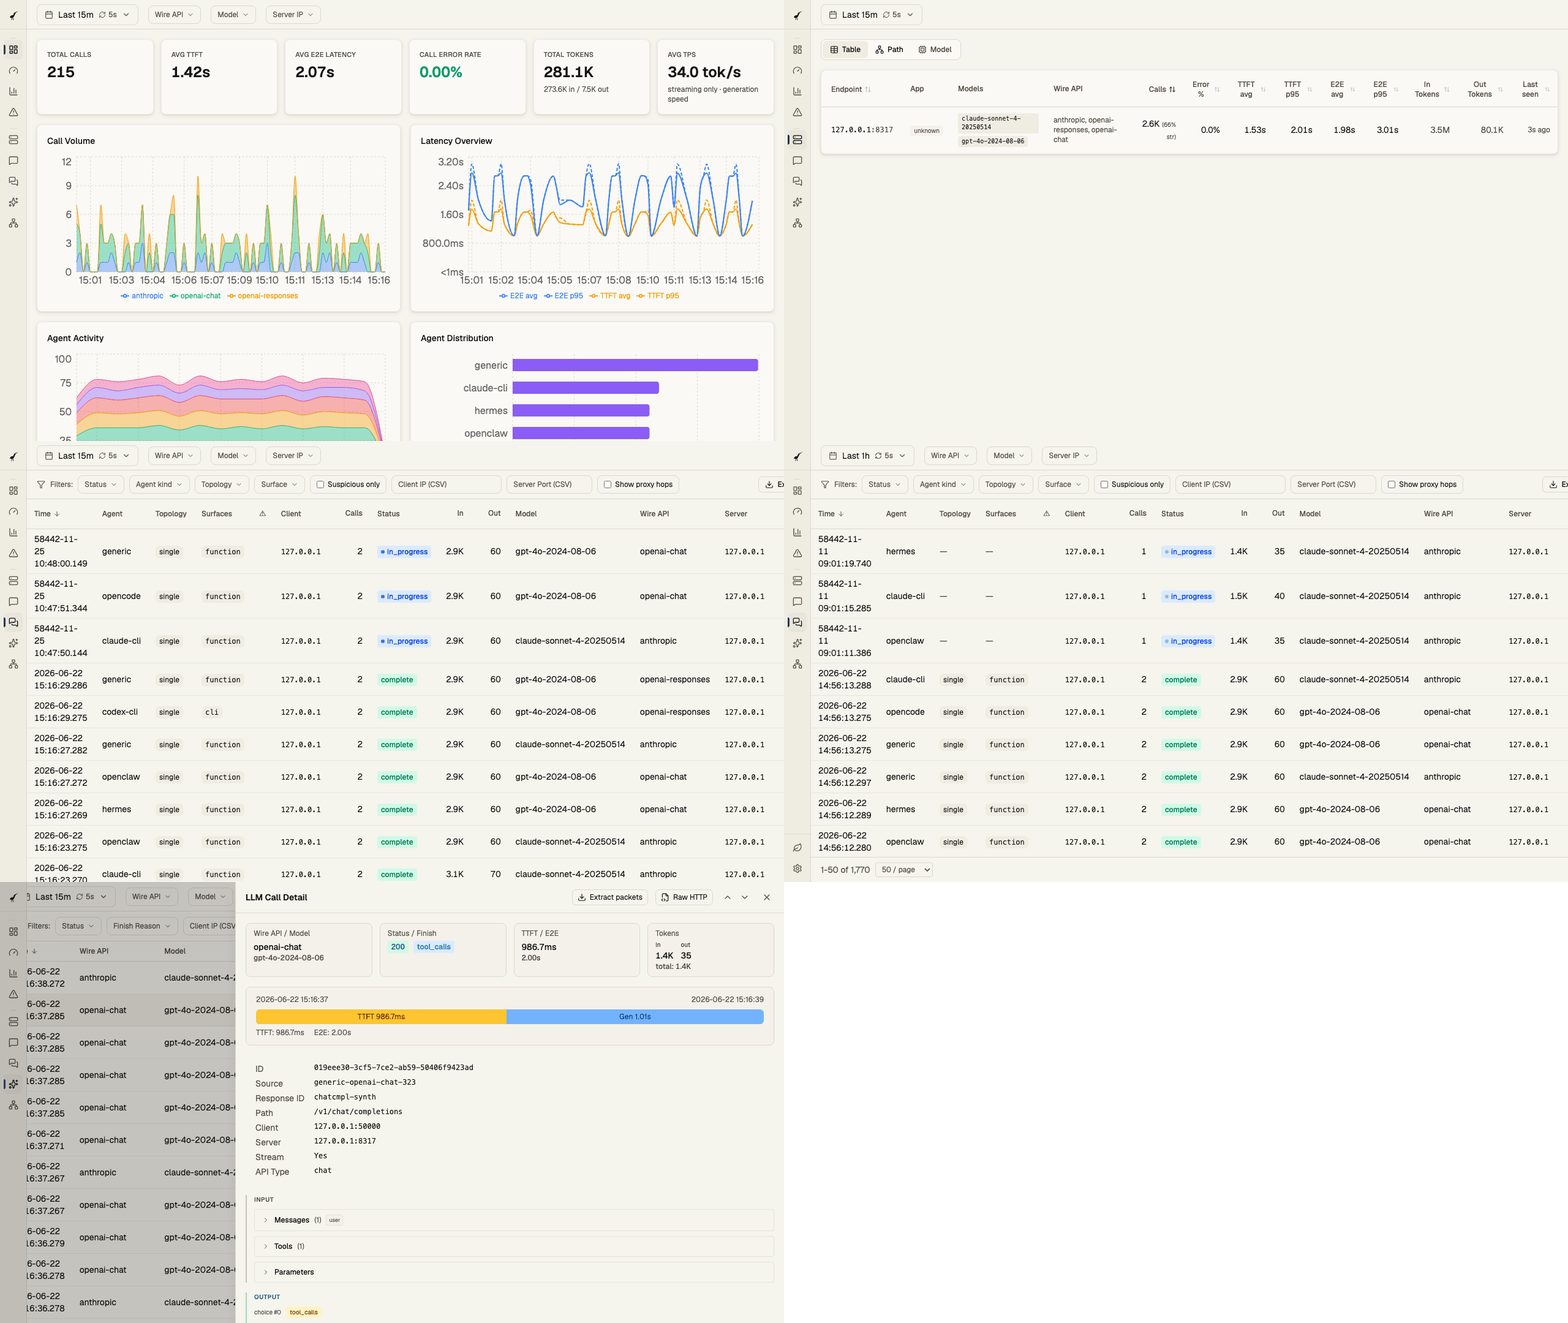
Heron live dashboard — real-time LLM traffic reconstructed off the wire: total calls, TTFT, E2E latency, error rate, token throughput, call volume by API, latency percentiles, and agent activity/distribution

One command. Live TTFT, latency, throughput, error rate, and per-agent mix — reconstructed straight off the wire. Try it now ↓

--- ## 30-Second Quick Start No live capture needed. No privileges. Just a `.pcap` with LLM traffic. ```bash # Install (Linux/macOS, user-local, no sudo) curl -fsSL https://raw.githubusercontent.com/Netis/heron/main/install.sh \ | INSTALL_DIR="$HOME/.local" sh # Replay a pcap — no privileges needed heron --pcap-file capture.pcap --no-retention ``` Open to see your agent turns, timelines, and metrics. After a pcap finishes replaying, the process keeps the API/console available so you can browse — press Ctrl+C to exit, or pass `--exit-after-drain` for batch/CI use that exits as soon as the pipeline drains. > **No pcap handy?** The repo ships fixtures in [`testdata/pcaps/`](testdata/pcaps/) — replay any of them. > **Have a live interface?** Run `heron -i eth0` (needs `CAP_NET_RAW` on Linux — see [install docs](docs/install.md)). Grant it once with `sudo setcap cap_net_raw,cap_net_admin=eip ~/.local/bin/heron` so no sudo is needed at runtime. > **On Linux?** An experimental on-host [eBPF source](docs/design/02-capture.md#ebpf-ssl-uprobe-capture-linux-experimental) reads TLS-encrypted traffic as plaintext at the in-process `SSL_read`/`SSL_write` boundary, attributed per process — opt-in, built behind the `ebpf` cargo feature, needs `CAP_BPF`. > Heron sees **plaintext** HTTP. Install it where the traffic is already > decrypted: on the inference host, behind the TLS terminator, or fed from a > trusted packet source. --- ## What Makes Heron Different
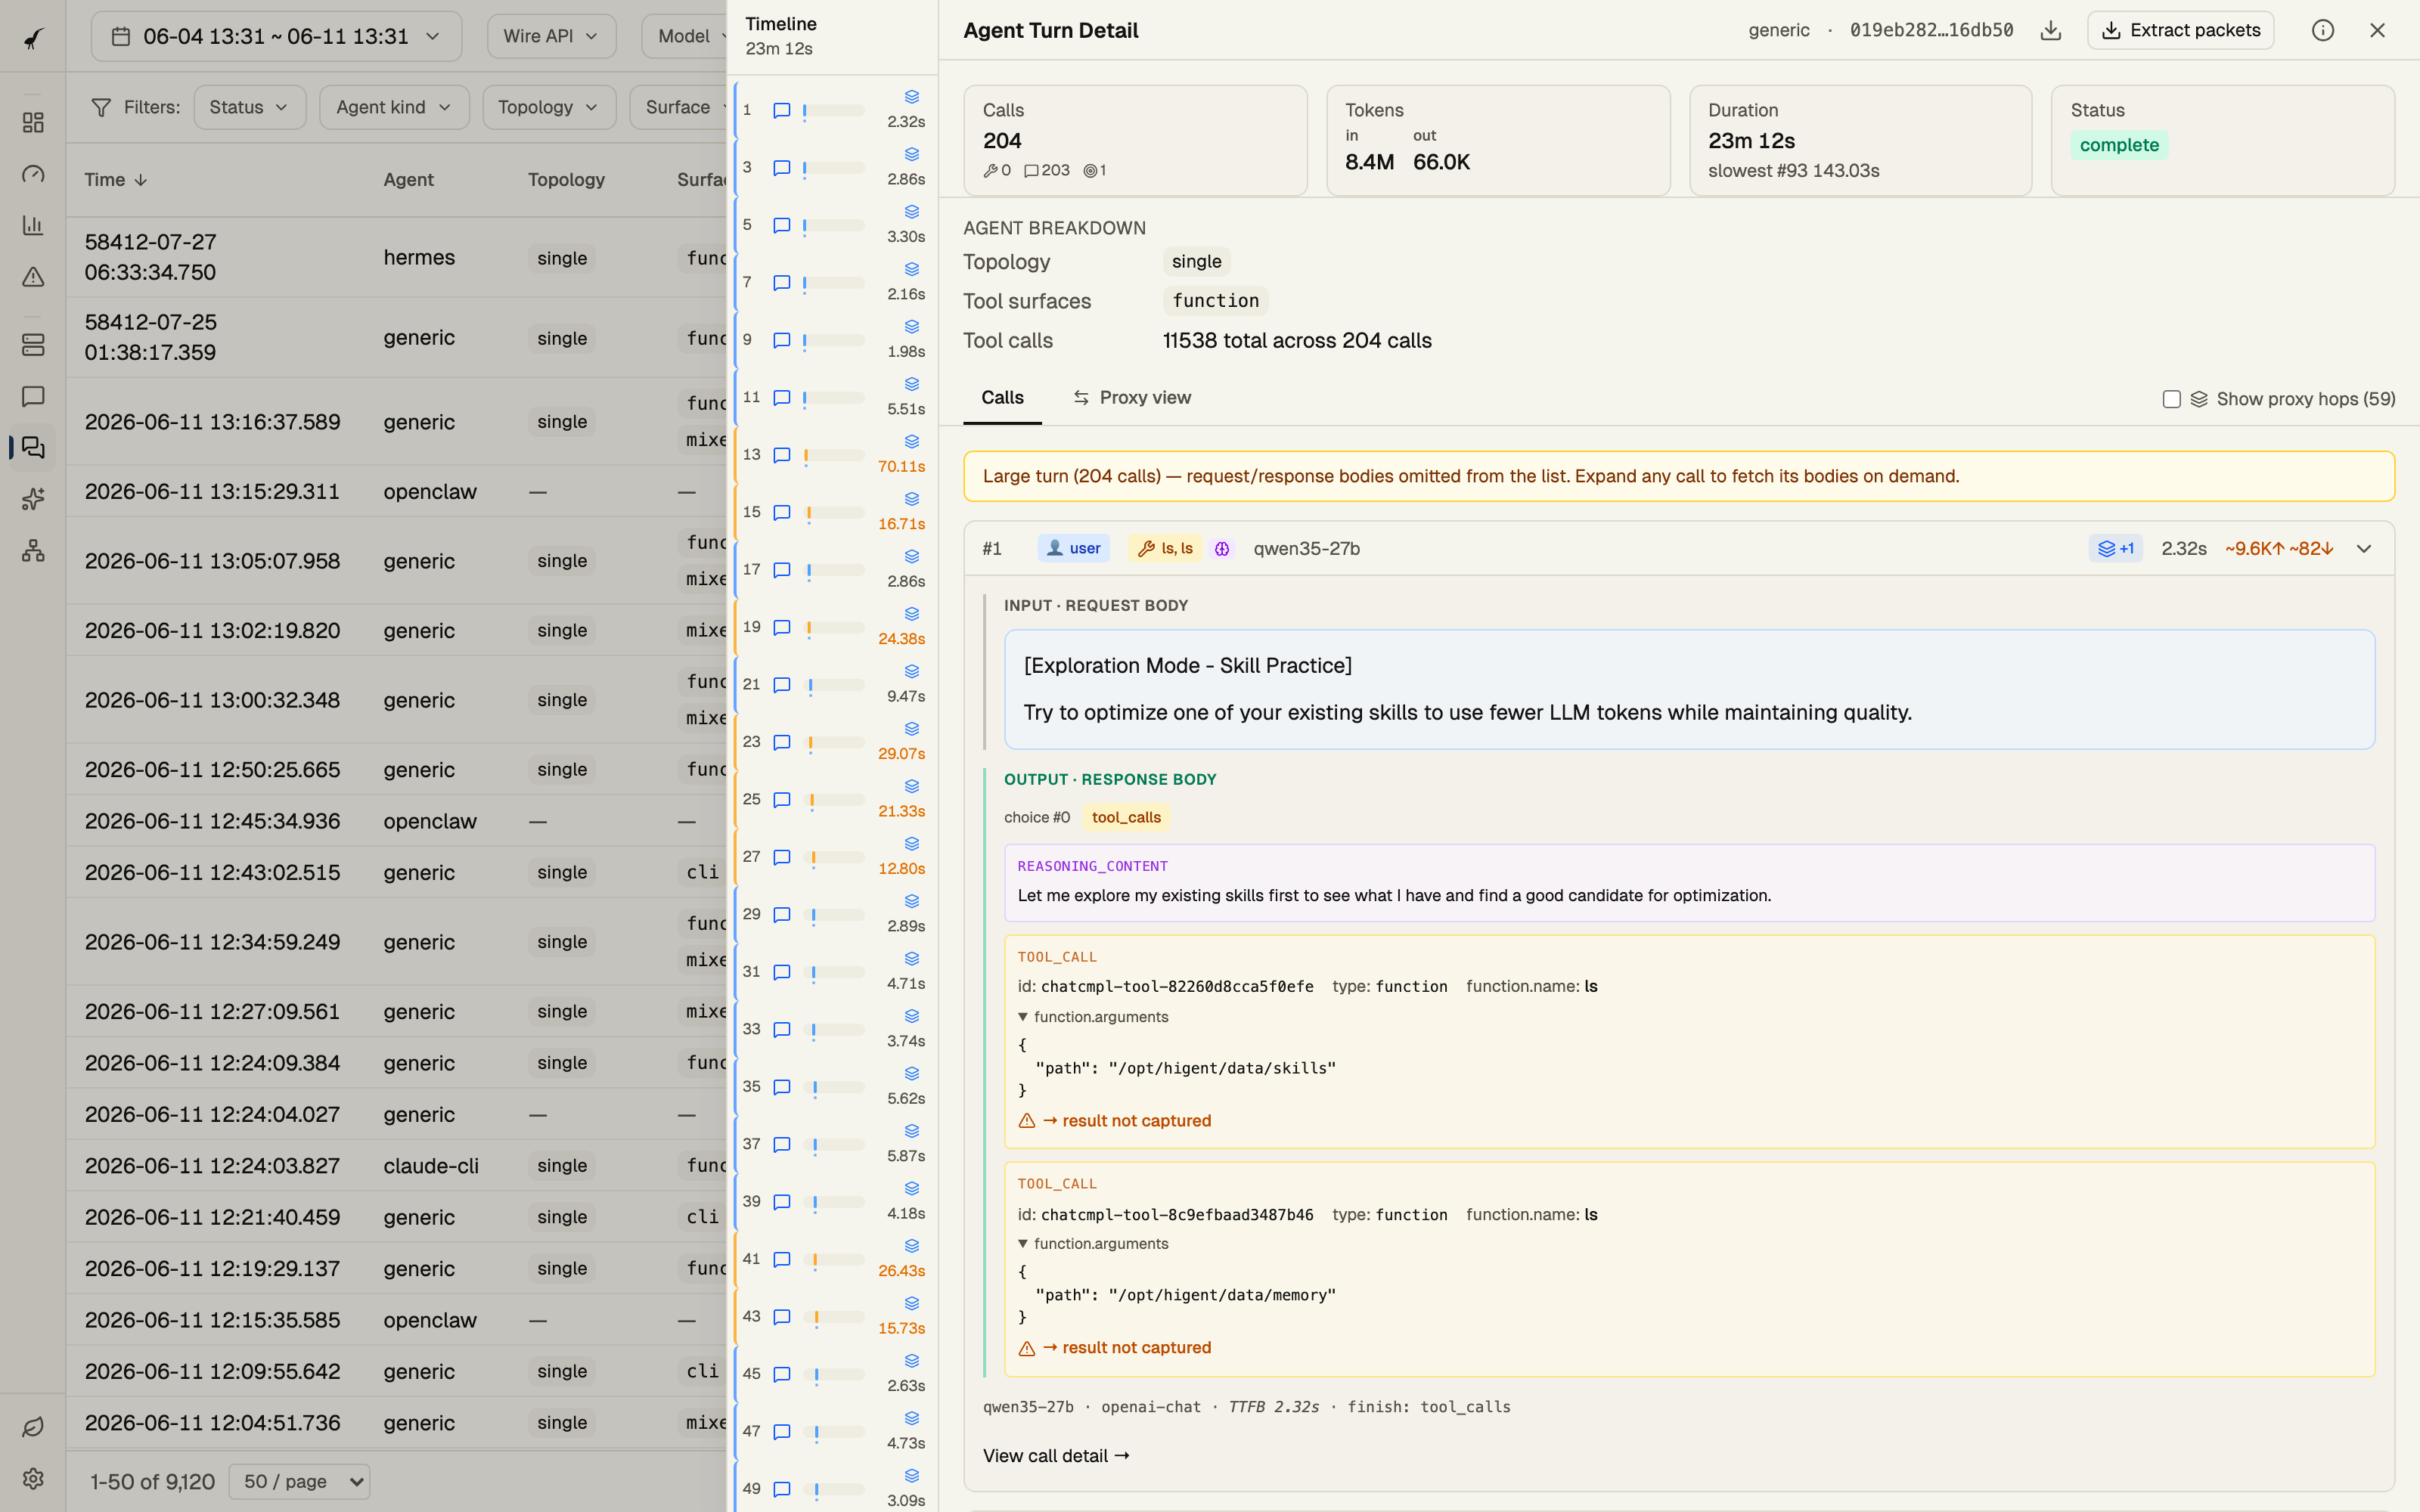
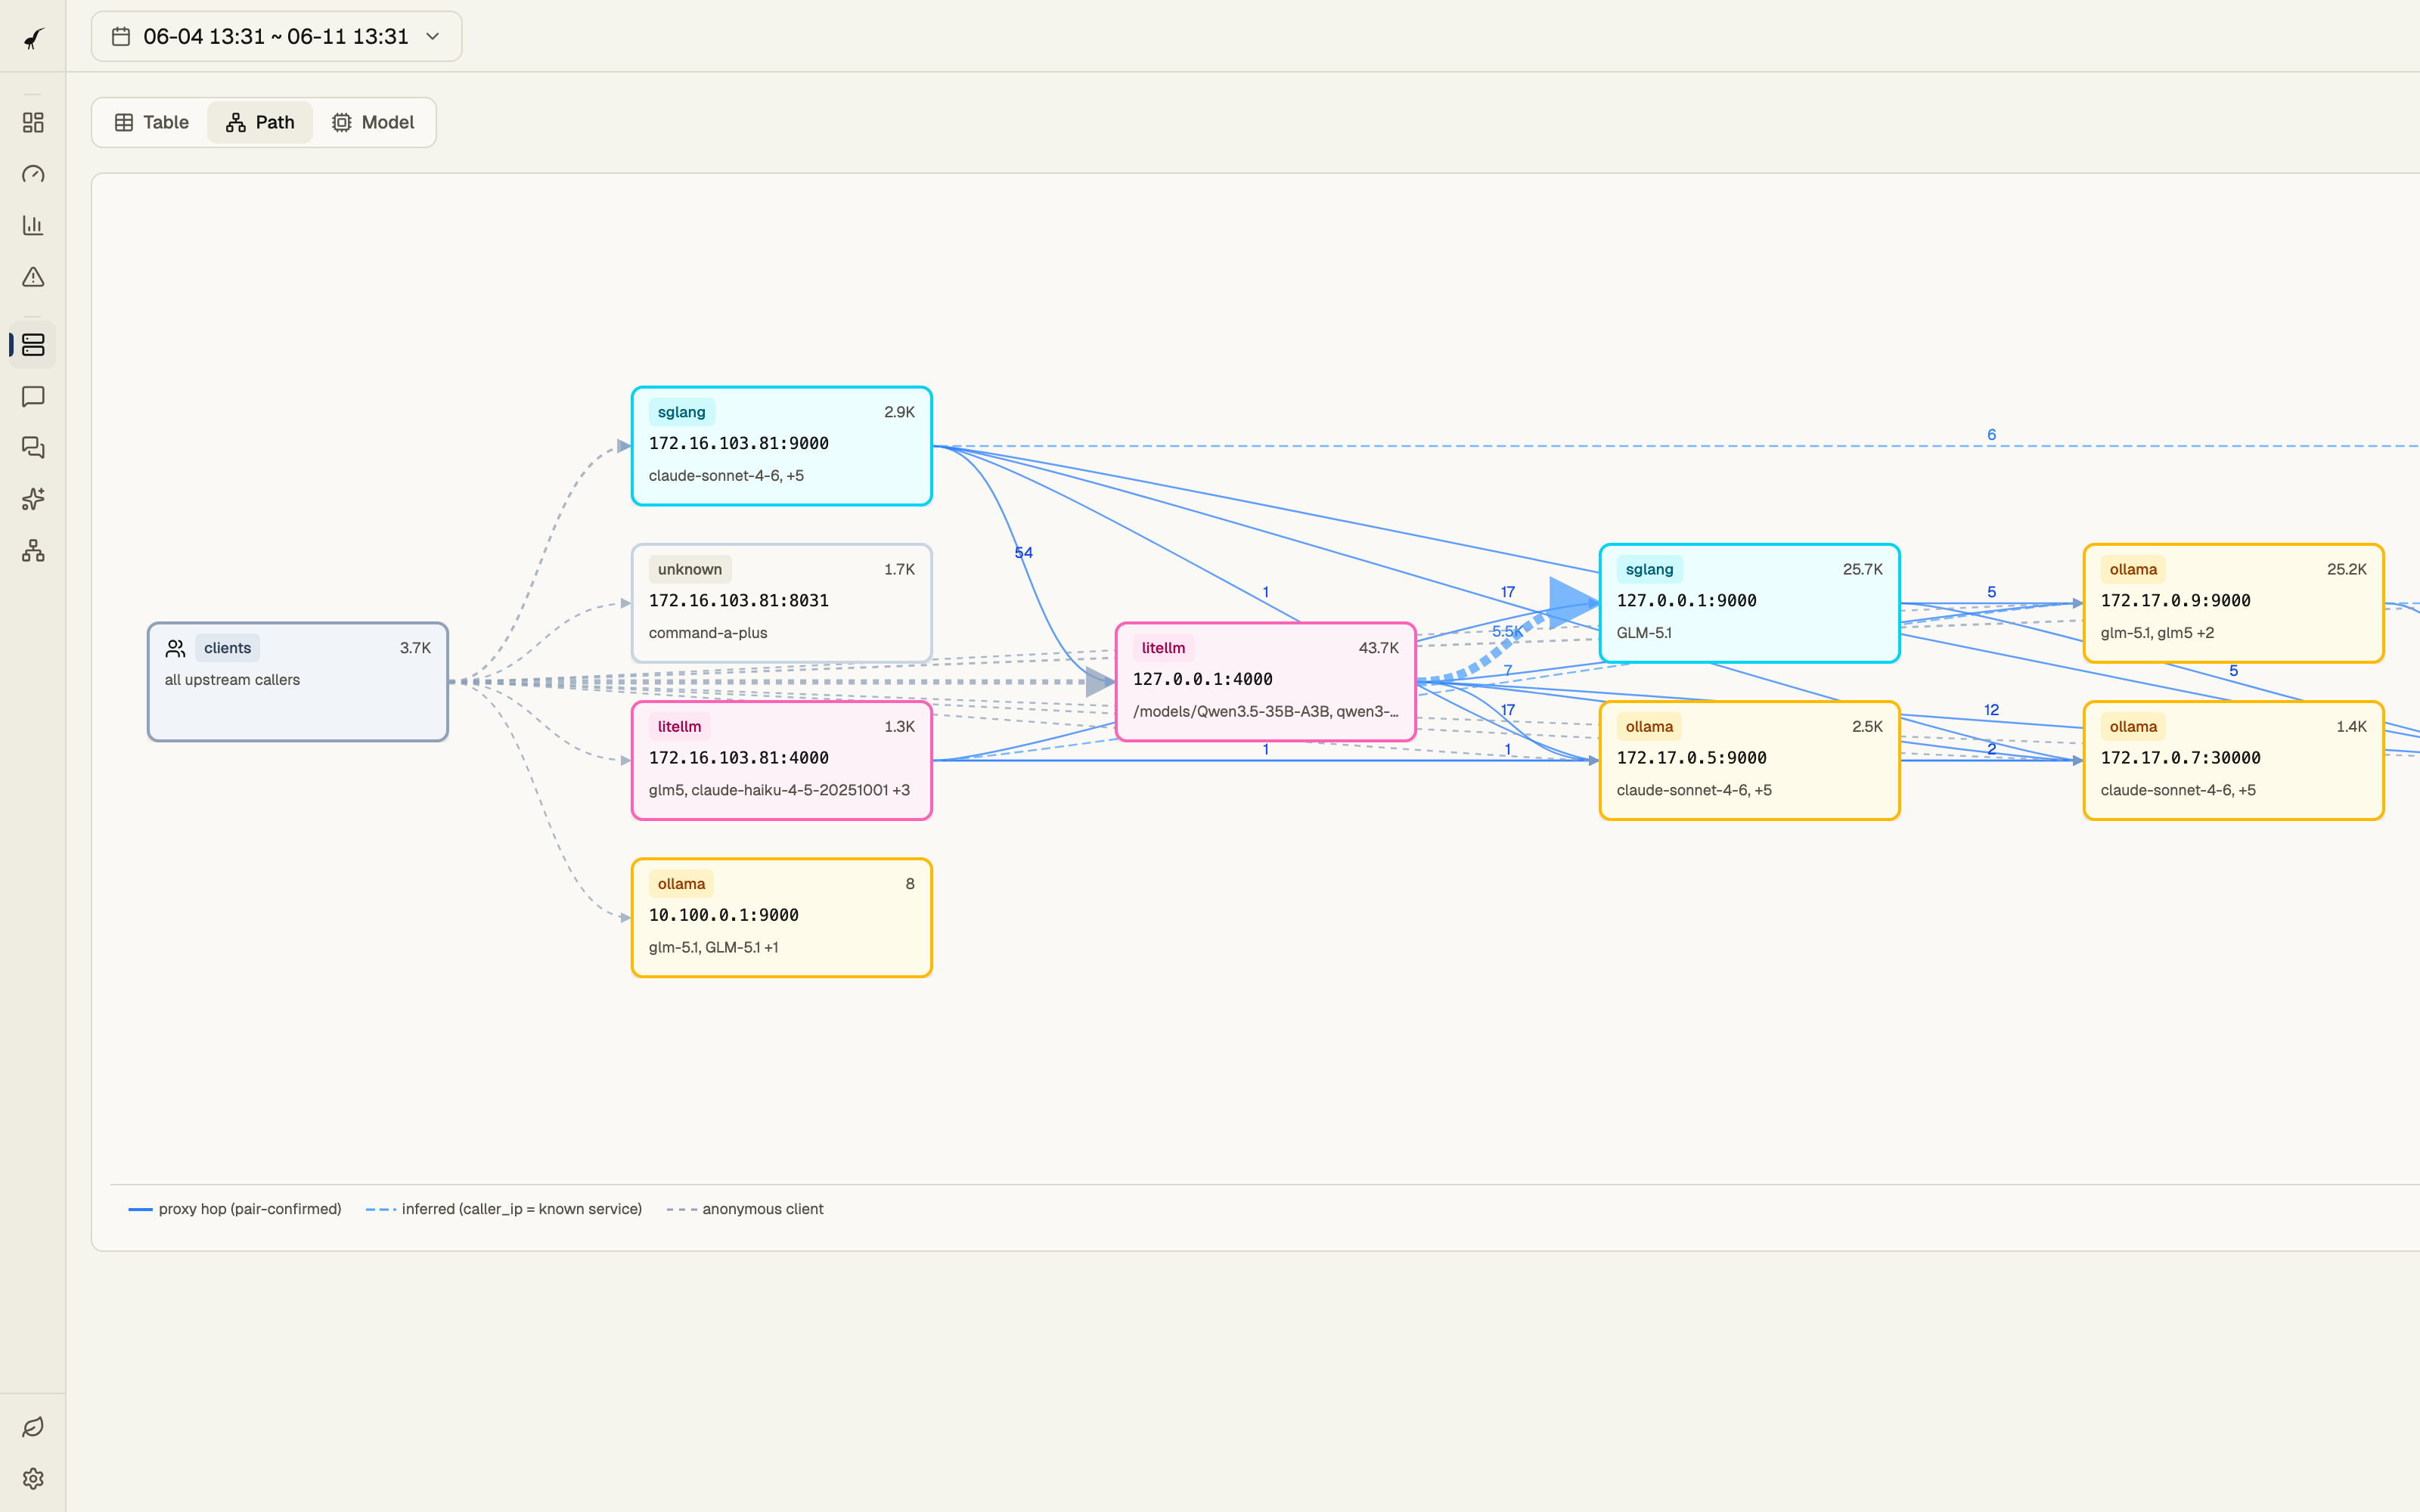
### Agent Turn Reconstruction Stitches multi-call agent interactions (planner → tool → result → next tool) into **single addressable turns** — see the full agent narrative, not raw HTTP calls. Named profiles for **Claude Code** and **OpenAI Codex CLI**, plus a generic profile for everything else. Agent turn timeline — 247 calls in one turn ### Service Topology See your inference fleet as a **directed graph**: clients → litellm proxies → vLLM / SGLang backends, edge thickness scaled by turn count. Heron classifies what each endpoint serves — vLLM, SGLang, Ollama, llama.cpp, LiteLLM — **from the bytes on the wire**, not from configuration. Service topology graph ### SFT Trajectory Export **Turn real agent traffic into fine-tuning data.** Export any turn or session as OpenAI-style `messages` JSONL — tool calls, results, and reasoning preserved, arguments rehydrated to objects. One click from a turn's detail view, or batch-export from the Agent Turns list with the current filter (time · agent kind · model · wire API). Anthropic and OpenAI-chat wire formats today; unsupported formats are reported and skipped, not failed.
--- ## Why Not an SDK / Proxy / OpenTelemetry? | Approach | In request path | Needs client changes | Sees full bodies | Reconstructs turns | Exports SFT data | | --- | :---: | :---: | :---: | :---: | :---: | | SDK instrumentation | yes | every client | yes | manual | manual | | Reverse proxy (LiteLLM …) | yes | re-point clients | yes | per-call only | no | | OpenTelemetry from server | yes | server must emit | partial | if tagged | no | | **Heron** | **no** | **none** | **yes**¹ | **automatic** | **one click** | ¹ TLS-terminated traffic — Heron sees plaintext HTTP. Install it where the traffic is already decrypted (inference host, behind the TLS terminator, or fed by [cloud-probe](https://github.com/Netis/cloud-probe) from a SPAN/TAP point), or use the experimental Linux [eBPF source](docs/design/02-capture.md#ebpf-ssl-uprobe-capture-linux-experimental) for on-host encrypted capture with per-process attribution. The trade-off is honest: you give up cross-cluster client tracing. You get a single passive evidence chain that can't break the call when the observer fails, requires zero cooperation from the workloads being observed, and **assembles the agent narrative for you** instead of leaving you to join calls into turns in your data warehouse. --- ## Architecture ``` NIC / .pcap file / cloud-probe (ZMQ) / eBPF SSL uprobes │ ▼ capture → flow dispatcher (hash by 5-tuple) │ ▼ N parallel workers: HTTP/SSE parse → wire-API detection → semantic extraction │ ▼ turn tracker + metrics aggregator + storage sink │ ▼ DuckDB ─── REST API ─── React console (localhost:3000) ``` Same connection's packets always land on the same worker, so parsing state is local and lock-free. Multiple independent pipelines can run side-by-side — e.g. low-latency local capture isolated from bursty cloud-probe ingress. The pipeline never sits in the request path, so the observer can fail without breaking the calls being observed. > **On-host eBPF capture (Linux, experimental).** Packet capture only sees > plaintext. Heron's eBPF SSL-uprobe source lifts that on Linux: it hooks > `SSL_read` / `SSL_write` in-process and reads **TLS-encrypted** LLM calls as > plaintext *on the host that makes them* — no proxy, no TLS terminator, no SDK, > never in the request path — and stamps every call with its **owning process** > (pid · command · executable). It covers dynamically-linked OpenSSL/BoringSSL > (Python `openai`/`anthropic` SDKs, curl, Node, most CLIs) and statically-linked, > symbol-stripped BoringSSL single-executable runtimes (Claude Code's and > opencode's Bun binaries, located by byte-signature offset). It follows the > agent CLIs' frequent npm self-updates (re-attaches across the rotated binary > inode) and reaches already-running sessions (via `/proc//exe`) without a > restart. Opt-in — built behind the `ebpf` cargo feature; needs `CAP_BPF` + > kernel BTF. See [eBPF capture](docs/design/02-capture.md#ebpf-ssl-uprobe-capture-linux-experimental). --- ## What's in the Box
Ingress sources - **libpcap** on a live interface - **Replay** from `.pcap` files (any speed) - **ZMQ** from [cloud-probe](https://github.com/Netis/cloud-probe) for hosts you can't install on directly - **eBPF SSL uprobes** (Linux · opt-in) — hook `SSL_read` / `SSL_write` in-process to read TLS-encrypted traffic as plaintext on the host that makes the calls, with no proxy or TLS terminator, and stamp every call with its owning process. Covers dynamically-linked OpenSSL/BoringSSL and statically-linked, symbol-stripped BoringSSL runtimes (Claude Code's / opencode's Bun). Built behind the `ebpf` cargo feature, needs `CAP_BPF`. See [eBPF capture](docs/design/02-capture.md#ebpf-ssl-uprobe-capture-linux-experimental).
Wire-API decoders - OpenAI Chat Completions (`/v1/chat/completions`) - OpenAI Responses (`/v1/responses`) - Anthropic Messages (`/v1/messages`) - Gemini AI Studio (`generativelanguage.googleapis.com`) Covers OpenAI direct, Azure OpenAI, Anthropic, AWS Bedrock / GCP Vertex (Anthropic wire), Google Gemini, and any OpenAI-compatible server — vLLM, SGLang, Ollama, llama.cpp, LM Studio, etc. Every LLM call is also captured with structured request/response **and** the raw body, so stalled tool calls, malformed prompts, and unexpected token counts are evidence on the page, not behind a re-run.
Console pages `http://localhost:3000` — Overview · Performance · Usage · Errors · Services (table / path / model) · Agent Turns · Agent Sessions · LLM Calls (with full request/response drill-down) · Raw HTTP · Pipeline Health. Three themes, one toggle: **Kami** (`紙神` — warm washi-paper, the default and what the screenshots show), **Dark** (slate), **Light** (high-contrast). The choice persists per browser; charts, the topology graph, and the timeline gantt all re-theme with it.
Metrics - **Agent layer:** turn count and duration distribution per agent kind, call count per turn, tool-call success rate. - **Call layer:** TTFT · E2E latency · TPOT · token throughput · call rate · active calls · error rate · prompt-cache hit ratio. See the [glossary](docs/glossary.md) for what each means and why.
Storage & distribution - **Storage:** DuckDB (default, embedded, single-file) with per-table retention out of the box, or **ClickHouse** for high-volume columnar analytics (`storage.backend = "clickhouse"`). Pluggable backend trait; PostgreSQL is designed but not yet wired. - **Distribution:** prebuilt static binaries for Linux musl (x86_64 + aarch64) and macOS (Intel + Apple Silicon). The web console is **embedded in the binary** — single artifact, no separate frontend deploy.
--- ## Who It's For | Role | Use case | | --- | --- | | **Agent developers** | Debug stalled tool calls, detect plan-loop / "no submit" failures, see exactly which model+endpoint each turn hit — without modifying the agent or its SDK | | **AI platform / inference ops** | See the real service-to-service topology (clients → litellm → vLLM / SGLang), measure each hop, catch silent model substitutions | | **FinOps & eng managers** | Attribute spend across teams/repos/projects from real turns, not periodic SDK exports that drift | | **Compliance & security** | Capture-once evidence chain of what each agent sent and received, scoped per agent kind and session | | **Model trainers / fine-tuners** | Turn real captured agent runs into SFT datasets — per turn or whole session — without hand-labeling or re-running the agent | --- ## Install & Verify with an AI Agent Running an AI coding agent (Claude Code, Codex, etc.)? Hand it the prompt below and let it do the install + smoke test. It needs only shell access to the target machine. ```text Install and smoke-test Heron (https://github.com/Netis/heron) on this machine: 1. Read the README and docs/install.md to pick the right install path. Use the one-line installer; user-local (no sudo) is fine. 2. Verify the binary: `heron --version` and `heron --help` both work. 3. Smoke-test WITHOUT live capture (no privileges needed): find or fetch a small .pcap with LLM traffic (the repo's testdata/pcaps/ has fixtures), then run `heron --pcap-file --no-retention`. 4. Confirm the API is up: `curl -s http://localhost:3000/api/health` returns healthy, and `curl -s 'http://localhost:3000/api/traces?limit=5'` returns reconstructed traces. 5. (Optional, needs CAP_NET_RAW) for a live test: setcap the binary and run `heron -i `, generate some LLM traffic through the host, then re-check the console at http://localhost:3000. Report the console URL and the trace count you saw. Don't hard-code or commit any host/credential — this repo rejects infra leakage in CI. ``` The last line matters: a `check-leakage.sh` CI gate fails any PR that commits a private IP, plaintext credential, or key — keep your own infra out of anything you push back. --- ## Documentation | Doc | Description | | --- | --- | | [Install](docs/install.md) | One-line installer, systemd, capabilities, uninstall | | [Configure](docs/configure.md) | Pipelines, sources, storage, retention | | [eBPF capture](docs/design/02-capture.md#ebpf-ssl-uprobe-capture-linux-experimental) | On-host TLS capture + process attribution (Linux, opt-in) | | [Architecture](docs/design/01-architecture.md) | Pipeline design and trade-offs | | [Glossary](docs/glossary.md) | What every metric means | | [Filing issues](docs/filing-issues.md) | How issues are triaged + how to file one an agent can pick up | | [Mission](docs/mission.md) | Long-arc vision | | [Changelog](CHANGELOG.md) | Release history | --- ## Roadmap The current surface is the foundation layer (Ops use cases). On the way: - **Storage** — PostgreSQL backend (ClickHouse shipped in v0.5.0; PG schema already designed) - **Wire APIs** — more provider-specific extensions (Bedrock variants, Vertex non-Anthropic, etc.) See [docs/mission.md](docs/mission.md) for the full ladder. --- ## Contributing Bug reports and PRs welcome. Before opening a PR, run: ```bash just build all # single binary with embedded console just quality all # rust fmt + clippy + ts lint + tsc just test all # cargo test (all crates) ``` Run `just help` for the full menu. Design docs under [docs/design/](docs/design/) describe the per-module contract — read the relevant one before changing anything load-bearing. > **Build via `just build all`, not a bare `cargo build`.** The web console is > embedded behind the non-default `console` cargo feature; a raw > `cargo build --release` yields a working API with a **blank console**. If you > invoke cargo directly, run `bun run build` in `console/` first and pass > `--features console` — see [docs/install.md → Building from source](docs/install.md#building-from-source). --- ## License [Apache 2.0](LICENSE).