
 \n",
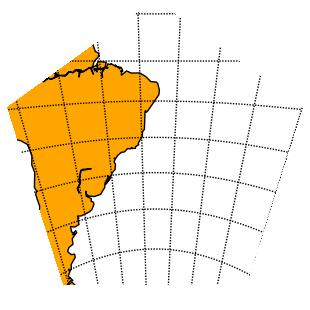
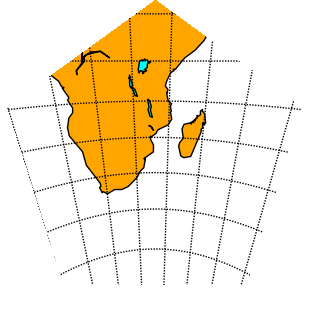
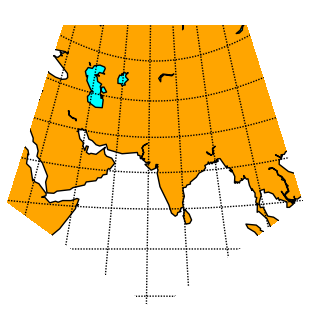
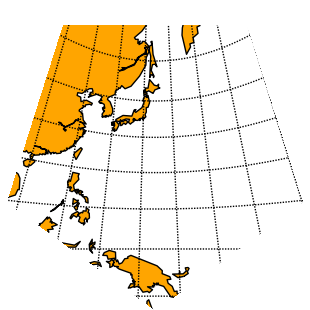
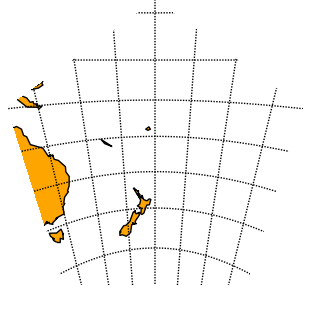
"Carlos A. Furiti proposes very nice ready-to-print dodecadron pseudoglobes from http://www.progonos.com/furuti/MapProj/Normal/ProjPoly/Foldout/Dodecahedron/dodecahedron.html
\n",
"Carlos A. Furiti proposes very nice ready-to-print dodecadron pseudoglobes from http://www.progonos.com/furuti/MapProj/Normal/ProjPoly/Foldout/Dodecahedron/dodecahedron.html 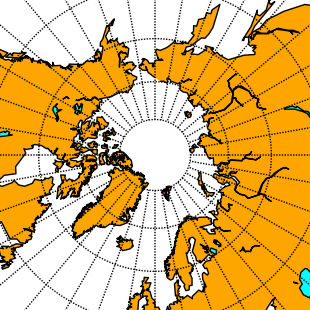


 "
],
"metadata": {},
"output_type": "display_data",
"text": [
"
"
],
"metadata": {},
"output_type": "display_data",
"text": [
"\n", "Geometry formulaes are taken from http://mathworld.wolfram.com/Pentagon.html**\n", "\n", "
 "
]
},
{
"cell_type": "code",
"collapsed": false,
"input": [
"# Image size is 310x310 when figsize is set to 4,4 and axis not drawn\n",
"s0=155\n",
"c0=155\n",
"\n",
"c1 = np.cos(2*np.pi/5) * s0\n",
"c2 = np.cos(np.pi/5) * s0 + 4 # +4 to get small ovelays\n",
"s1 = np.sin(2*np.pi/5) * s0\n",
"s2 = np.sin(4*np.pi/5) * s0"
],
"language": "python",
"metadata": {},
"outputs": [],
"prompt_number": 3
},
{
"cell_type": "markdown",
"metadata": {},
"source": [
"**Define a function to apply pentagon masking**"
]
},
{
"cell_type": "code",
"collapsed": false,
"input": [
"import PIL\n",
"import PIL.ImageDraw\n",
"\n",
"def mask_pentagon(filein, fileout, up=True):\n",
"\n",
" # read image as RGB and add alpha (transparency)\n",
" im = PIL.Image.open(filein).convert(\"RGBA\")\n",
"\n",
" # convert to numpy (for convenience)\n",
" imArray = np.asarray(im)\n",
"\n",
" # create mask from polygon ABCDE A(0,1), B(s1,c1), C(s2,-c2), D(-s2,-c2), E(-s1,c1)\n",
" # image origin (0,0) is located at upper left corner with positive coordinates downward\n",
" if up:\n",
" A=(s0, 0)\n",
" B=(s0+s1, c0-c1)\n",
" C=(s0+s2, c0+c2)\n",
" D=(s0-s2, c0+c2)\n",
" E=(s0-s1, c0-c1)\n",
" else:\n",
" A=(s0-s2, c0-c2)\n",
" B=(s0+s2, c0-c2)\n",
" C=(s0+s1, c0+c1)\n",
" D=(s0, c0+c0)\n",
" E=(s0-s1, c0+c1) \n",
" polygon = [A,B,C,D,E] \n",
" maskIm = PIL.Image.new('L', (imArray.shape[1], imArray.shape[0]), 0)\n",
" PIL.ImageDraw.Draw(maskIm).polygon(polygon, outline=1, fill=1)\n",
" mask = np.array(maskIm)\n",
"\n",
" # assemble new image (uint8: 0-255)\n",
" newImArray = np.empty(imArray.shape,dtype='uint8')\n",
"\n",
" # colors (three first columns, RGB)\n",
" newImArray[:,:,:3] = imArray[:,:,:3]\n",
"\n",
" # transparency (4th column)\n",
" newImArray[:,:,3] = mask*255\n",
"\n",
" # back to Image from numpy\n",
" newIm = PIL.Image.fromarray(newImArray, \"RGBA\")\n",
" newIm.save(fileout)"
],
"language": "python",
"metadata": {},
"outputs": [],
"prompt_number": 4
},
{
"cell_type": "markdown",
"metadata": {},
"source": [
"**Process the mask over the 12 different images**"
]
},
{
"cell_type": "code",
"collapsed": false,
"input": [
"for i in range(1,13) :\n",
" mask_pentagon(\"map_%02d\"%i + \".png\", \"pentagon_map_%02d\"%i + \".png\", up=i%2)"
],
"language": "python",
"metadata": {},
"outputs": [],
"prompt_number": 5
},
{
"cell_type": "markdown",
"metadata": {},
"source": [
"**Display pentagon images inline**"
]
},
{
"cell_type": "code",
"collapsed": false,
"input": [
"imagesList=''.join( [\"
"
]
},
{
"cell_type": "code",
"collapsed": false,
"input": [
"# Image size is 310x310 when figsize is set to 4,4 and axis not drawn\n",
"s0=155\n",
"c0=155\n",
"\n",
"c1 = np.cos(2*np.pi/5) * s0\n",
"c2 = np.cos(np.pi/5) * s0 + 4 # +4 to get small ovelays\n",
"s1 = np.sin(2*np.pi/5) * s0\n",
"s2 = np.sin(4*np.pi/5) * s0"
],
"language": "python",
"metadata": {},
"outputs": [],
"prompt_number": 3
},
{
"cell_type": "markdown",
"metadata": {},
"source": [
"**Define a function to apply pentagon masking**"
]
},
{
"cell_type": "code",
"collapsed": false,
"input": [
"import PIL\n",
"import PIL.ImageDraw\n",
"\n",
"def mask_pentagon(filein, fileout, up=True):\n",
"\n",
" # read image as RGB and add alpha (transparency)\n",
" im = PIL.Image.open(filein).convert(\"RGBA\")\n",
"\n",
" # convert to numpy (for convenience)\n",
" imArray = np.asarray(im)\n",
"\n",
" # create mask from polygon ABCDE A(0,1), B(s1,c1), C(s2,-c2), D(-s2,-c2), E(-s1,c1)\n",
" # image origin (0,0) is located at upper left corner with positive coordinates downward\n",
" if up:\n",
" A=(s0, 0)\n",
" B=(s0+s1, c0-c1)\n",
" C=(s0+s2, c0+c2)\n",
" D=(s0-s2, c0+c2)\n",
" E=(s0-s1, c0-c1)\n",
" else:\n",
" A=(s0-s2, c0-c2)\n",
" B=(s0+s2, c0-c2)\n",
" C=(s0+s1, c0+c1)\n",
" D=(s0, c0+c0)\n",
" E=(s0-s1, c0+c1) \n",
" polygon = [A,B,C,D,E] \n",
" maskIm = PIL.Image.new('L', (imArray.shape[1], imArray.shape[0]), 0)\n",
" PIL.ImageDraw.Draw(maskIm).polygon(polygon, outline=1, fill=1)\n",
" mask = np.array(maskIm)\n",
"\n",
" # assemble new image (uint8: 0-255)\n",
" newImArray = np.empty(imArray.shape,dtype='uint8')\n",
"\n",
" # colors (three first columns, RGB)\n",
" newImArray[:,:,:3] = imArray[:,:,:3]\n",
"\n",
" # transparency (4th column)\n",
" newImArray[:,:,3] = mask*255\n",
"\n",
" # back to Image from numpy\n",
" newIm = PIL.Image.fromarray(newImArray, \"RGBA\")\n",
" newIm.save(fileout)"
],
"language": "python",
"metadata": {},
"outputs": [],
"prompt_number": 4
},
{
"cell_type": "markdown",
"metadata": {},
"source": [
"**Process the mask over the 12 different images**"
]
},
{
"cell_type": "code",
"collapsed": false,
"input": [
"for i in range(1,13) :\n",
" mask_pentagon(\"map_%02d\"%i + \".png\", \"pentagon_map_%02d\"%i + \".png\", up=i%2)"
],
"language": "python",
"metadata": {},
"outputs": [],
"prompt_number": 5
},
{
"cell_type": "markdown",
"metadata": {},
"source": [
"**Display pentagon images inline**"
]
},
{
"cell_type": "code",
"collapsed": false,
"input": [
"imagesList=''.join( [\"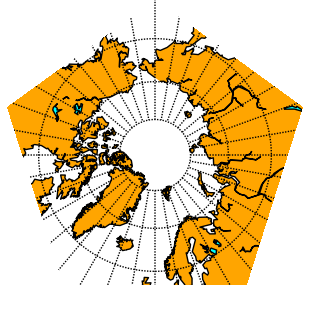


 "
],
"metadata": {},
"output_type": "display_data",
"text": [
"
"
],
"metadata": {},
"output_type": "display_data",
"text": [
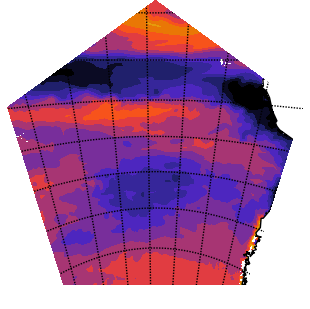
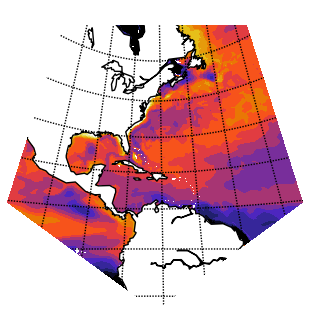
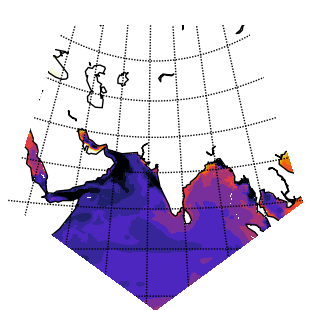
"\n", "Width and height parameters from matplotlib/Basemap API have been choosen empirically to fit correclty over pentagons.\n", "\n", "Open dodecahedron_template.svg with inkscape for checking and edit with a simple editor the svg (xml file) to make changes.\n", "

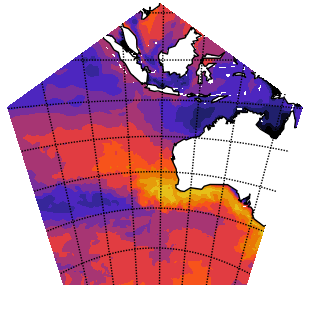
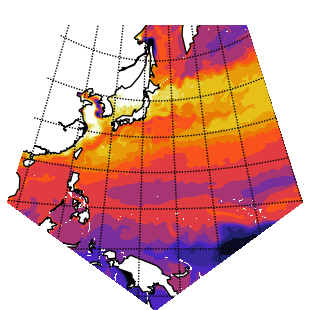
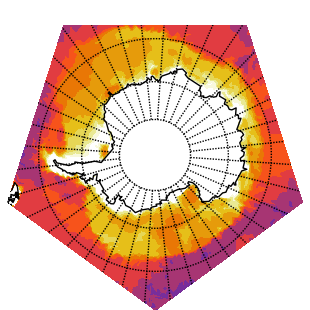
" ] }, { "cell_type": "markdown", "metadata": {}, "source": [ "**Now use our data**" ] }, { "cell_type": "code", "collapsed": false, "input": [ "import netCDF4\n", "\n", "f=netCDF4.Dataset(\"https://prodn.idris.fr/thredds/dodsC/STORE/rfry938/ORCA025-PIS2DIC/MBG/Analyse/TS_MO/surf/ORCA025_1958_2010_1M_PH2_surf.nc\")\n", "print f.variables\n", "lats = f.variables['nav_lat']\n", "lons = f.variables['nav_lon']\n", "times = f.variables['time_counter']\n", "var = f.variables['PH2']\n", "\n", "print var.shape\n", "var.missing_value=0 # correct missing value" ], "language": "python", "metadata": {}, "outputs": [ { "output_type": "stream", "stream": "stdout", "text": [ "OrderedDict([(u'nav_lon',


 "
],
"metadata": {},
"output_type": "display_data",
"text": [
"
"
],
"metadata": {},
"output_type": "display_data",
"text": [
"\n", "Patrick\n", "\n", "
 \n"
]
}
],
"metadata": {}
}
]
}
\n"
]
}
],
"metadata": {}
}
]
}