 StatLite
[](https://github.com/PVRLabs/statlite/releases)
[](go.mod)
[](docs/integrations.md)
[](https://github.com/PVRLabs/statlite/actions/workflows/test.yml)
[](LICENSE)
StatLite provides lightweight, self-hosted application monitoring for apps running
on VPSs and small servers. One Go binary polls multiple applications, stores
metrics locally in SQLite, and provides built-in historical
charts, without requiring Prometheus or Grafana.
🌐 [Website](https://pvrlabs.xyz/statlite) · 👀 [Interactive demo](https://pvrlabs.xyz/statlite/demo.html)
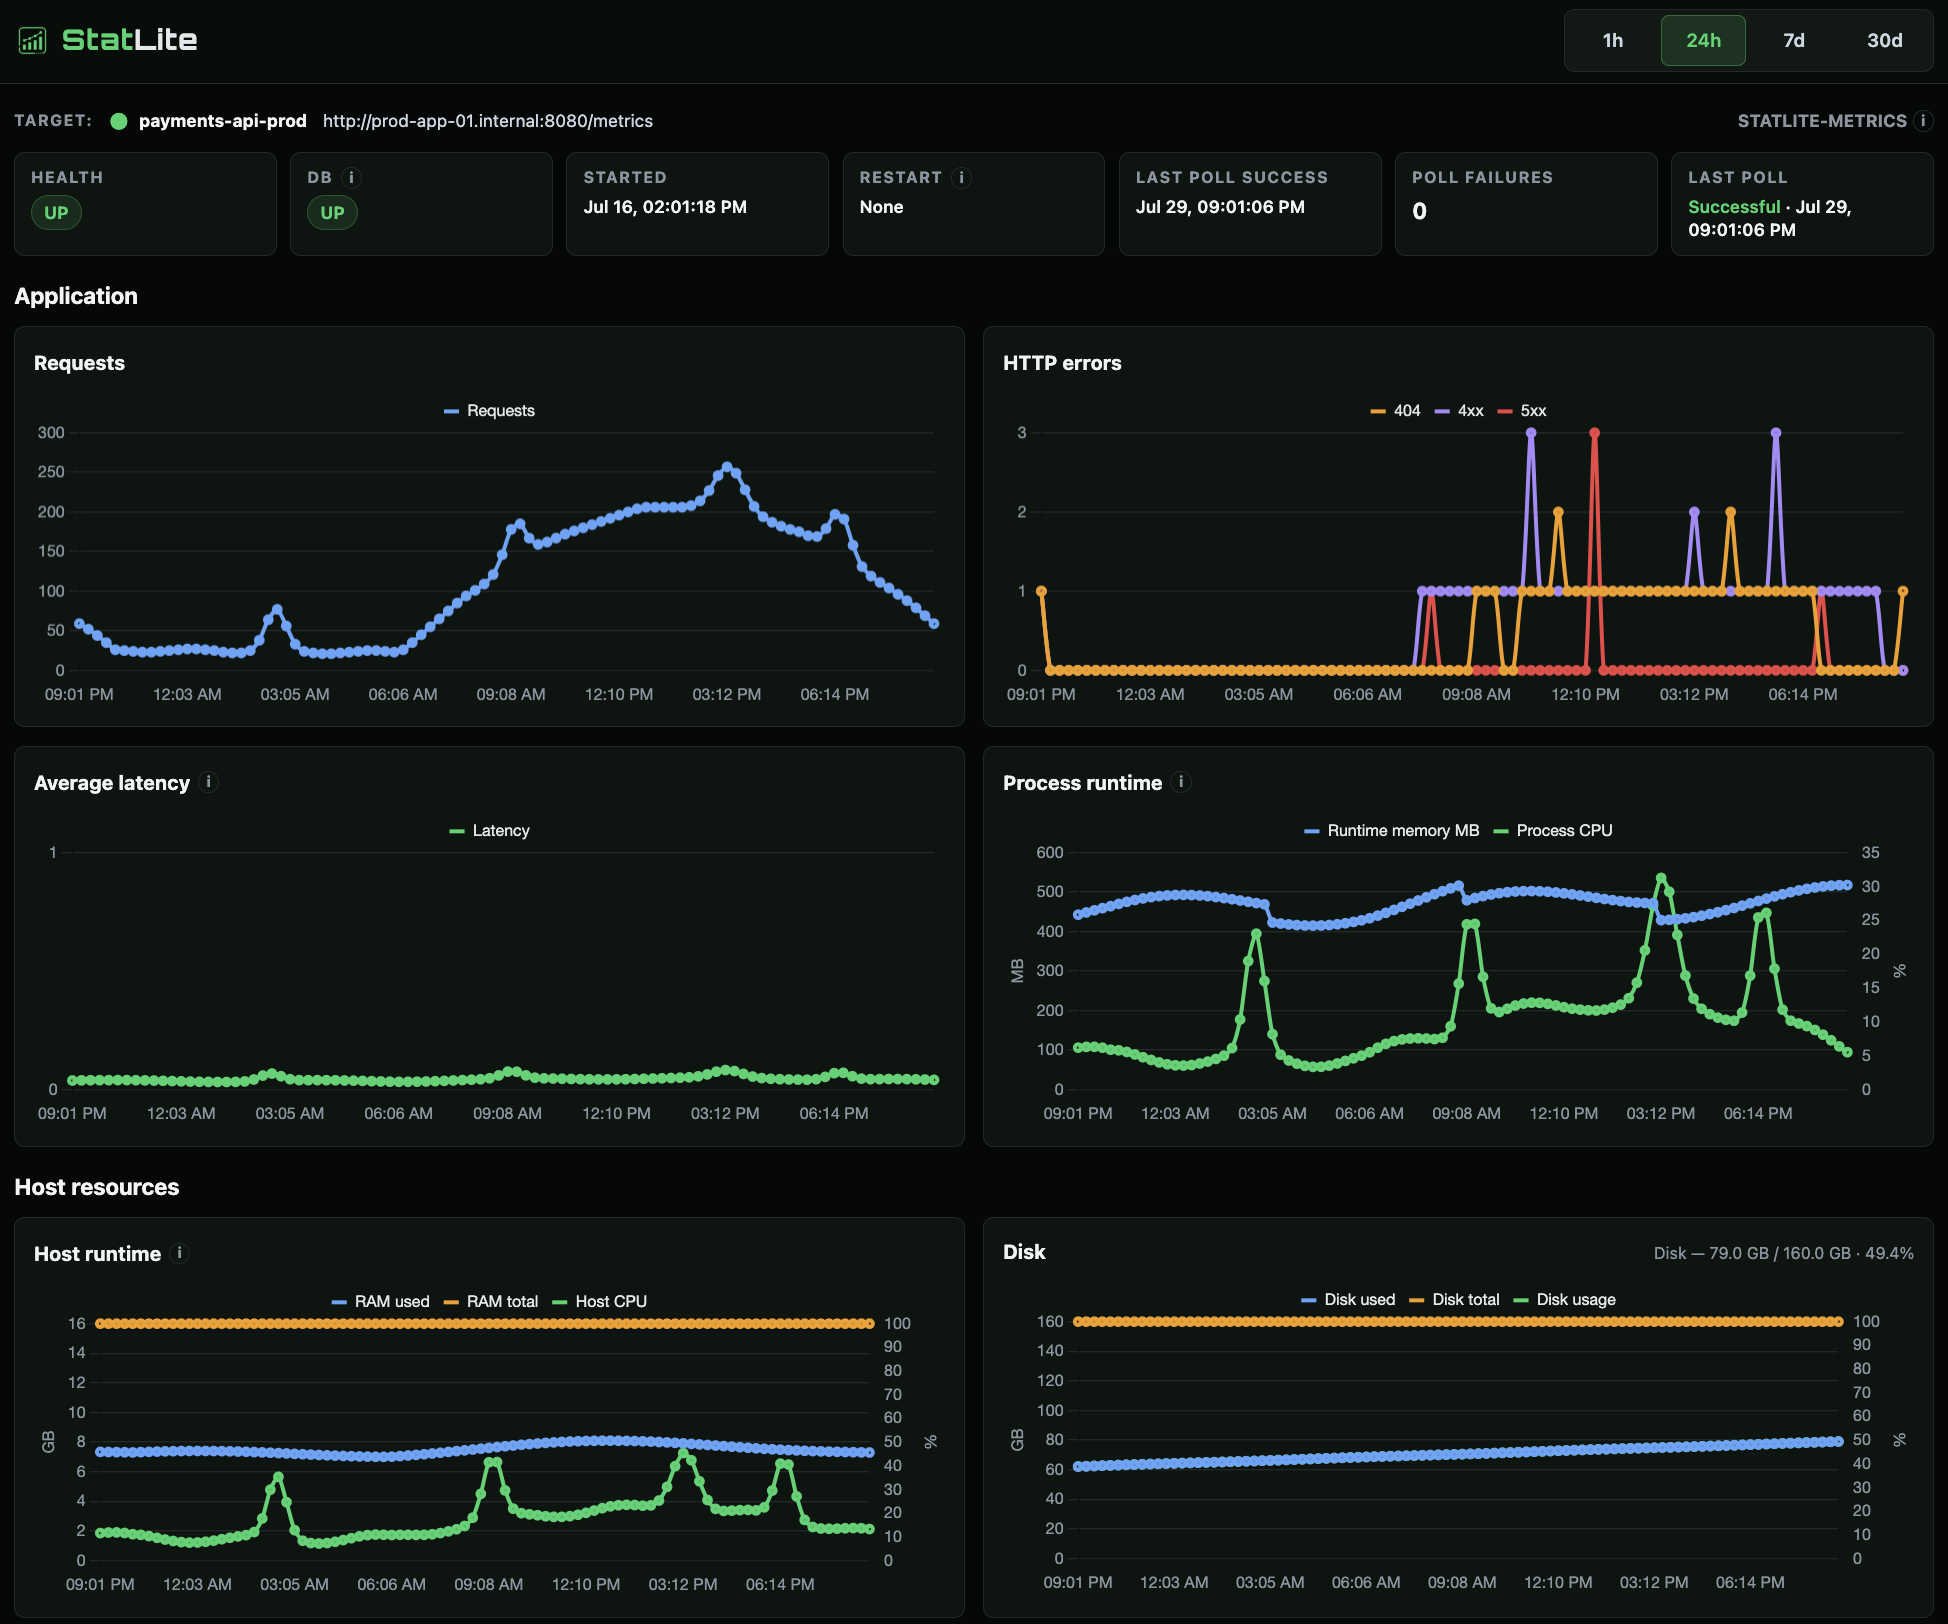
Main application dashboard for the Spring target.
StatLite supports Spring Boot, Quarkus, and Micronaut integrations, and other
applications through [a small, fixed JSON metrics endpoint](docs/statlite-metrics-v1.md).
It collects traffic, latency, CPU, memory, optional application health, and
optional host metrics. Metrics and history stay on your server, without
continuously sending application metrics to a third-party monitoring SaaS.
StatLite is built for [resource-constrained servers](docs/low-resource-monitoring.md).
Low memory, CPU, disk, and operational overhead are treated as product
constraints.
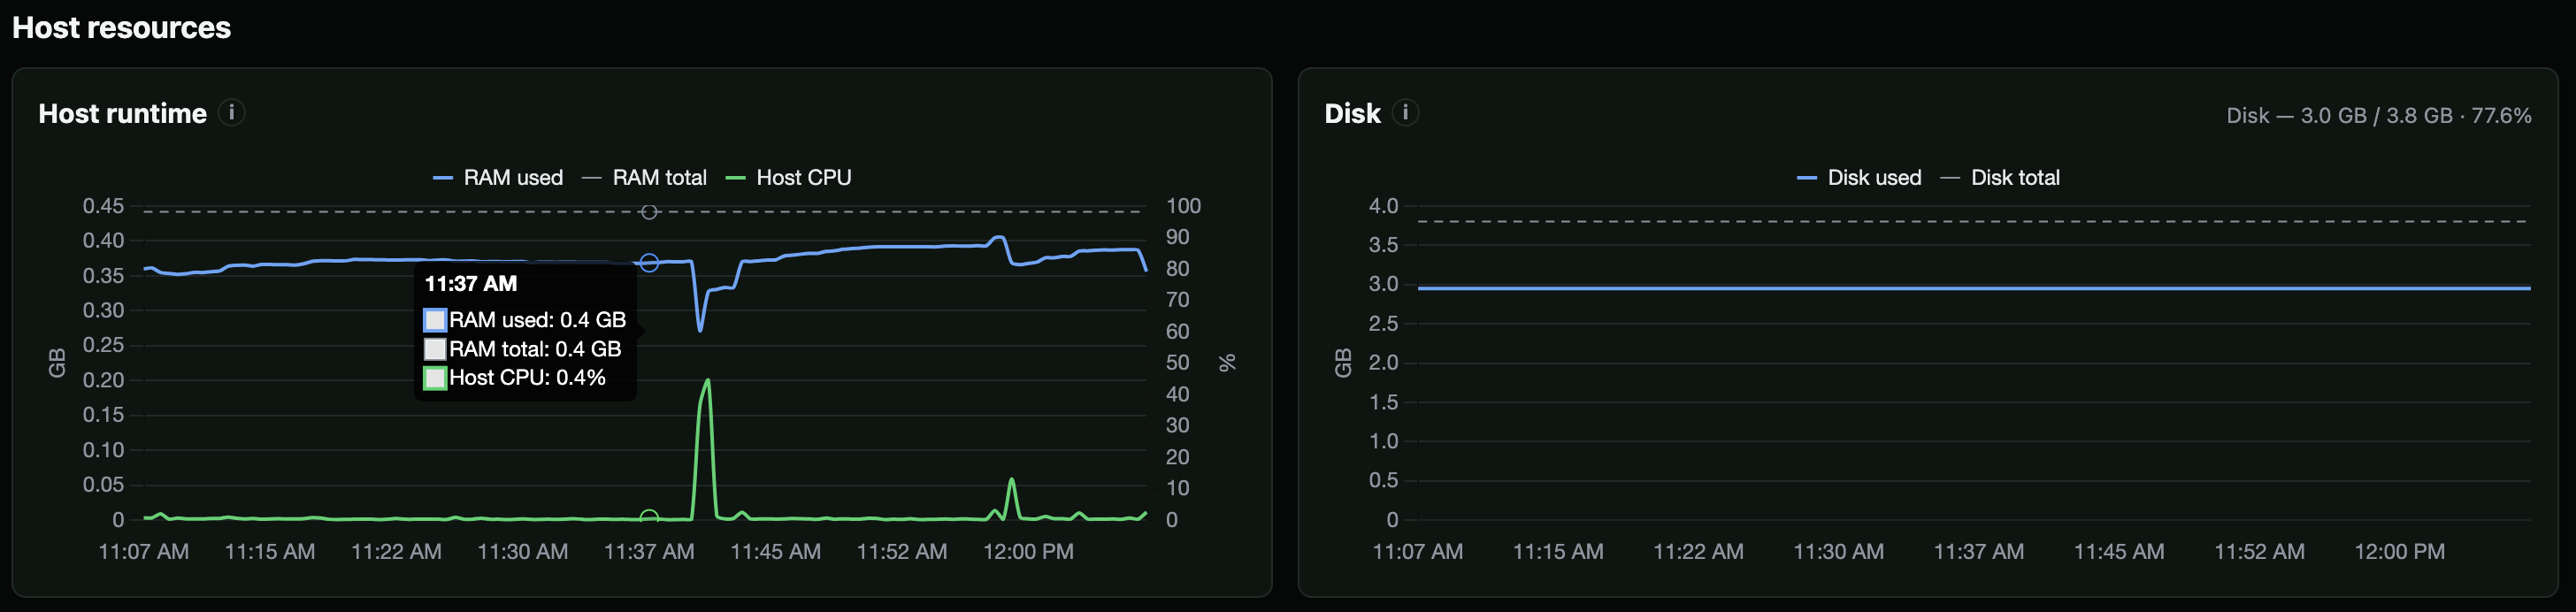
Host resources from the StatLite self-monitoring target.
Learn how to set up [lightweight Spring Boot monitoring without Prometheus and Grafana](https://pvrlabs.xyz/articles/lightweight-spring-boot-monitoring.html).
StatLite focuses on predefined application and host metrics with built-in
charts. See [monitoring options](docs/monitoring-options.md) for capabilities,
limitations, and tradeoffs.
## Install
Install the latest release on macOS or Linux:
```bash
curl -fsSL https://raw.githubusercontent.com/PVRLabs/statlite/main/install.sh | sh
```
Or install with Homebrew:
```bash
brew install pvrlabs/tap/statlite
```
See [Installation](docs/install.md) for supported platforms, custom install
locations, source builds, and server-wide Linux setup.
## Try it
Start StatLite:
```bash
statlite
```
Open . StatLite monitors itself by default, so the
dashboard starts with live data.
## Docker
Alternatively, run StatLite with Docker. Release images are available on
[Docker Hub](https://hub.docker.com/r/pvrlabs/statlite) for `linux/amd64` and
`linux/arm64`.
```bash
docker run --rm \
-p 127.0.0.1:9090:9090 \
docker.io/pvrlabs/statlite:latest
```
Open . To monitor your own application from Docker,
mount a config as described in
[Monitor an application](docs/docker.md#monitor-an-application). In that
container, `127.0.0.1` is StatLite.
See the [Docker guide](docs/docker.md) for persistent storage, container
networking, local builds, and access guidance.
## Configure an application
Spring Boot, Quarkus, and Micronaut need no application code changes. With
the application already running, write a config and start StatLite:
```bash
statlite inspect 'http://localhost:8080' --create-config ./statlite.yaml
statlite
```
Open . `--create-config` writes `./statlite.yaml` only
when that path does not already exist. To append one target to an existing
file, use `--add-to-config` as described in
[Configuration](docs/configuration.md#discover-a-target-with-inspect).
For Quarkus or Micronaut, select the type:
```bash
statlite inspect --type quarkus 'http://localhost:9000' --create-config ./statlite.yaml
statlite inspect --type micronaut 'http://localhost:8080' --create-config ./statlite.yaml
```
Run one of those commands. Each writes `./statlite.yaml` only when that path
is absent.
Express, Django, FastAPI, Go `net/http`, and Gin need a small endpoint in the
application first. Follow the [integration guides](docs/integrate/), then run
`inspect --create-config` against that application's `/statlite/metrics` URL.
Inspection is bounded and read-only unless you pass `--create-config` or
`--add-to-config`. Micronaut requires `--type micronaut`; inspection validates
its supported contract without proving framework identity. For untyped
discovery, start with a base HTTP or HTTPS URL without a query string or
fragment.
A Spring Boot file written by hand has this shape. `server.listen`,
`storage.sqlite_path`, and `polling.interval` are required:
```yaml
server:
listen: "127.0.0.1:9090"
storage:
sqlite_path: "./statlite.sqlite"
polling:
interval: "30s"
targets:
- name: "app"
type: "spring"
url: "http://localhost:8080/actuator"
```
If you already have a configuration, copy only the target entry into its
`targets` list. Then run `statlite` from the directory that contains
`statlite.yaml`.
See [Configuration](docs/configuration.md) for exact endpoint forms, discovery
limits, authentication limitations, all settings, and manual target
configuration. See [`examples/`](examples/) for complete configurations.
> [!IMPORTANT]
> StatLite has no built-in dashboard or API authentication. Review the
> [server and access guidance](docs/configuration.md#server) before exposing it
> remotely.
## Supported metric sources
When a target has no health signal, the dashboard reports whether StatLite is
successfully receiving its metrics without treating reachability as application
health.
- **[Spring Boot](docs/targets/spring.md):** Collects authoritative health
when Actuator health is available and automatically selects a compatible Micrometer Prometheus
endpoint or Actuator JSON for request, JVM, process, and optional host
metrics. Independently usable metrics remain reportable if health retrieval
fails.
- **[Quarkus Micrometer](docs/targets/quarkus.md):** Collects bounded request,
latency, CPU, heap, process, and restart concepts from an exact Prometheus/OpenMetrics endpoint. SmallRye
Health is an optional capability when the application publishes it.
- **[Micronaut Micrometer](docs/targets/micronaut.md):** Collects the existing request,
duration, CPU, heap, process, and restart concepts from an exact configured Prometheus endpoint,
conventionally `/prometheus`. Management health is optional; database health
requires visible JDBC aggregate status.
See the [certified setup](docs/targets/micronaut.md).
- **[StatLite Metrics v1](docs/statlite-metrics-v1.md):** A small, fixed JSON
endpoint that applications in any language or framework can implement. See
the [direct integration guides](docs/integrate/) for FastAPI, Express,
Django, Go `net/http`, and Gin. Those guides provide complete, copyable
application-owned helpers with no StatLite SDK/package or additional
third-party monitoring runtime dependency. Your own StatLite instance polls
the endpoint; the supplied helpers make no outbound requests and send no
telemetry to PVR Labs. They expose aggregate operational metrics, so restrict
endpoint access as described in each guide.
- **StatLite self-monitoring:** StatLite can report its own health, traffic,
process, and host metrics.
Use a `statlite-self` target for host metrics where StatLite runs. Spring
targets can optionally collect host CPU and disk metrics for a remote
application's environment.
## Documentation
- [Installation](docs/install.md)
- [Docker](docs/docker.md)
- [Configuration](docs/configuration.md)
- [External API v1](docs/api.md)
- [Deprecations and compatibility](docs/deprecations.md)
- [Supported integrations](docs/integrations.md)
- [Public integration testing](docs/integration-testing.md)
- [StatLite Metrics integration guides](docs/integrate/)
- [Monitoring on resource-constrained servers](docs/low-resource-monitoring.md)
- [StatLite Metrics v1](docs/statlite-metrics-v1.md)
- [systemd deployment](docs/systemd.md)
- [Product and architecture](docs/product.md)
- [Storage and schema direction](docs/storage.md)
- [Spring Boot guide](https://pvrlabs.xyz/articles/lightweight-spring-boot-monitoring.html)
- [Examples](examples/)
## License
MIT