geoplot.polyplot
-
geoplot.polyplot(df, projection=None, extent=None, figsize=(8, 6), ax=None, edgecolor='black', facecolor='None', **kwargs)¶ Trivially plots whatever geometries are passed to it. Mostly meant to be used in concert with other, more interesting plot types.
Parameters: - df (GeoDataFrame) – The data being plotted.
- projection (geoplot.crs object instance, optional) – A geographic projection. Must be an instance of an object in the
geoplot.crsmodule, e.g.geoplot.crs.PlateCarree(). This parameter is optional: if left unspecified, a pure unprojectedmatplotlibobject will be returned. For more information refer to the tutorial page on projections. - extent (None or (minx, maxx, miny, maxy), optional) – If this parameter is unset
geoplotwill calculate the plot limits. If an extrema tuple is passed, that input will be used instead. - figsize (tuple, optional) – An (x, y) tuple passed to
matplotlib.figurewhich sets the size, in inches, of the resultant plot. Defaults to (8, 6), thematplotlibdefault global. - ax (AxesSubplot or GeoAxesSubplot instance, optional) – A
matplotlib.axes.AxesSubplotorcartopy.mpl.geoaxes.GeoAxesSubplotinstance onto which this plot will be graphed. If this parameter is left undefined a new axis will be created and used instead. - kwargs (dict, optional) – Keyword arguments to be passed to the underlying
matplotlib.patches.Polygoninstances (ref).
Returns: The axis object with the plot on it.
Return type: AxesSubplot or GeoAxesSubplot instance
Examples
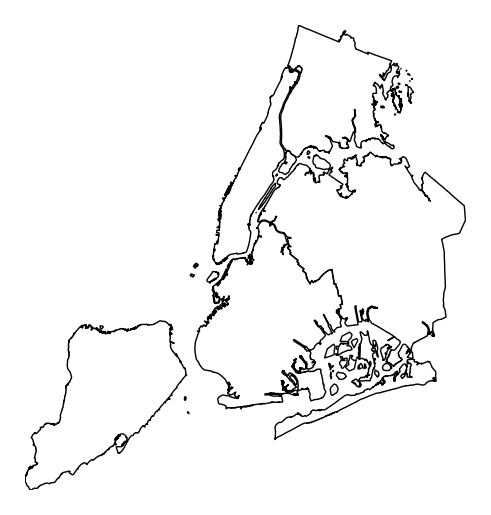
A trivial example can be created with just a geometry and, optionally, a projection.
import geoplot as gplt
import geoplot.crs as gcrs
gplt.polyplot(boroughs, projection=gcrs.AlbersEqualArea())
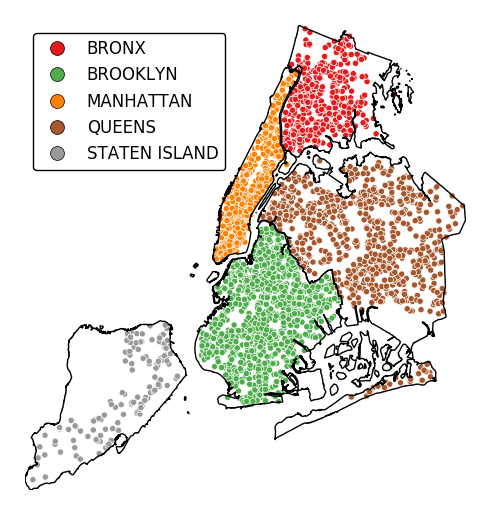
However, note that
polyplotis mainly intended to be used in concert with other plot types.ax = gplt.polyplot(boroughs, projection=gcrs.AlbersEqualArea()) gplt.pointplot(collisions[collisions['BOROUGH'].notnull()], projection=gcrs.AlbersEqualArea(), hue='BOROUGH', categorical=True, legend=True, edgecolor='white', linewidth=0.5, legend_kwargs={'loc': 'upper left'}, ax=ax)
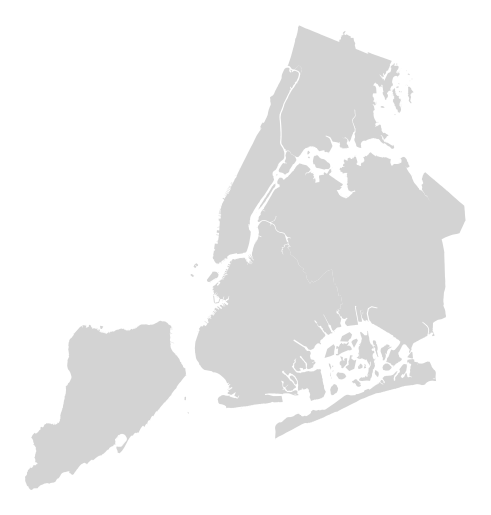
Additional keyword arguments are passed to the underlying
matplotlib.patches.Polygoninstances (ref).ax = gplt.polyplot(boroughs, projection=gcrs.AlbersEqualArea(), linewidth=0, facecolor='lightgray')