# geoplot: geospatial data visualization
[](https://github.com/conda-forge/geoplot-feedstock)    [](https://zenodo.org/record/3475569)
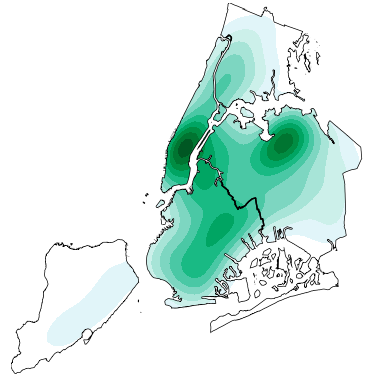
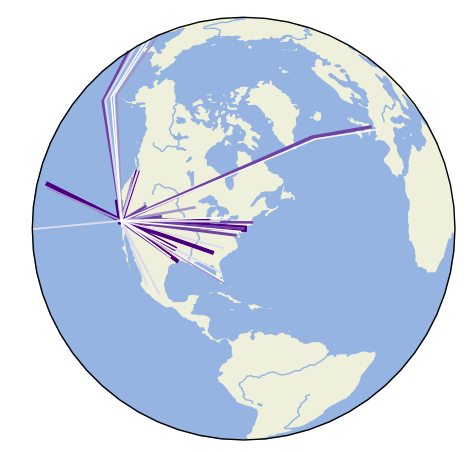
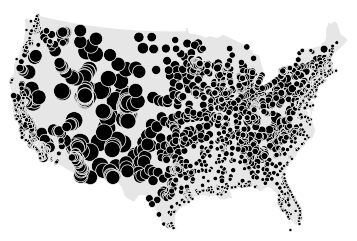
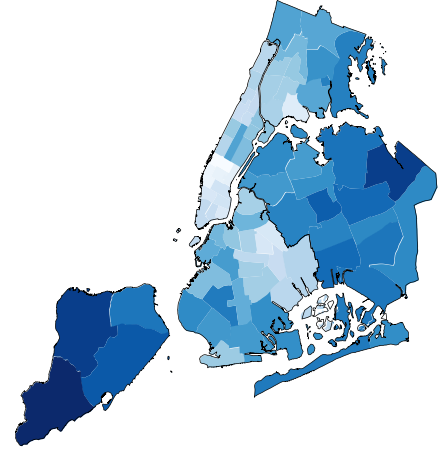
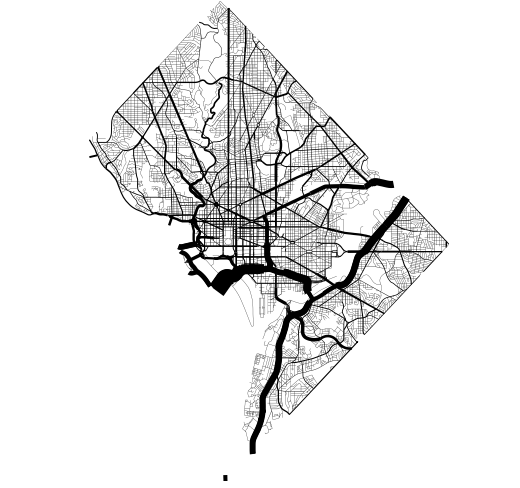 `geoplot` is a high-level Python geospatial plotting library. It's an extension to `cartopy` and `matplotlib` which makes mapping easy: like `seaborn` for geospatial. It comes with the following features:
* **High-level plotting API**: geoplot is cartographic plotting for the 90% of use cases. All of the standard-bearermaps that you’ve probably seen in your geography textbook are easily accessible.
* **Native projection support**: The most fundamental peculiarity of geospatial plotting is projection: how do you unroll a sphere onto a flat surface (a map) in an accurate way? The answer depends on what you’re trying to depict. `geoplot` provides these options.
* **Compatibility with `matplotlib`**: While `matplotlib` is not a good fit for working with geospatial data directly, it’s a format that’s well-incorporated by other tools.
Installation is simple with `conda install geoplot -c conda-forge`. [See the documentation for help getting started](https://residentmario.github.io/geoplot/index.html).
----
Author note: `geoplot` is currently in a **maintenence** state. I will continue to provide bugfixes and investigate user-reported issues on a best-effort basis, but do not expect to see any new library features anytime soon.
`geoplot` is a high-level Python geospatial plotting library. It's an extension to `cartopy` and `matplotlib` which makes mapping easy: like `seaborn` for geospatial. It comes with the following features:
* **High-level plotting API**: geoplot is cartographic plotting for the 90% of use cases. All of the standard-bearermaps that you’ve probably seen in your geography textbook are easily accessible.
* **Native projection support**: The most fundamental peculiarity of geospatial plotting is projection: how do you unroll a sphere onto a flat surface (a map) in an accurate way? The answer depends on what you’re trying to depict. `geoplot` provides these options.
* **Compatibility with `matplotlib`**: While `matplotlib` is not a good fit for working with geospatial data directly, it’s a format that’s well-incorporated by other tools.
Installation is simple with `conda install geoplot -c conda-forge`. [See the documentation for help getting started](https://residentmario.github.io/geoplot/index.html).
----
Author note: `geoplot` is currently in a **maintenence** state. I will continue to provide bugfixes and investigate user-reported issues on a best-effort basis, but do not expect to see any new library features anytime soon.