{
"cells": [
{
"cell_type": "markdown",
"metadata": {},
"source": [
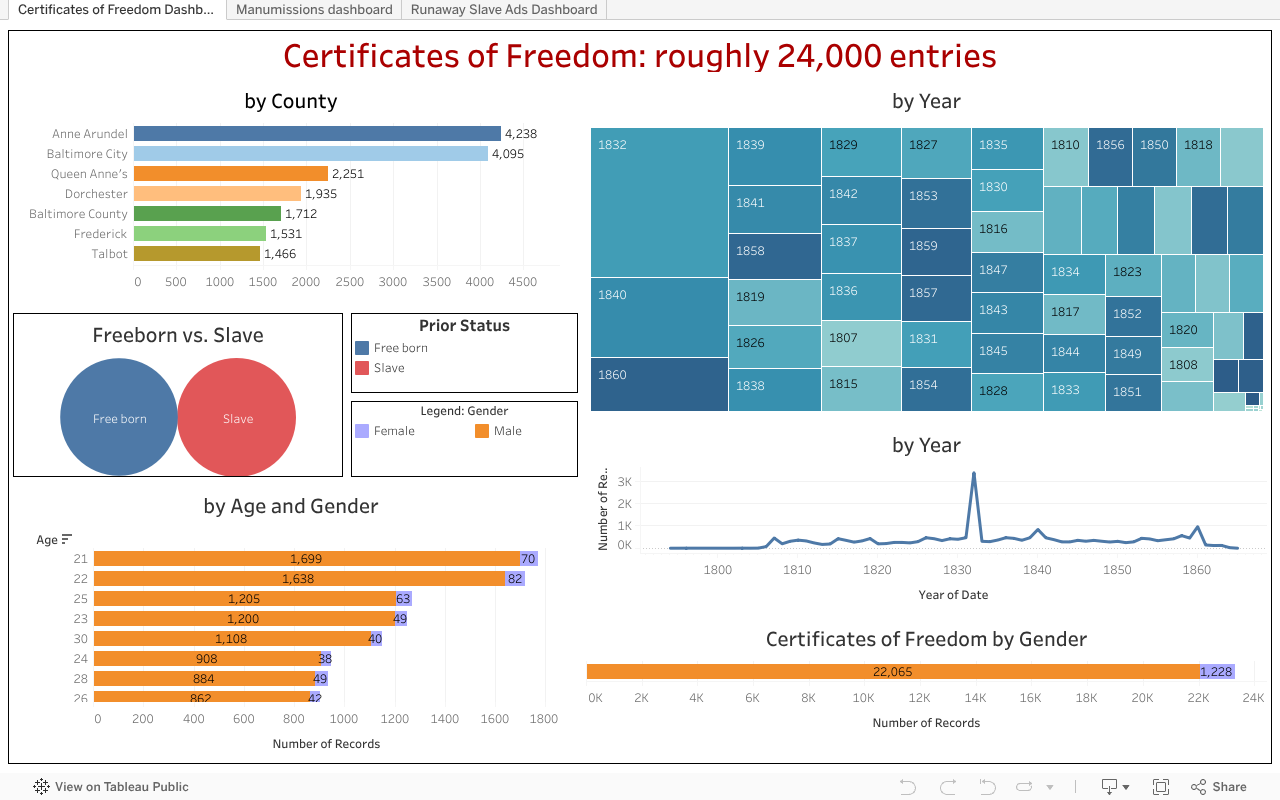
"# Data Visualization\n",
"Is there a high level visualization that captures the outcomes of this module in visual form? Show the work done to create that visualization, or describe the process.\n",
"Then embed that visualization in the notebook. Interactive visualizations that encourage data exploration are best and may be created in Plotly and other such tools."
]
},
{
"cell_type": "code",
"execution_count": 4,
"metadata": {},
"outputs": [
{
"data": {
"text/html": [
"
"
]
},
{
"cell_type": "markdown",
"metadata": {},
"source": [
"# Review\n",
"Briefly review the goals and the different steps taken to acheive them in your notebooks.\n",
"\n",
"# Conclusion\n",
"Discuss whether your goals were met by this analysis.\n",
"List the techniques and expertise the student shall have learnt by studying these notebooks.\n",
"You can also incorporate a student reflection area in the conclusion, where you encourage them to \n",
"consider various dimensions of the analysis and write about what they have learned."
]
},
{
"cell_type": "code",
"execution_count": null,
"metadata": {},
"outputs": [],
"source": []
}
],
"metadata": {
"kernelspec": {
"display_name": "Python 3",
"language": "python",
"name": "python3"
},
"language_info": {
"codemirror_mode": {
"name": "ipython",
"version": 3
},
"file_extension": ".py",
"mimetype": "text/x-python",
"name": "python",
"nbconvert_exporter": "python",
"pygments_lexer": "ipython3",
"version": "3.6.5"
}
},
"nbformat": 4,
"nbformat_minor": 2
}