# ๐Ÿ“ˆ dsh-chartlab English | [็ฎ€ไฝ“ไธญๆ–‡](./README.md) **Data โ†’ Interactive Chart Lab ยท DeepSeek Harness plugin** Turn local data files (`.csv` / `.xlsx` / `.xls`) or DuckDB databases into zoomable, filterable, groupable interactive charts

GitHub stars License MIT Last commit Awesome DSH Plugin

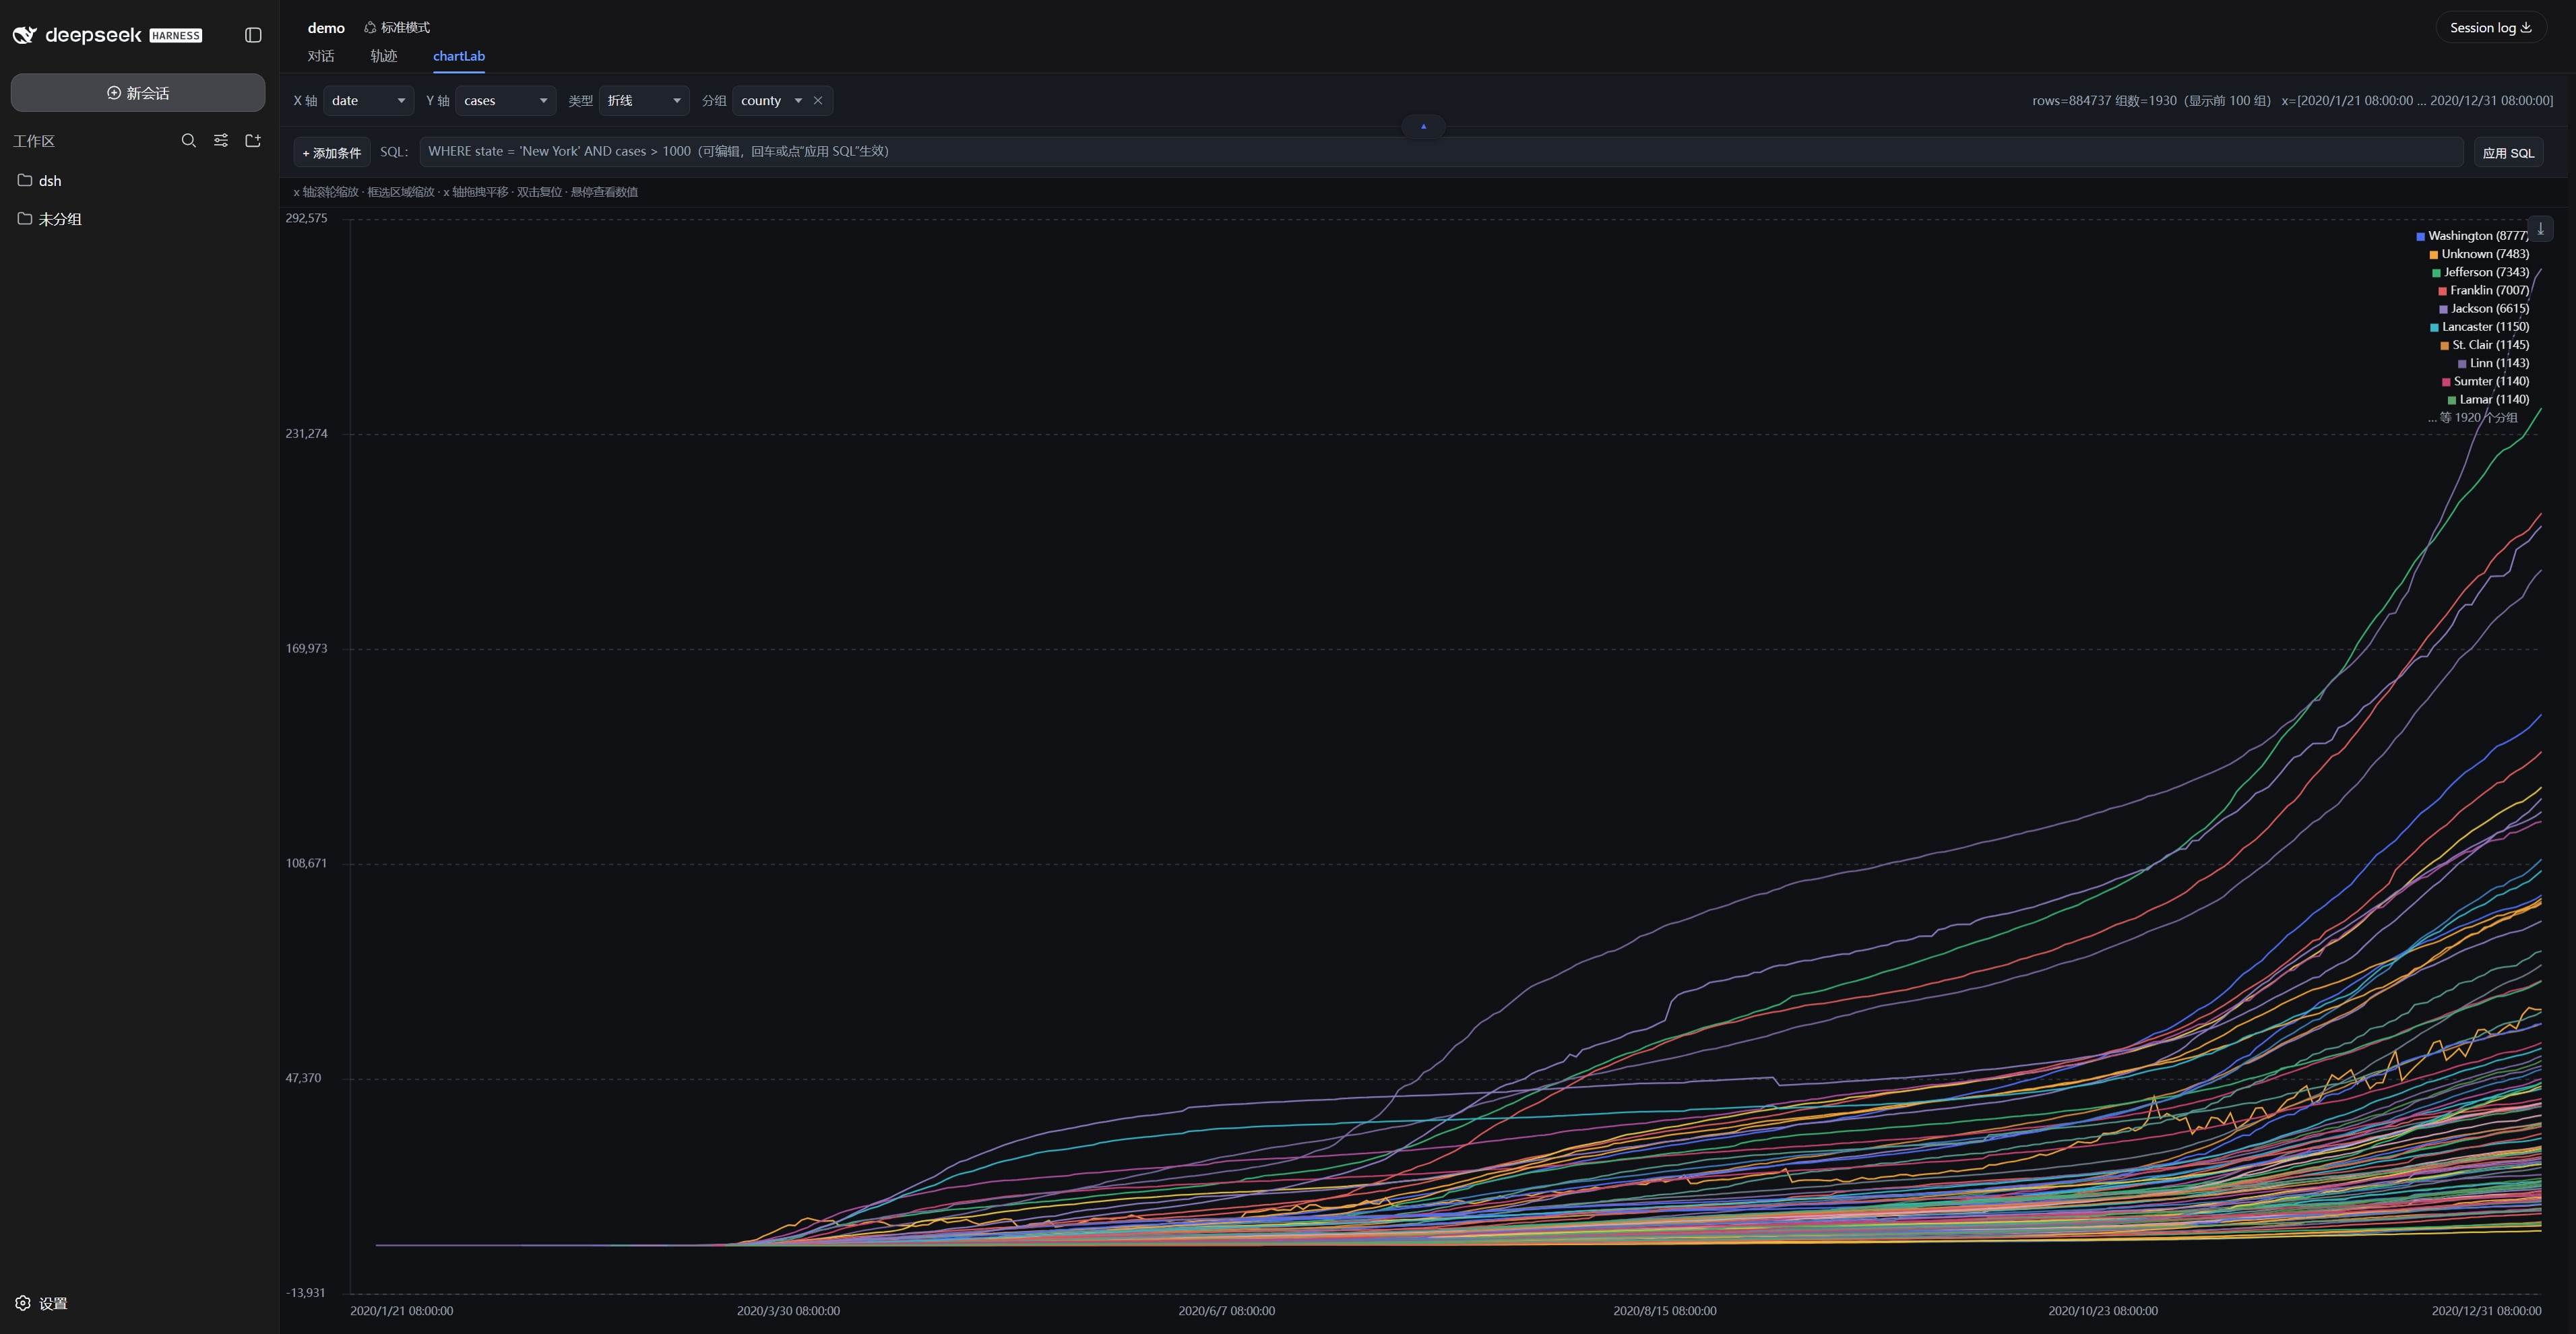
[[_TOC_]] --- One line: **let the agent turn your data into an interactive chart.** - **Three data sources** โ€” local data files (`.csv` / `.xlsx` / `.xls`), or a table inside a DuckDB database (`.duckdb` / `.ddb`). Just say it in chat. - **Supports millions of rows** โ€” data stays on the host; the chart fetches only the visible window, so zooming and panning stay smooth even at millions of rows. - **Full chart workbench** โ€” line / scatter; box zoom, wheel zoom, drag-to-pan, hover readouts. - **Filter** โ€” conditional filters (equal / not equal / range / multi-select, with date ranges). - **Group** โ€” one line per distinct value of a column. - **SQL** โ€” write SQL directly. - **Native look & feel** โ€” follows DSH's language (zh / en) and theme (dark / light) automatically, no reload needed. - **Per-session isolation** โ€” each conversation sees only its own charts; deleted sessions are cleaned up.

dsh-chartlab demo

--- ## โœจ Features | Capability | Description | |---|---| | Data sources | Local data files (`.csv` / `.xlsx` / `.xls`), DuckDB database tables (`.duckdb` / `.ddb`); the DuckDB table name is optional and defaults to the first table | | Chart types | Line, scatter | | Interaction | Box zoom, wheel zoom, drag-to-pan, hover readouts, screenshot download | | Filter | Conditional filters (equal / not equal / range / multi-select, with date ranges) | | Group | Group by a column โ€” one line per distinct value | | SQL | Write SQL queries directly in the chart; paste multi-line SQL | | Theme & language | Follows DSH dark / light theme and zh / en language | | Session isolation | Each conversation is independent; deleted sessions clean up their cache | --- ## ๐Ÿš€ Quick Start ```powershell dsh plugin --profile web add dsh-chartlab ``` Then just say in chat: > **Draw a chart of `/path/to/your-data.csv` with dsh-chartlab** > > **Draw a chart of `/path/to/your-data.xlsx` with dsh-chartlab** > > **Draw a chart of the `sales` table in `/path/to/your-data.duckdb` with dsh-chartlab** (table name optional; defaults to the first table) --- ## ๐Ÿ—บ๏ธ Roadmap | Status | Item | Notes | |---|---|---| | โœ… Done | CSV / Excel / DuckDB data sources | One-line interactive charts | | โœ… Done | Filters, group lines, SQL row filtering | In-chart UI | | ๐Ÿšง Planned | Streaming Excel reads | Large xlsx currently loads fully & synchronously | | ๐Ÿšง Planned | Multiple Excel sheets | Currently reads the first sheet | | ๐Ÿ’ก Idea | More data sources | Parquet / JSON, etc. | Issues and PRs welcome. --- ## ๐Ÿ“„ License [MIT](LICENSE) ยฉ 2026 mok