# About
[Daru](https://github.com/sciruby/daru) (Data Analysis in Ruby) is a library for analysis, manipulation, and visualization of data. Daru-view is for easy and interactive plotting in web applications & IRuby notebook. It can work in frameworks like Rails, Sinatra, Nanoc, and hopefully in others too.
It is a plugin gem to Data Analysis in Ruby([Daru](https://github.com/sciruby/daru)) for visualization of data
## Documentation:
- [Documentation present in Rubydoc](http://www.rubydoc.info/github/sciruby/daru-view/)
- [daru-view/wiki](https://github.com/SciRuby/daru-view/wiki)
## Blogs:
- [ScirRuby/blog](http://sciruby.com/blog/2017/09/01/gsoc-2017-data-visualization-using-daru-view/)
- [GSoC 2017 Blog posts](http://shekharrajak.github.io/gsoc_2017_posts/)
- [GSoC 2018: Work Product](https://32teethglitter.wordpress.com/2018/08/07/work-product-gsoc-2018/)
- [Rubyist’s, so-called Powerful Future Plotting library](https://medium.com/@Shekharrajak/rubyists-so-called-powerful-future-plotting-library-1c4e202eee6d)
- [I am a Ruby developer. How can I use Highcharts?](https://www.highcharts.com/blog/post/i-am-ruby-developer-how-can-i-use-highcharts/?__cf_chl_jschl_tk__=338bba242759c7d002887f58fad0e75aa46ed51a-1590914540-0-AQMW--o2s08ZWLQPqt7pePLoMu7ffsDtNrL-9goaQigUbeCmxrCFfev9yAtGpwnEl3W6SDFy3NUKf04OfUXff8rKSfSRZDr32vJdkHnjnvgaaFWz1o3zeuneNUSriZsyFOGQ3OD5Gr5qWQJc-lWOI9X7Dc8g6qiV36RH2hUS1WLloOy23igNvfODDZwSt5WXQNh7-SoiJbJfiUXb7k_k3a49sqY9qmHvUsz6qTlMs1QivPkDU17-CdhNLK6tfOO6YEqSFy9tvvj-WzdMIUXCwa5x6OmOpJPo9qzfPqz7hCmnZcGBjepS1LLQmFKt4d1vAoRquLZPJI4oHBh0CVKi6LMcayOHXmwbq-tnRfNuhqyIAx-pD56OY0B2-rmLE3h3UB9FoDfI5hpOE1XAI7YB-9M)
- [How to create charts with daru-view and Highcharts in any Ruby web application framework](https://www.highcharts.com/blog/tutorials/how-to-create-charts-with-daru-view-and-highcharts/?__cf_chl_jschl_tk__=55ff70069823ebbf589d04997c7d68914e94a5dc-1590914539-0-AbSHzGQB6RsWEv-9EV-Ia-Lgk281WXlDwulwWHMivv_SZ8D2SmSEA3xWLfyFVubIrBi0DYER-Y8A7M37WKJmsbPAO5EGfoOL-0GLwl6An3Ol0iwkUN_BFvtntg3oS2sysjvCakfMJvo50yDgLAzFAiJuxeHfUhpn9ejs4Qxk0xQy3coVmH6qjpFXjDb9ZEJxbEZ2F7LmUW4DBg9MmgWyu7KNMZn5B0P7c6TFhOxv4xBb6__A17QWGOb-Af8_a1-y_8aKAVtTE2uJOuil5tPL9IuWI1oDZ2kMaeg04es9VLJOv6MFH0u9ayN3OyEUPYN7xVkn8b-weKpo8sJoEc60UvX9zDyx-1StSVWbGUbHgOLlNPZT6Xz6365q7MLHXaYAFICXSafLDGY6DSizy147MDuZbNVg6glgFosbgHjeCXK4)
## Examples:
- [IRuby notebook examples](http://nbviewer.jupyter.org/github/sciruby/daru-view/tree/master/spec/dummy_iruby/)
- [Demo web applications (Rails, Sinatra, Nanoc)](https://github.com/Shekharrajak/demo_daru-view)
## Installation
Add this line to your application's Gemfile:
```ruby
gem 'daru-view', git: 'https://github.com/SciRuby/daru-view'
```
And then execute:
$ bundle
Or install it yourself as:
$ gem install daru-view
If the above is not working or you want to install the latest version from the GitHub repo:
```
gem install specific_install
gem specific_install https://github.com/SciRuby/daru-view
```
## Usage
### Use in IRuby notebook
- To install IRuby notebook in your system, follow the steps given in [IRuby repo](https://github.com/SciRuby/iruby#quick-start).
- Create a separate folder and Gemfile inside it. Add a minimum these lines to it
```ruby
source "http://rubygems.org"
# iruby dependencies
gem 'rbczmq'
gem 'ffi-rzmq'
gem 'iruby'
# fetch from the github master branch
gem 'daru-view', :git => 'https://github.com/SciRuby/daru-view'
gem "daru", git: 'https://github.com/SciRuby/daru.git'
gem "nyaplot", git: 'https://github.com/SciRuby/nyaplot.git'
gem 'google_visualr', git: 'https://github.com/winston/google_visualr.git'
gem 'daru-data_tables', git: 'https://github.com/Shekharrajak/daru-data_tables.git'
```
- Now do `bundle install` and run `iruby notebook`
- You may like to try some examples that are added in specs : [spec/dummy_iruby/](http://nbviewer.jupyter.org/github/sciruby/daru-view/tree/master/spec/dummy_iruby/)
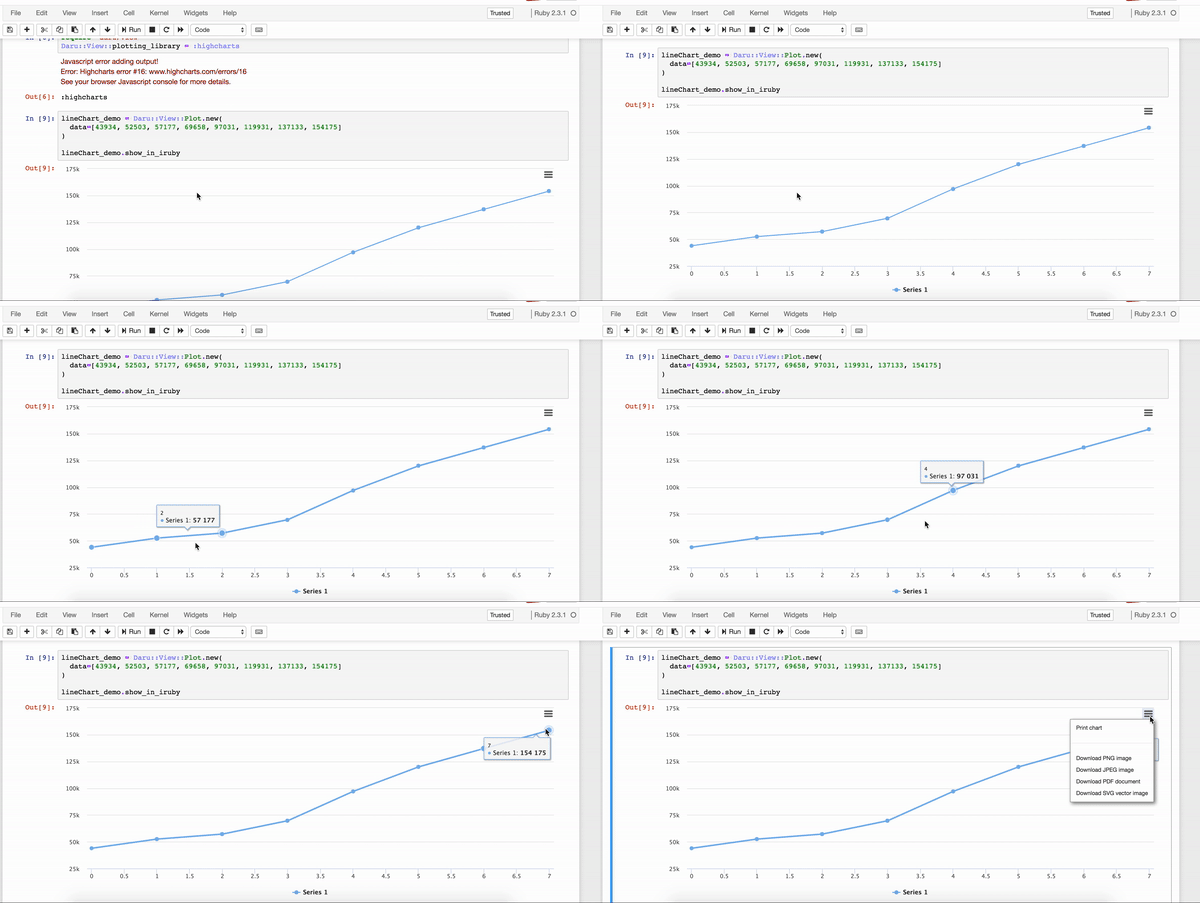
#### HighCharts example:
```ruby
# set the library, to plot charts
Daru::View.plotting_library = :highcharts
# Simple line chart
@line_graph = Daru::View::Plot.new(
data=[43934, 52503, 57177, 69658, 97031, 119931, 137133, 154175]
)
# to see graph in IRuby notebook
@line_graph.show_in_iruby
# to see graph in any ruby web application framework
# Add this line in your view file, where you want to see your graph in the web application. (It will put the HTML code of the line graph on the web page)
<%=raw @line_graph.div %>
```
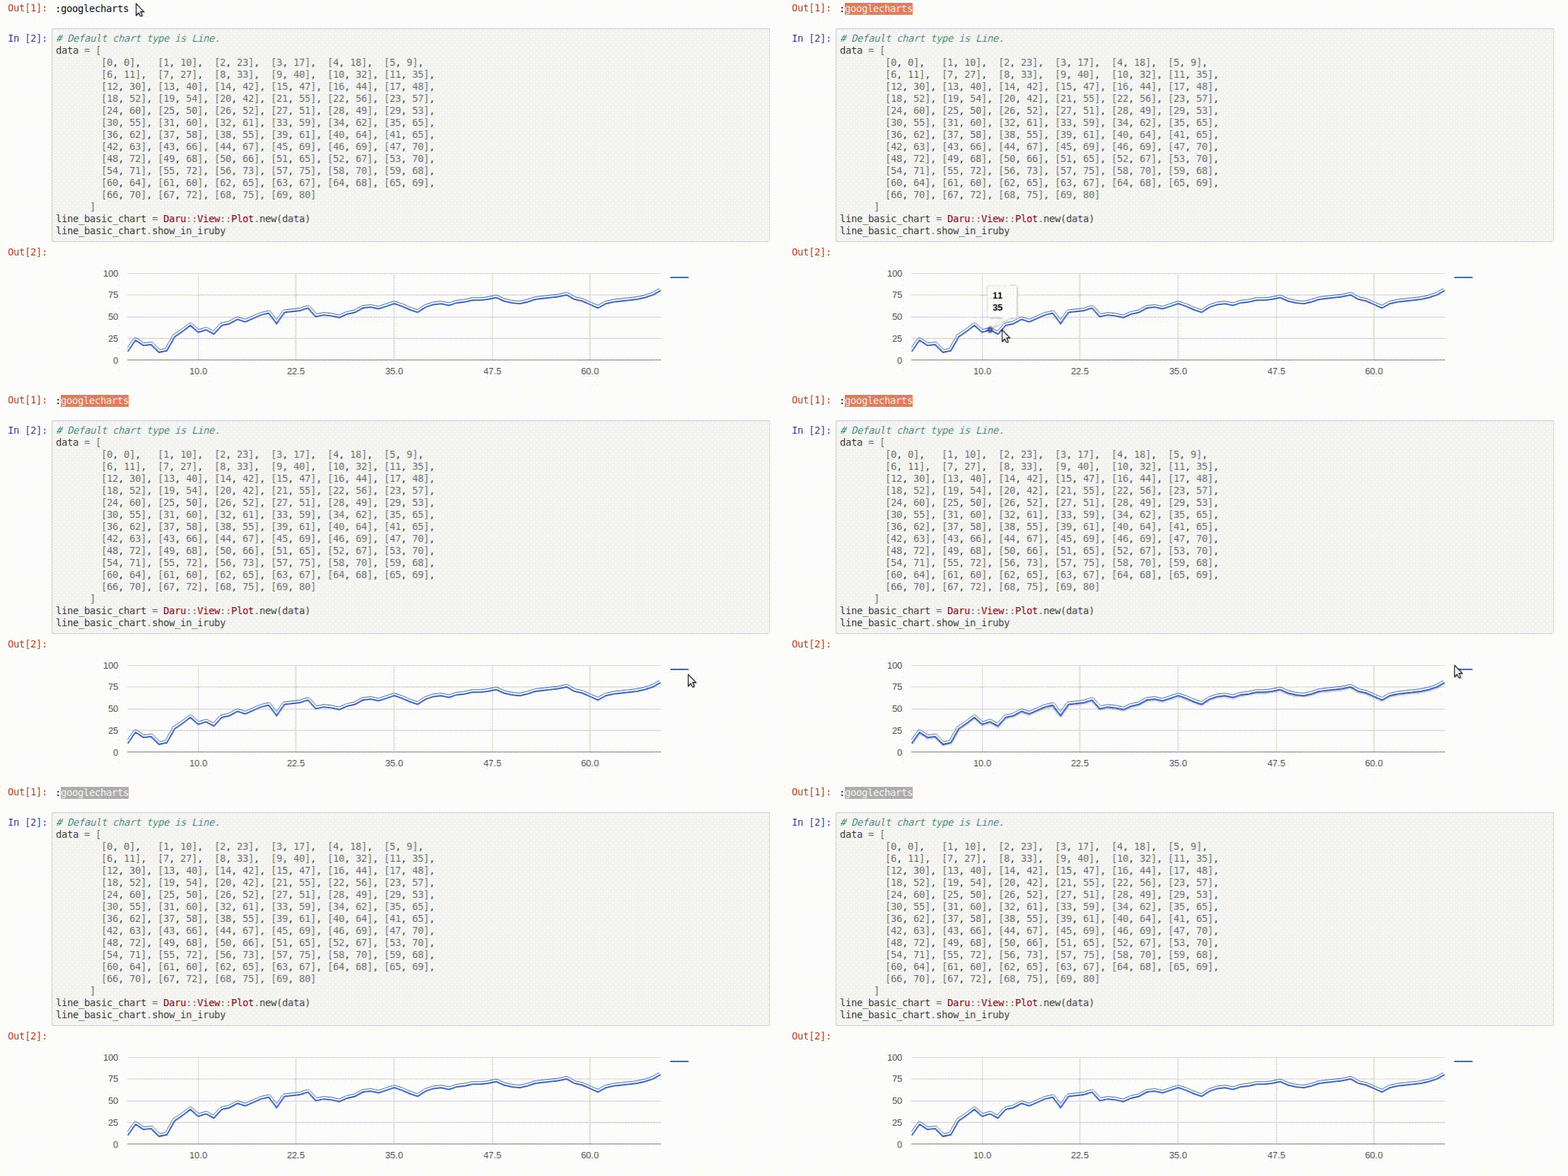
##### GoogleChart example:
```ruby
# Default chart type is Line.
data = [
[0, 0], [1, 10], [2, 23], [3, 17], [4, 18], [5, 9],
[6, 11], [7, 27], [8, 33], [9, 40], [10, 32], [11, 35],
[12, 30], [13, 40], [14, 42], [15, 47], [16, 44], [17, 48],
[18, 52], [19, 54], [20, 42], [21, 55], [22, 56], [23, 57],
[24, 60], [25, 50], [26, 52], [27, 51], [28, 49], [29, 53],
[30, 55], [31, 60], [32, 61], [33, 59], [34, 62], [35, 65],
[36, 62], [37, 58], [38, 55], [39, 61], [40, 64], [41, 65],
[42, 63], [43, 66], [44, 67], [45, 69], [46, 69], [47, 70],
[48, 72], [49, 68], [50, 66], [51, 65], [52, 67], [53, 70],
[54, 71], [55, 72], [56, 73], [57, 75], [58, 70], [59, 68],
[60, 64], [61, 60], [62, 65], [63, 67], [64, 68], [65, 69],
[66, 70], [67, 72], [68, 75], [69, 80]
]
line_basic_chart = Daru::View::Plot.new(data)
line_basic_chart.show_in_iruby
```
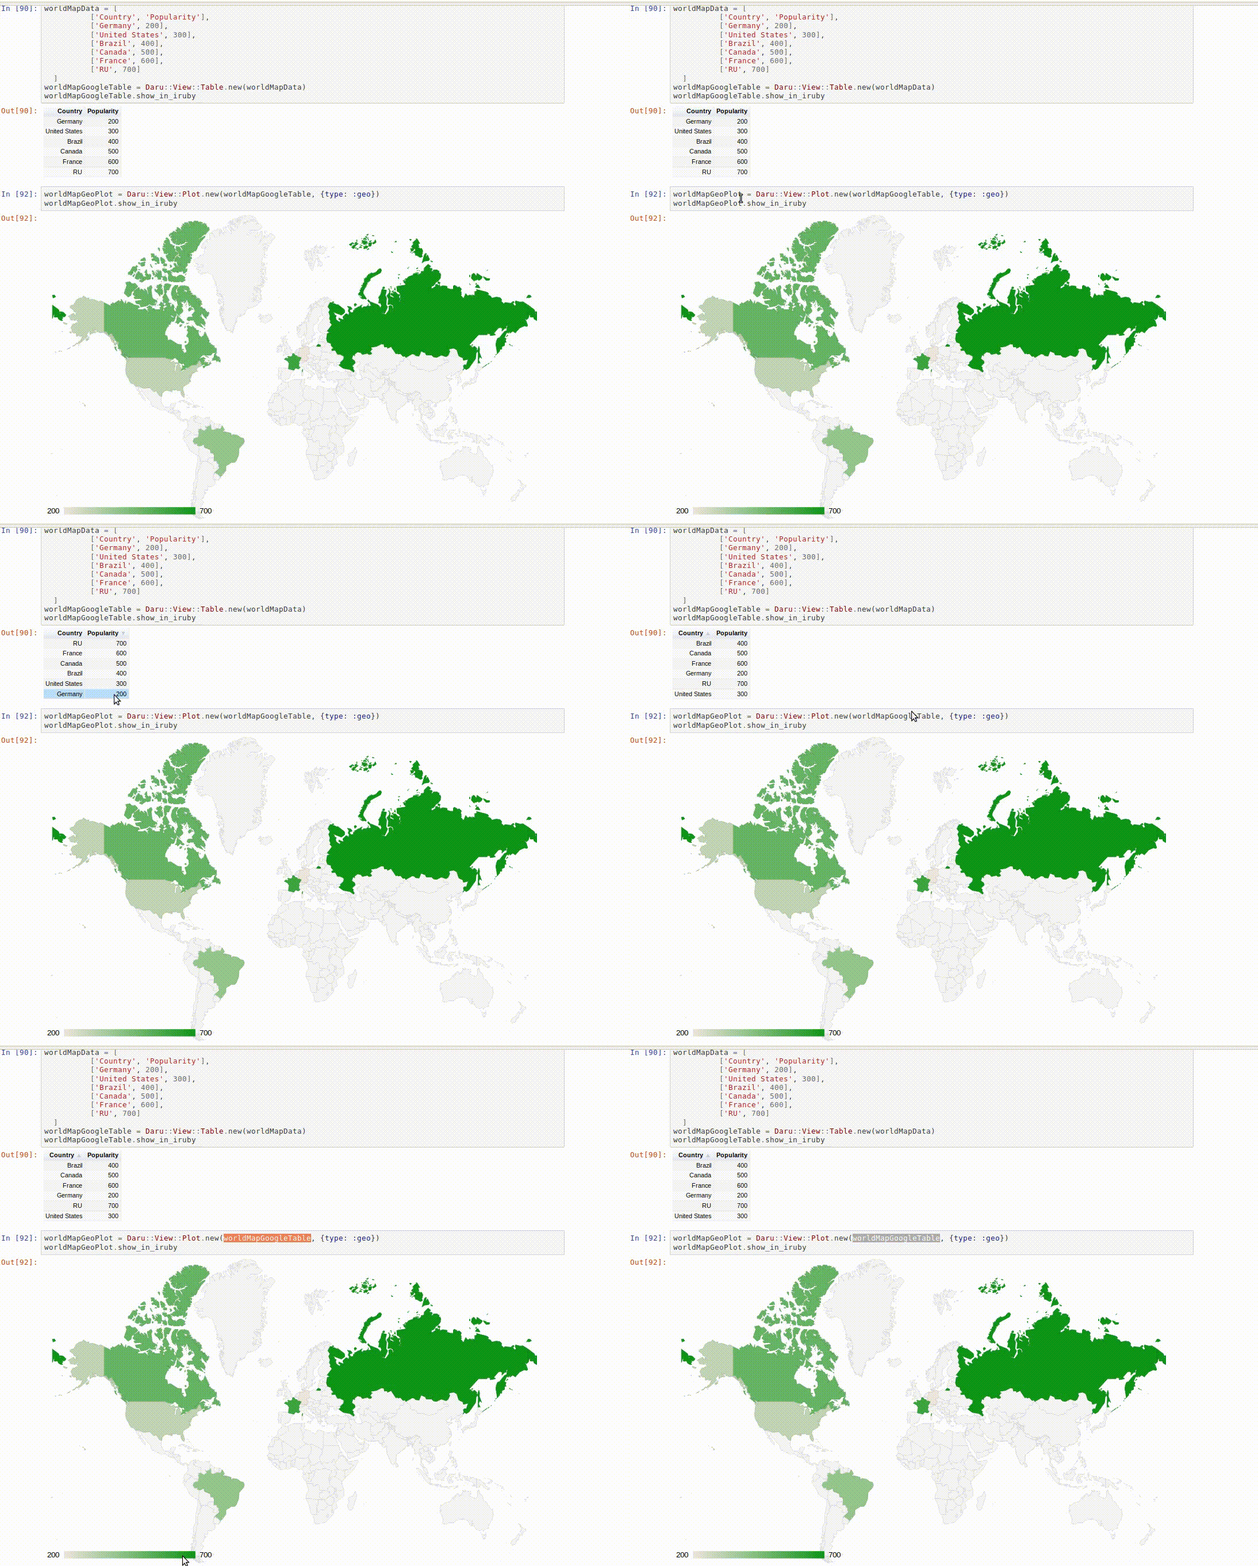
#### GoogleChart - GeoChart
```ruby
country_population = [
['Germany', 200],
['United States', 300],
['Brazil', 400],
['Canada', 500],
['France', 600],
['RU', 700]
]
df_cp = Daru::DataFrame.rows(country_population)
df_cp.vectors = Daru::Index.new(['Country', 'Population'])
geo_table = Daru::View::Table.new(df_cp, pageSize: 5, adapter: :googlecharts, height: 200, width: 200)
geochart = Daru::View::Plot.new(
geo_table.table, type: :geo, adapter: :googlecharts, height: 500, width: 800)
geochart.show_in_iruby
```
- You can find more examples in this [IRuby notebook example](https://nbviewer.jupyter.org/github/sciruby/daru-view/blob/master/spec/dummy_iruby/Google%20Charts%20%7C%20Geo%20Charts%20examples.ipynb).
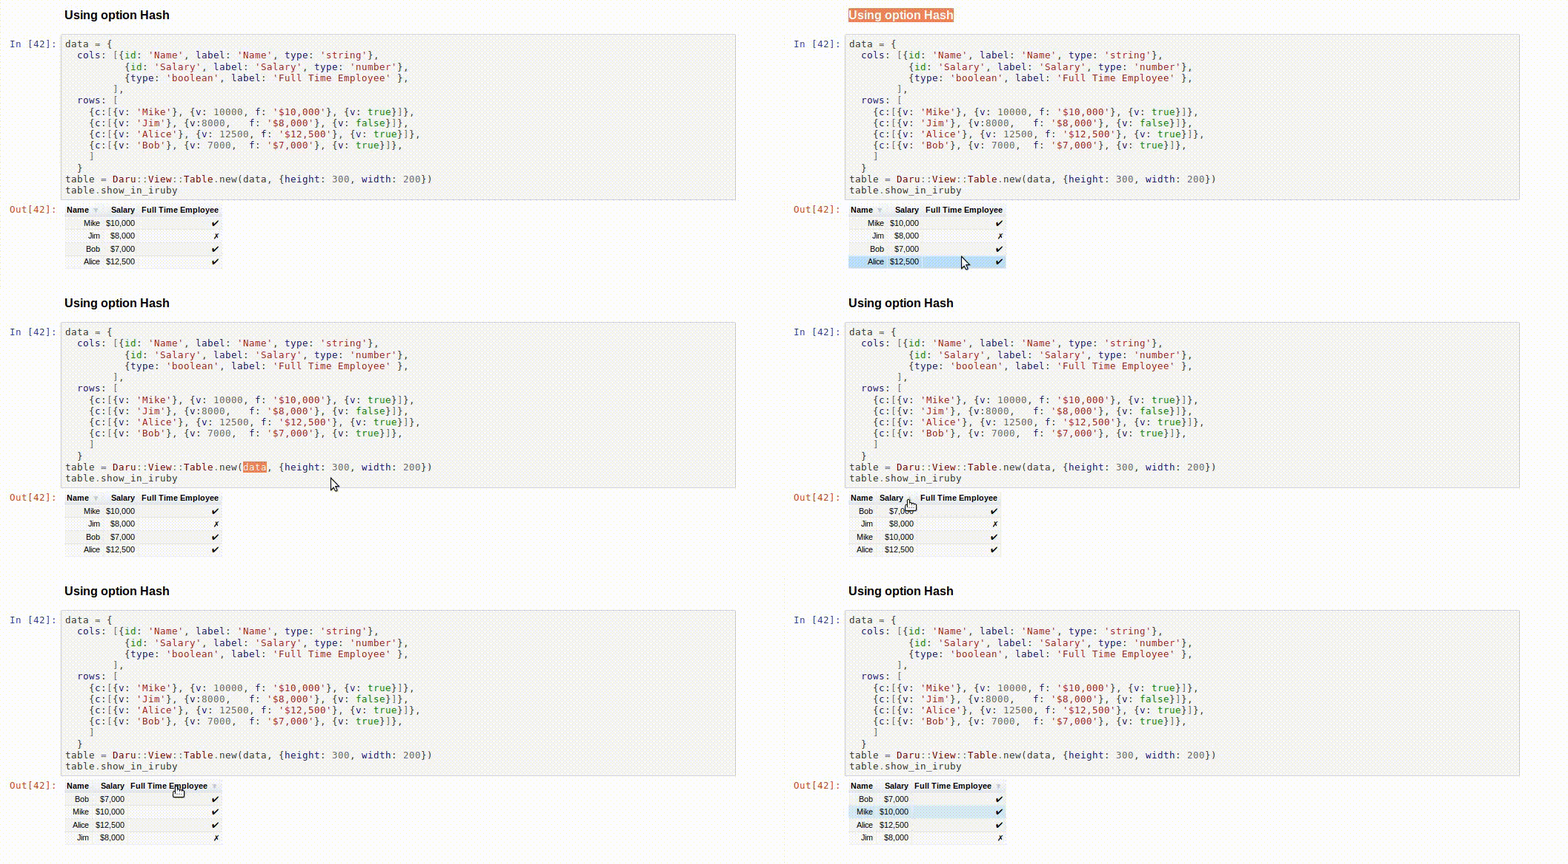
#### GoogleChart - datatable
```ruby
data = {
cols: [{id: 'Name', label: 'Name', type: 'string'},
{id: 'Salary', label: 'Salary', type: 'number'},
{type: 'boolean', label: 'Full Time Employee' },
],
rows: [
{c:[{v: 'Mike'}, {v: 10000, f: '$10,000'}, {v: true}]},
{c:[{v: 'Jim'}, {v:8000, f: '$8,000'}, {v: false}]},
{c:[{v: 'Alice'}, {v: 12500, f: '$12,500'}, {v: true}]},
{c:[{v: 'Bob'}, {v: 7000, f: '$7,000'}, {v: true}]},
]
}
table = Daru::View::Table.new(data, {height: 300, width: 200})
table.show_in_iruby
```
- Check out more amazing examples of GoogleChart datatable in [IRuby notebook](https://nbviewer.jupyter.org/github/sciruby/daru-view/blob/master/spec/dummy_iruby/GoolgeChart%20%7C%20Datatables.ipynb).
#### DataTable example
```ruby
arrayOfArray = [
[1, 3, 5, 7, 5, 0],
[1, 5, 2, 5, 1, 0],
[1, 6, 7, 2, 6, 0]
]
arrayOfArrayTable = Daru::View::Table.new(arrayOfArray, pageLength: 3, adapter: :datatables)
# paste the div part of the table in view part of the app or any HTML file.
# First load the dependency for the datatable using this line : `Daru::View.dependent_script(:datatables)`
arrayOfArrayTable.div
# For Rails application, we can use this line <%=raw arrayOfArrayTable.div %>
# For Nanoc and Sinatra application, we can use this line <%= arrayOfArrayTable.div %>
```
- NOTE: It works seamlessly in Ruby web applications, but currently DataTable doesn't work in IRuby notebook,
because of conflict in DataTable dependent js and IRuby dependent js.
- To see more examples, please check datatables examples written in [demo_daru-view](https://github.com/Shekharrajak/demo_daru-view) repository for different Ruby web application frameworks.
#### HighMap example
```ruby
opts = {
chart: {
map: 'countries/in/in-all'
},
title: {
text: 'Highmaps basic demo'
},
subtitle: {
text: 'Source map: 




