# ⏱️ Dayflow for Windows
**AI-powered time tracking and productivity analysis for Windows**
[](https://python.org)
[](https://doc.qt.io/qtforpython/)
[](LICENSE)
[](https://www.microsoft.com/windows)
*Silent background recording → AI analysis → visual timeline*
[](https://github.com/SeiShonagon520/Dayflow/releases)
[中文](README.md) | **English**
---
## 🎯 What is Dayflow?
**Dayflow** is an AI-powered time tracking tool for Windows. It quietly captures low-frequency screen activity and window context in the background, uses a vision model to infer what you are doing, and turns the result into a timeline, statistics dashboard, and reports so you can understand where your time actually goes.
### 💡 Who is it for?
- People who want to know where their day went
- People who want to review focus time, distractions, and work patterns
- People who need automatic activity logs, daily reports, or weekly summaries
- People who prefer passive tracking over manual timers
### 🏆 Key advantages
| Advantage | Description |
|-----------|-------------|
| **Zero effort** | Start it and let AI handle activity recognition automatically |
| **Low overhead** | 1 FPS recording + smart compression to keep background usage low |
| **Local first** | Raw recordings stay on your machine and temporary chunks are cleaned up after analysis |
| **Smart categories** | Automatically detects work / study / entertainment / social / rest |
| **Visual review** | Timeline, statistics page, and HTML dashboard for different review styles |
---
## 🔐 Privacy, upfront
Dayflow is designed around **local recording + cloud analysis + local storage**.
### 5 things you should know
1. **Full videos are not uploaded**
Raw recording chunks stay on your local machine.
2. **Only a limited number of keyframes are sent for analysis**
The current README describes up to 8 extracted frames per chunk being sent to the configured vision model.
3. **Analysis results are stored locally**
Activities, settings, and statistics are saved in a local SQLite database.
4. **Temporary chunks are cleaned up automatically**
After analysis, temporary recording files are deleted to reduce disk usage.
5. **You can pause recording for sensitive moments**
Passwords, banking, private chats, or anything else sensitive can be handled by pausing recording first.
### Local data location
```text
%LOCALAPPDATA%\Dayflow\
├── dayflow.db # activities, settings, stats
├── dayflow.log # runtime logs
├── chunks\ # temporary recording chunks
└── updates\ # downloaded updates
```
> 💡 If privacy is your first concern, read this section before enabling continuous recording.
---
## ✨ Main features
| Feature | Description |
|---------|-------------|
| 🎥 **Low-power recording** | 1 FPS low-resource background capture |
| 🪟 **Window tracking** | Uses Windows API to capture real app names and window titles |
| 🤖 **AI analysis** | Vision LLM classifies screen activity automatically |
| 📊 **Timeline view** | Clear daily activity review at a glance |
| 📈 **Statistics dashboard** | Time distribution, productivity trends, week comparison |
| 📊 **Web dashboard export** | Beautiful self-contained HTML report with charts |
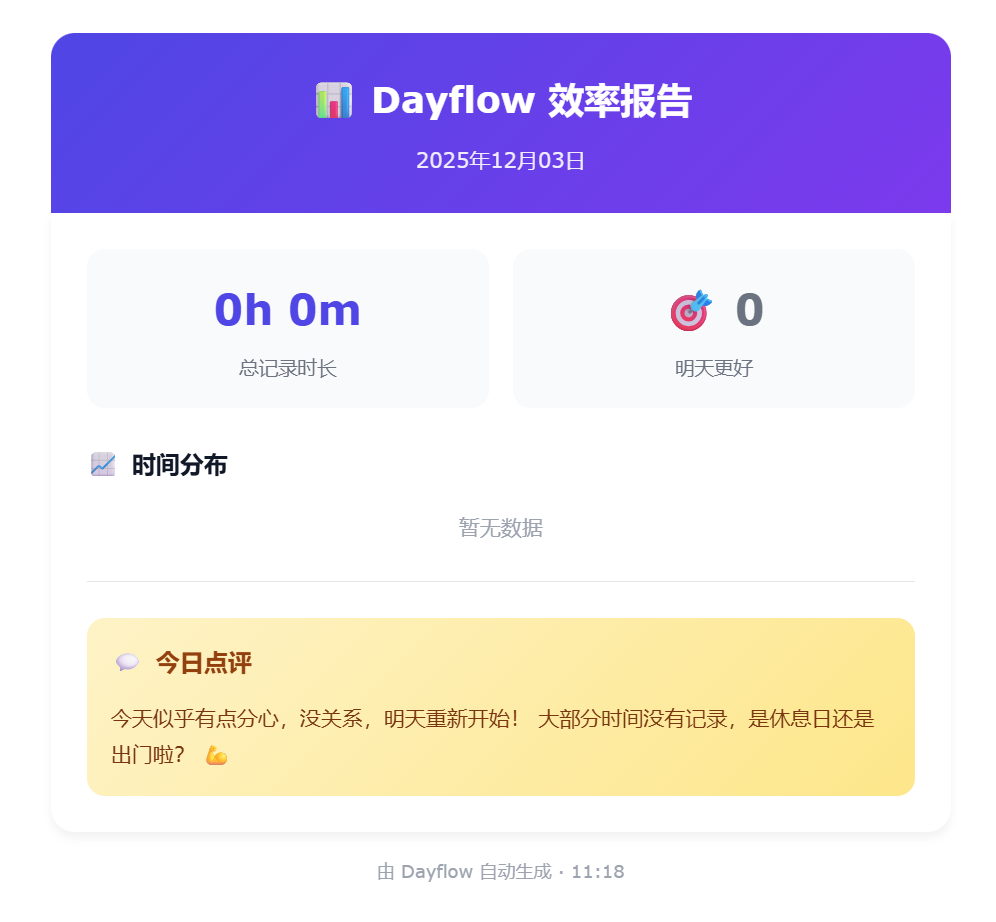
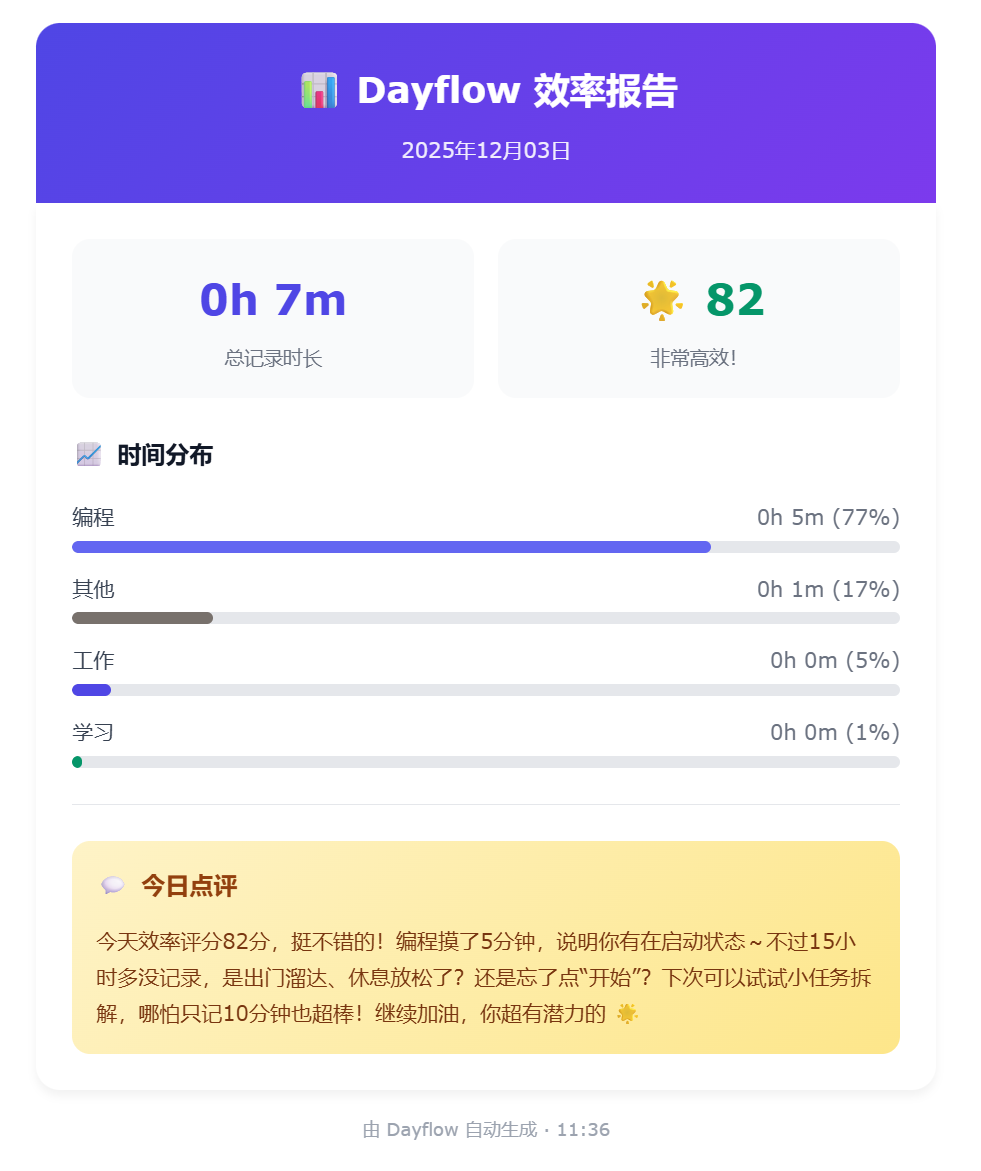
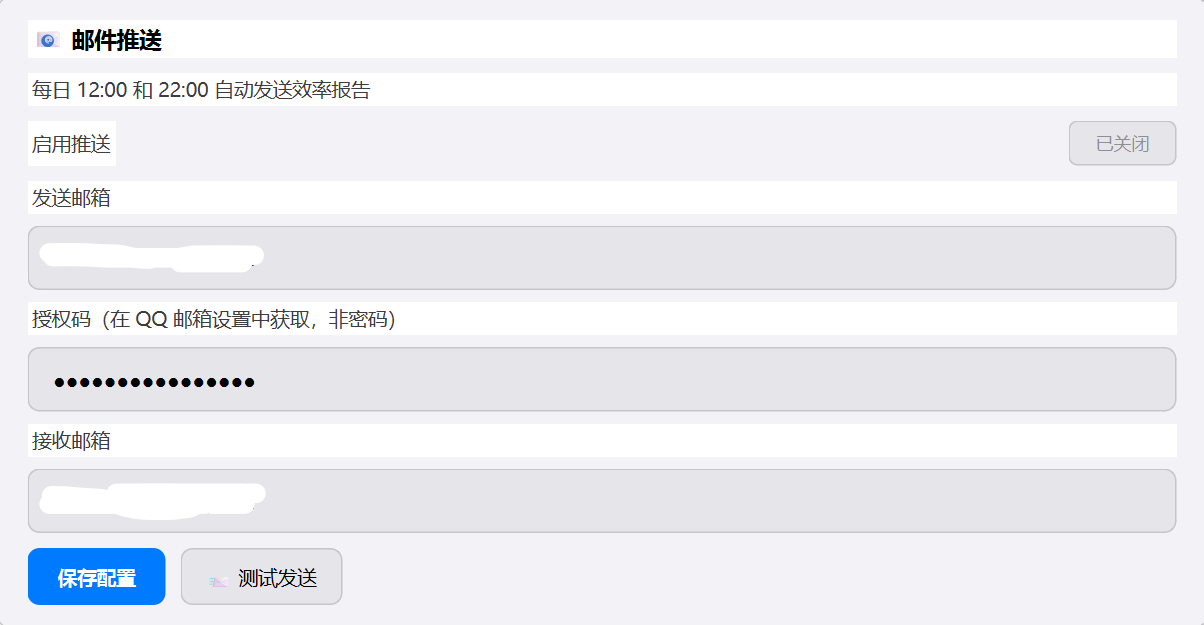
| 📧 **Email reports** | Automatic daily summaries and deeper analysis |
| 🔄 **Auto update** | Check, download, and install new versions |
| 🚀 **Auto start** | Launch on boot and minimize to tray |
| 📥 **CSV export** | Export activity data for further analysis |
| ⏸️ **Pause recording** | Pause when handling sensitive content |
| 🎨 **Theme switching** | Dark / light themes with saved preferences |
### 🆕 Recent highlights
#### v1.5.2 (2026-03)
- Statistics page redesign with metric cards, donut chart, trend chart, heatmap, and week comparison
- Activity cards can now be edited or deleted
- Better visual polish across the UI
#### v1.5.0 (2025-12)
- Windows API window tracking for more accurate recognition
- UI refresh: efficiency indicator bar, deep work badge, live recording duration, and more
- Improved prompting and data processing logic
---
## 🖥️ Screenshots
### Timeline page
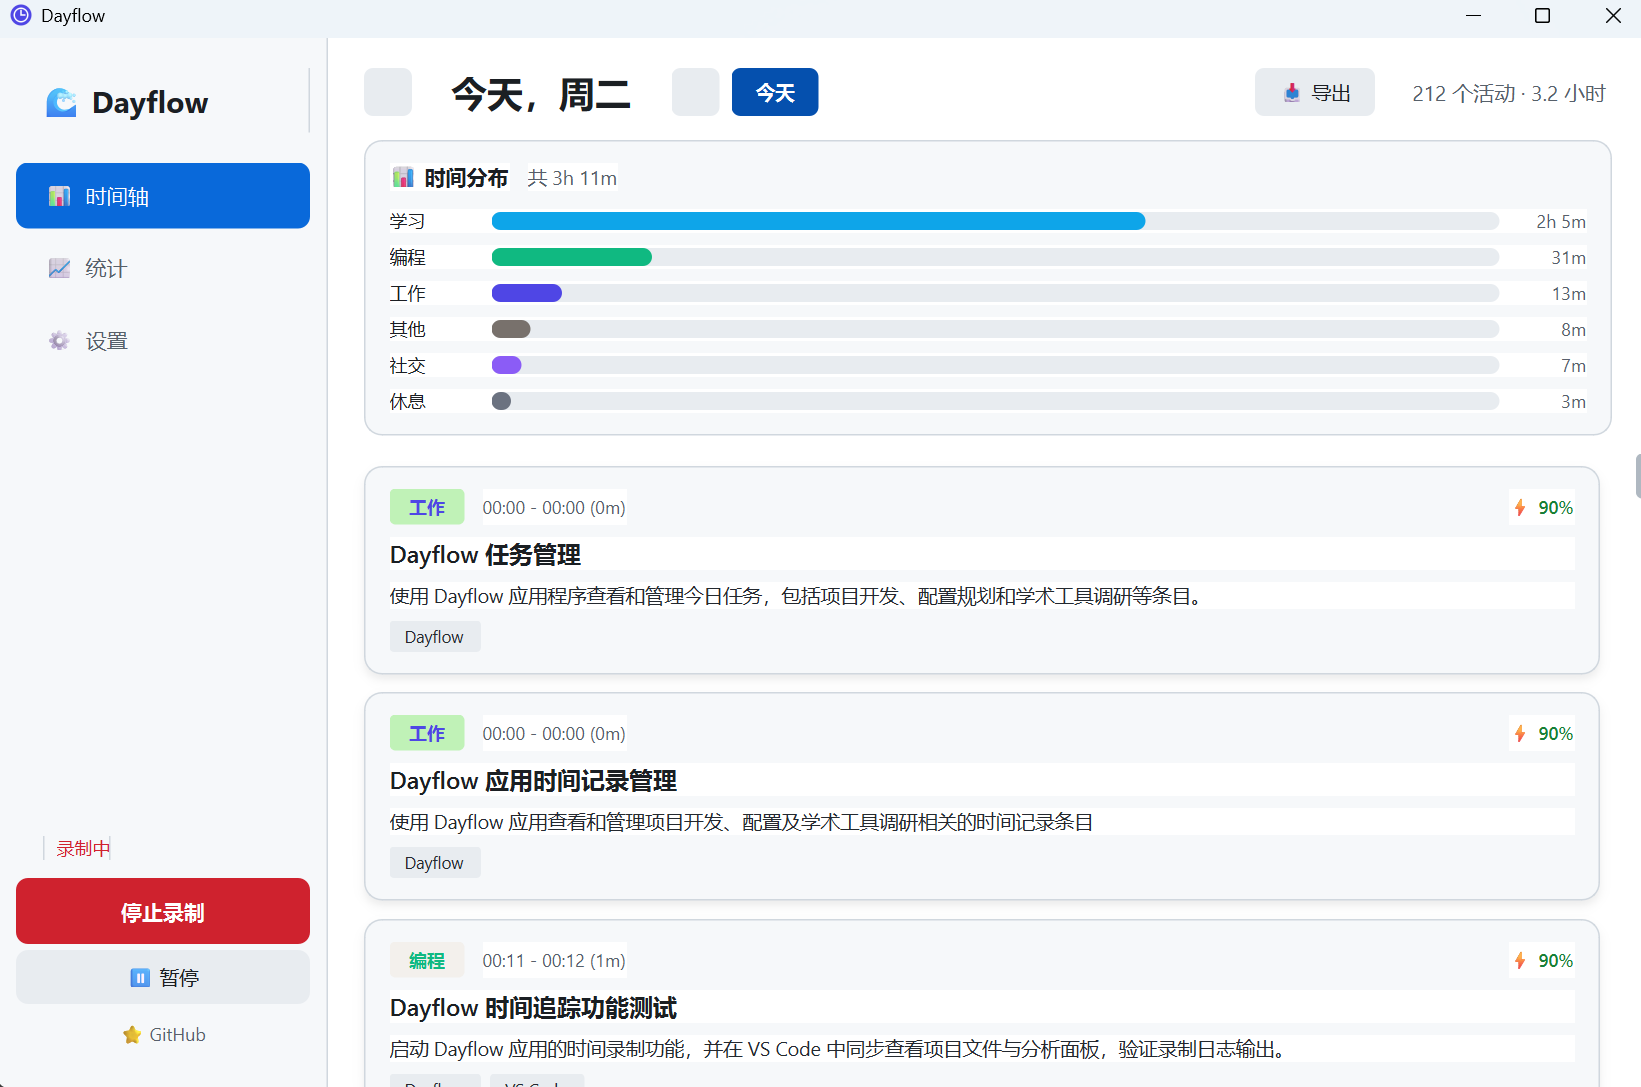
*Daily activity cards with time range, app, summary, and productivity score.*
### Statistics page
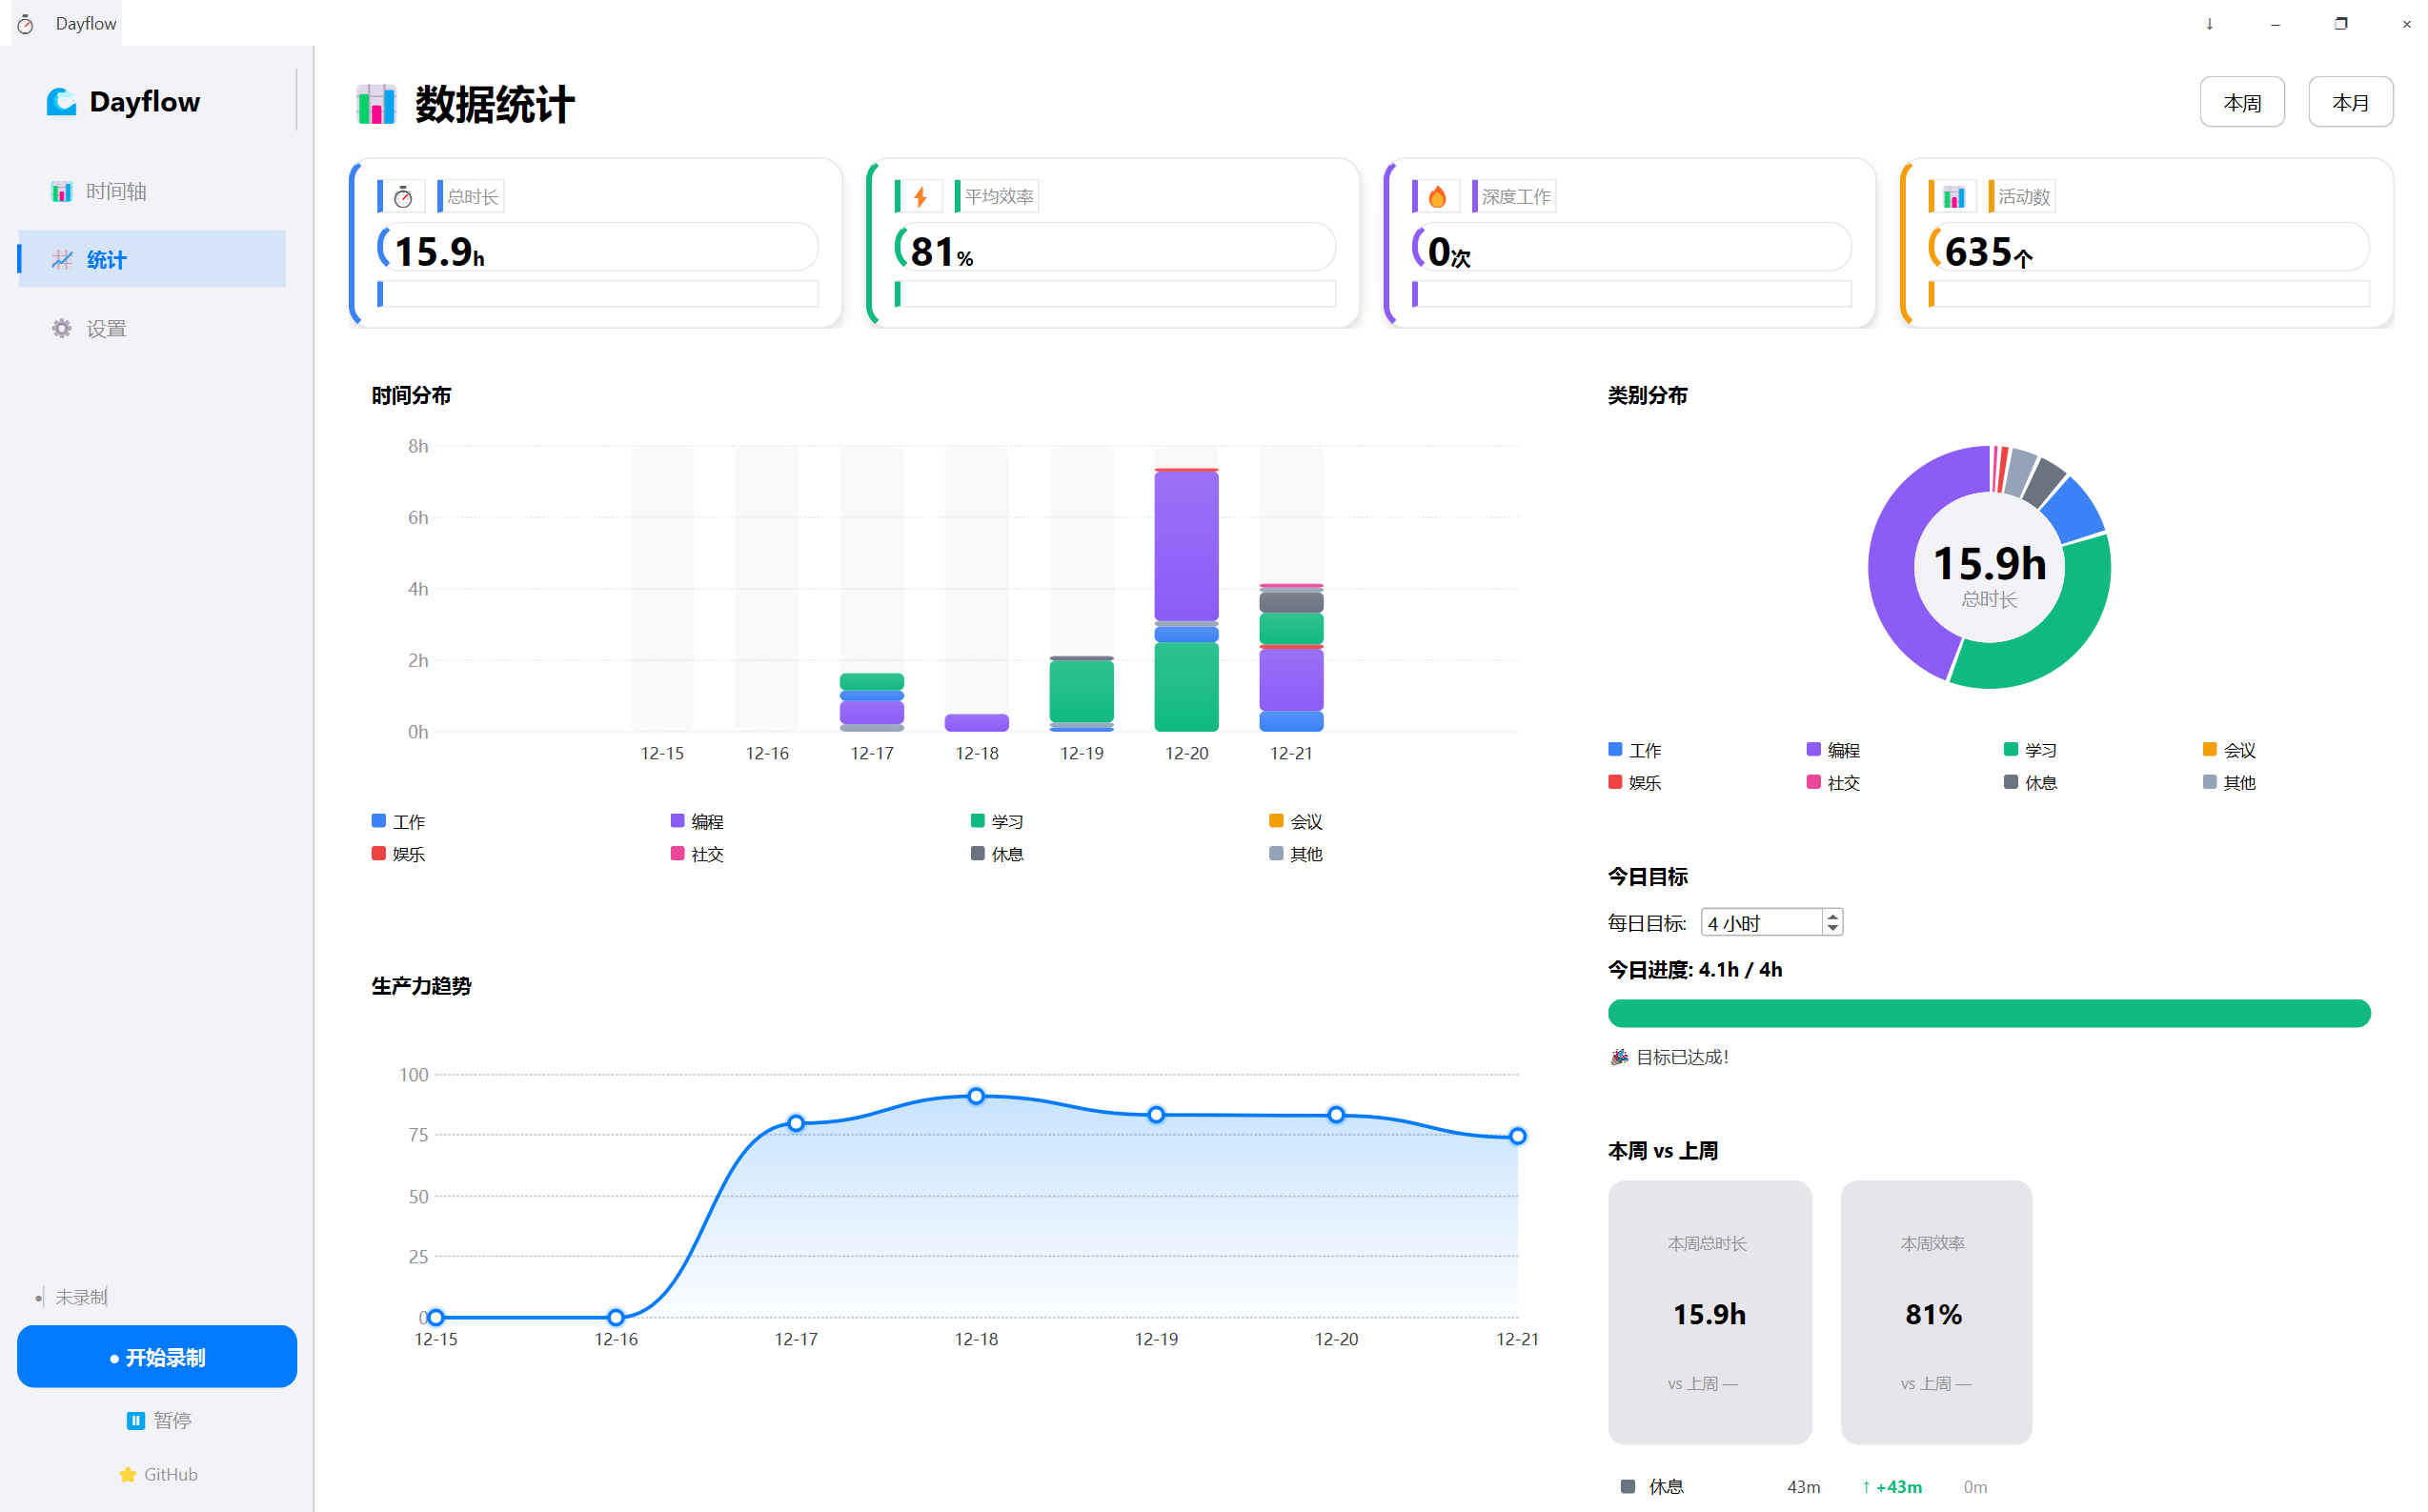
*Dashboard-style overview with key metrics, distribution charts, heatmap, and comparisons.*
### Web dashboard
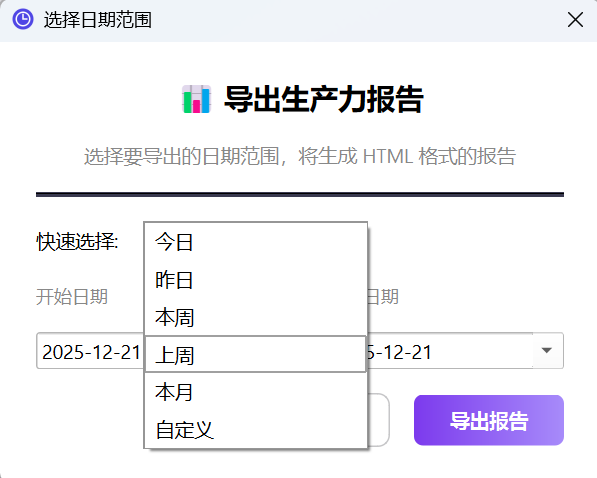
#### Date selection
#### HTML report
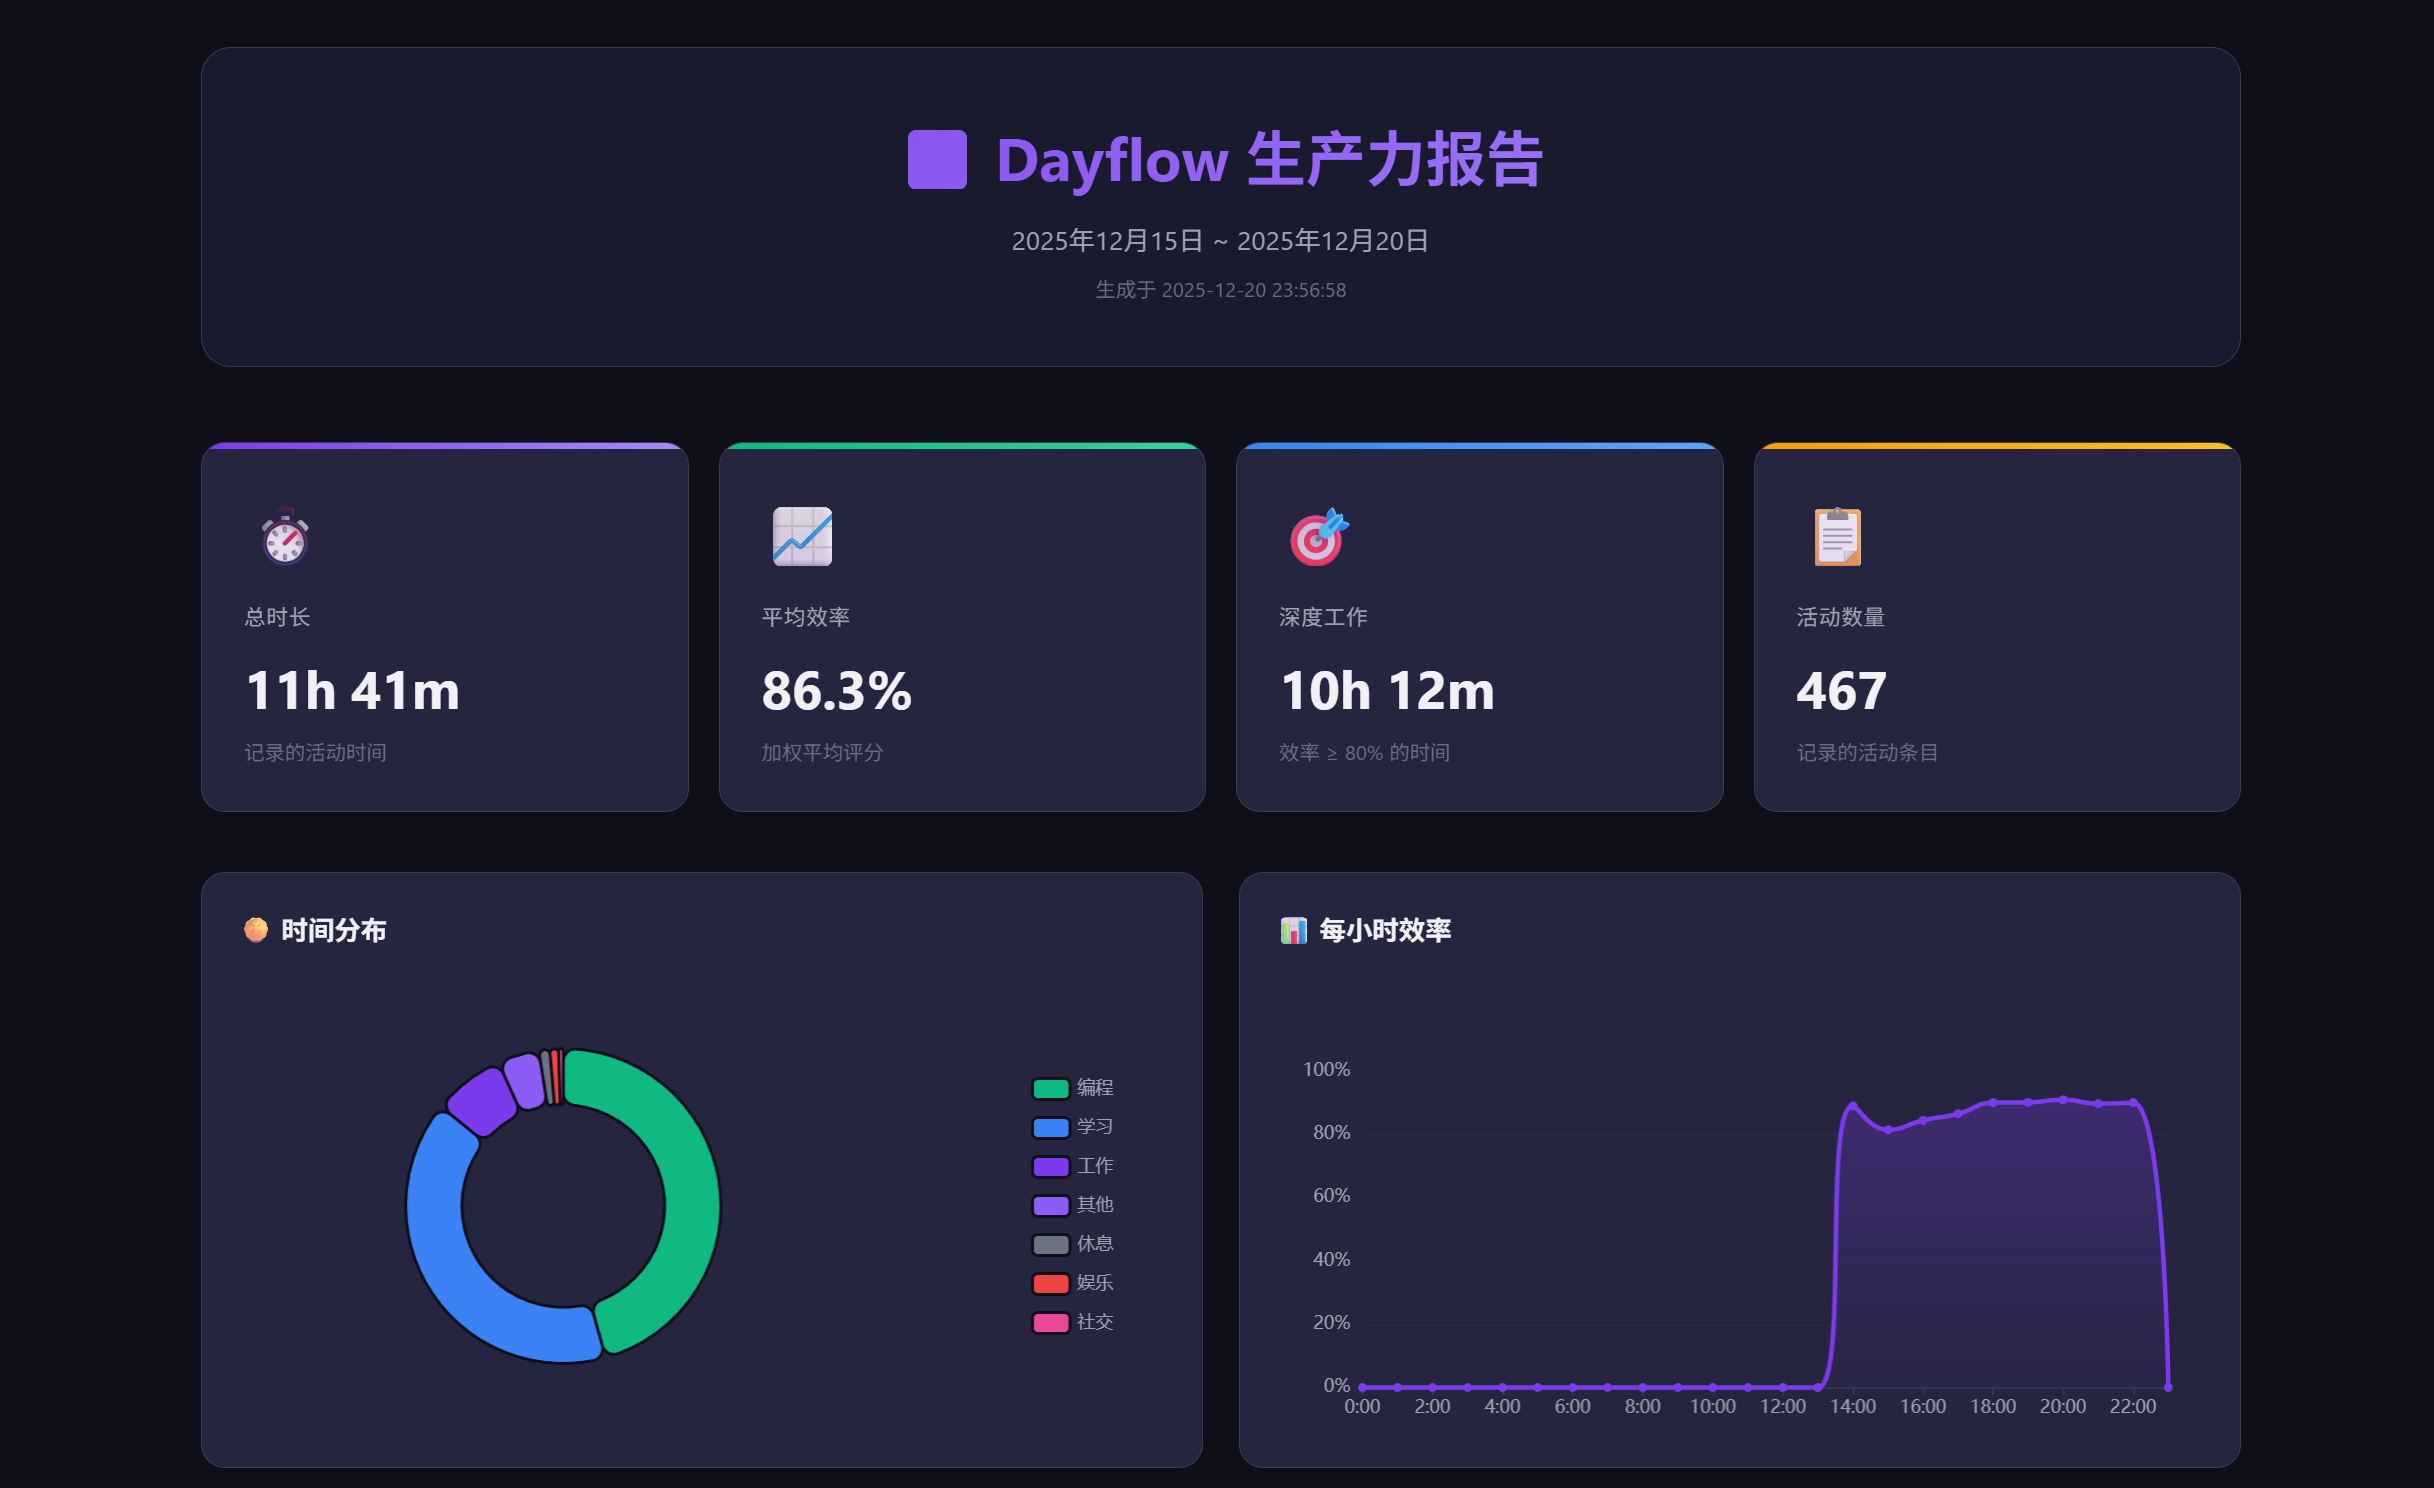
*Exported HTML dashboard that can be opened in a browser and shared directly.*
### Email reports
#### Settings
#### Examples