


Token ledger, account balance and subscription monitoring for the DSH Web GUI and desktop client
Sidebar usage card · current-chat breakdown · range-driven usage page · balances and plan windows · low-quota reminders · history backfill
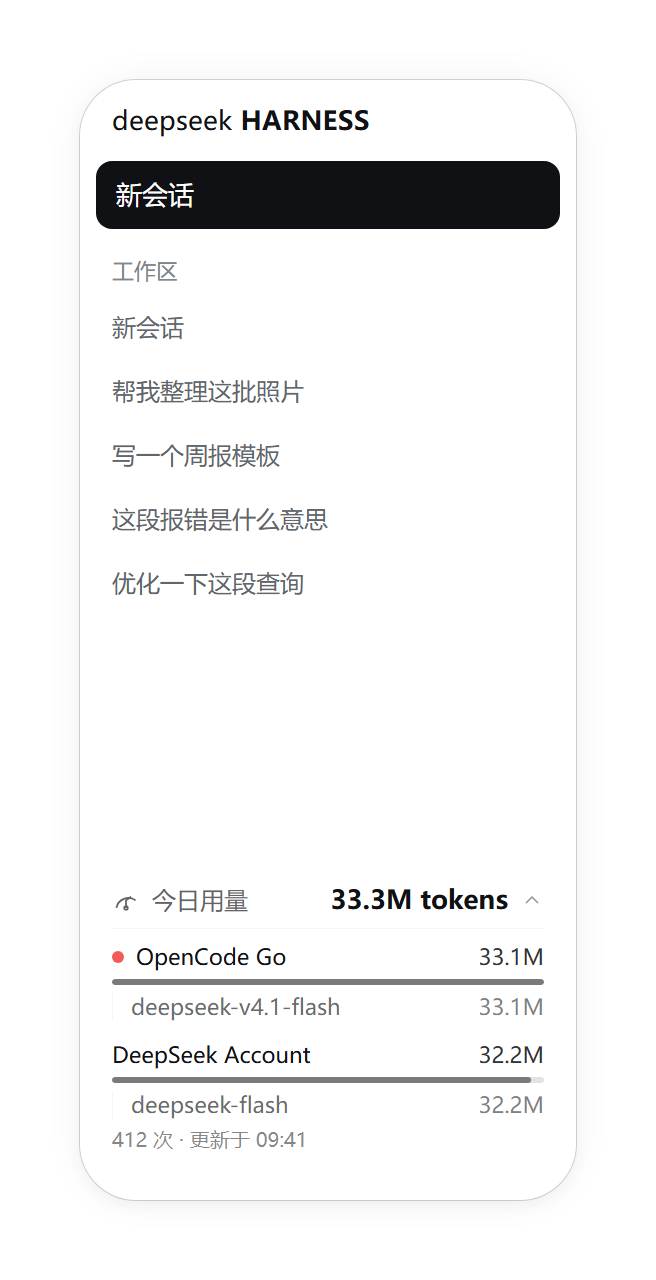
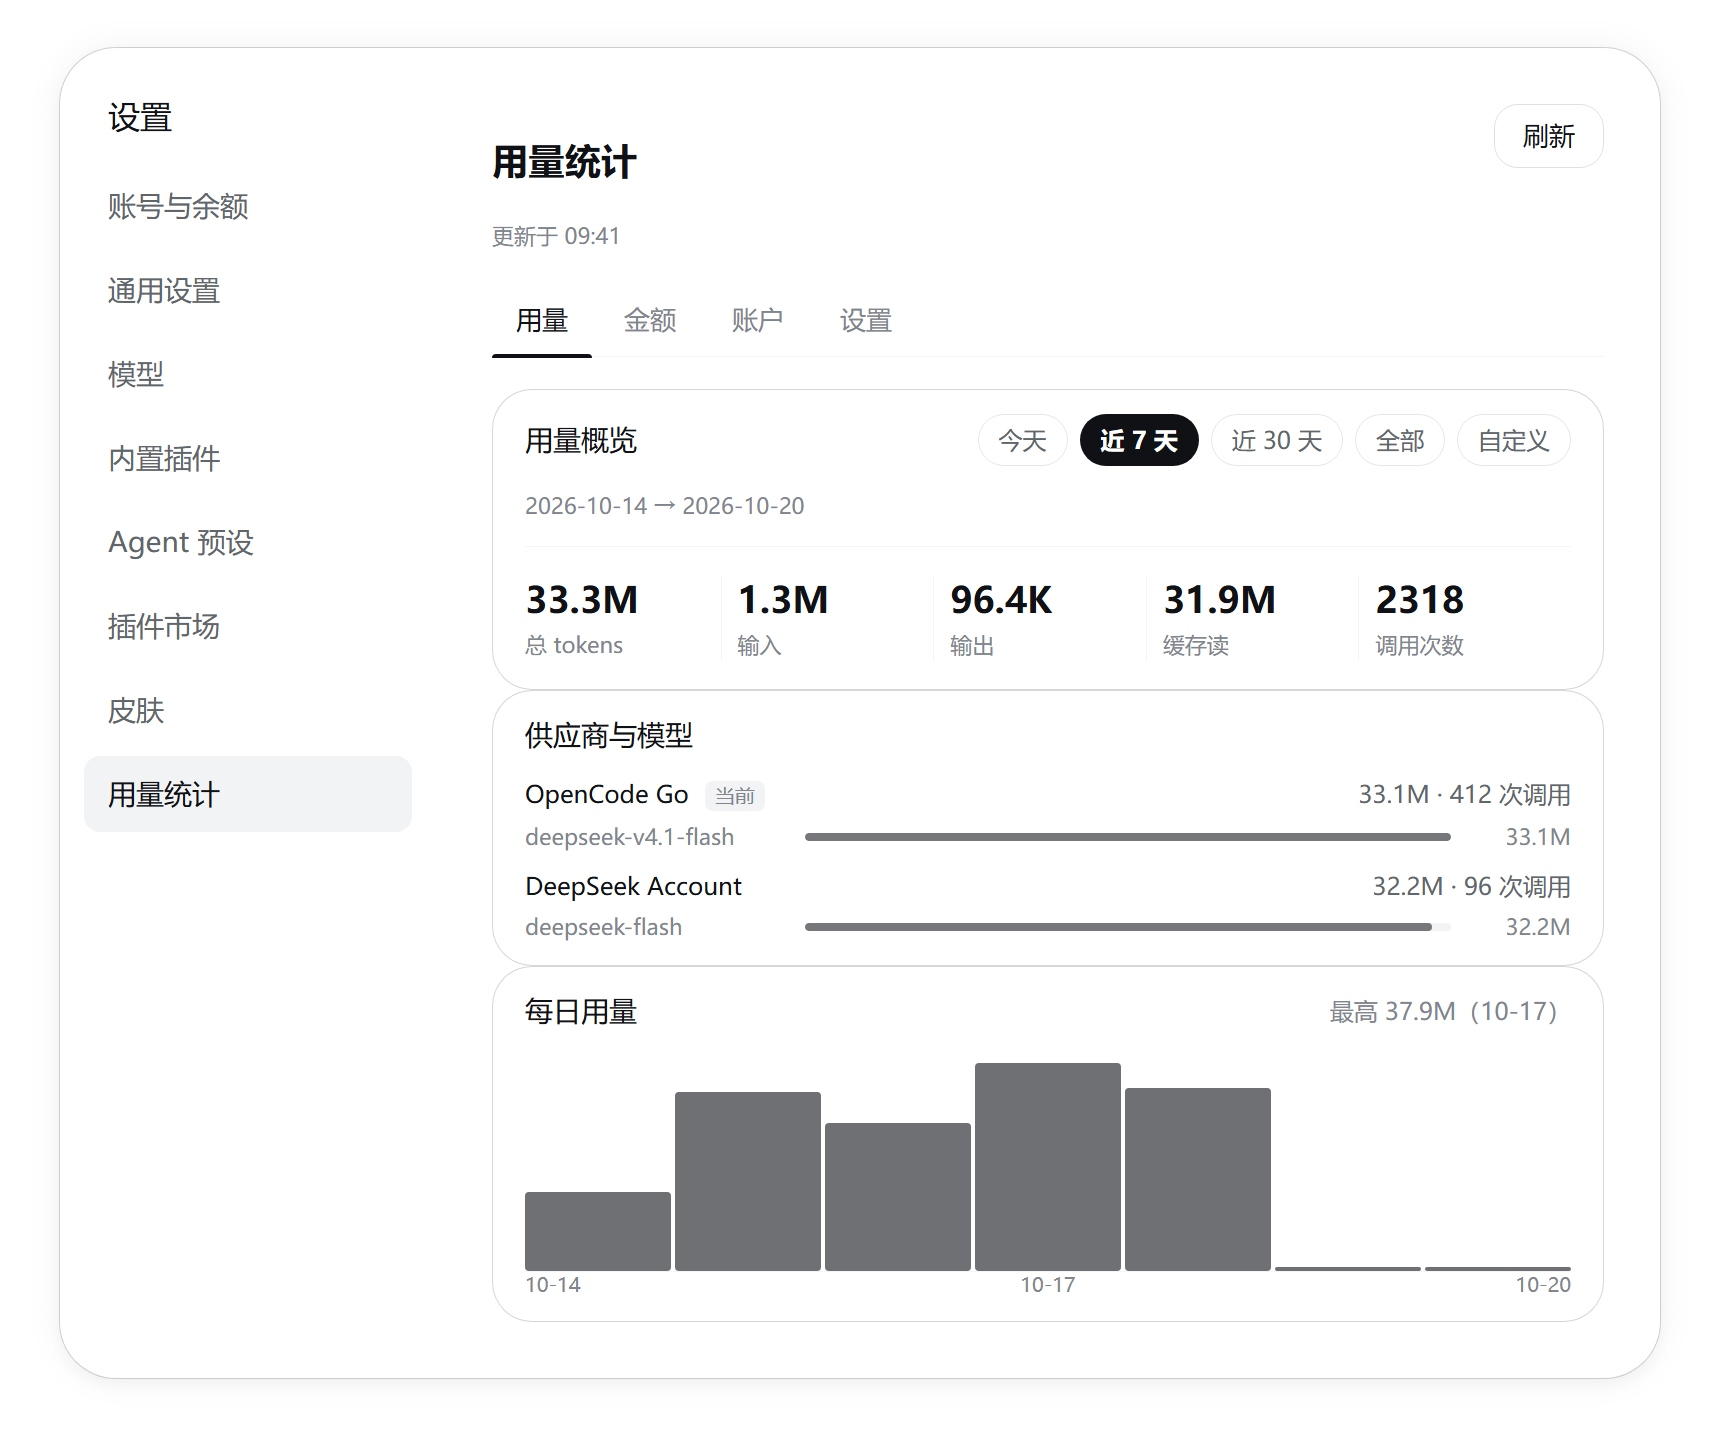
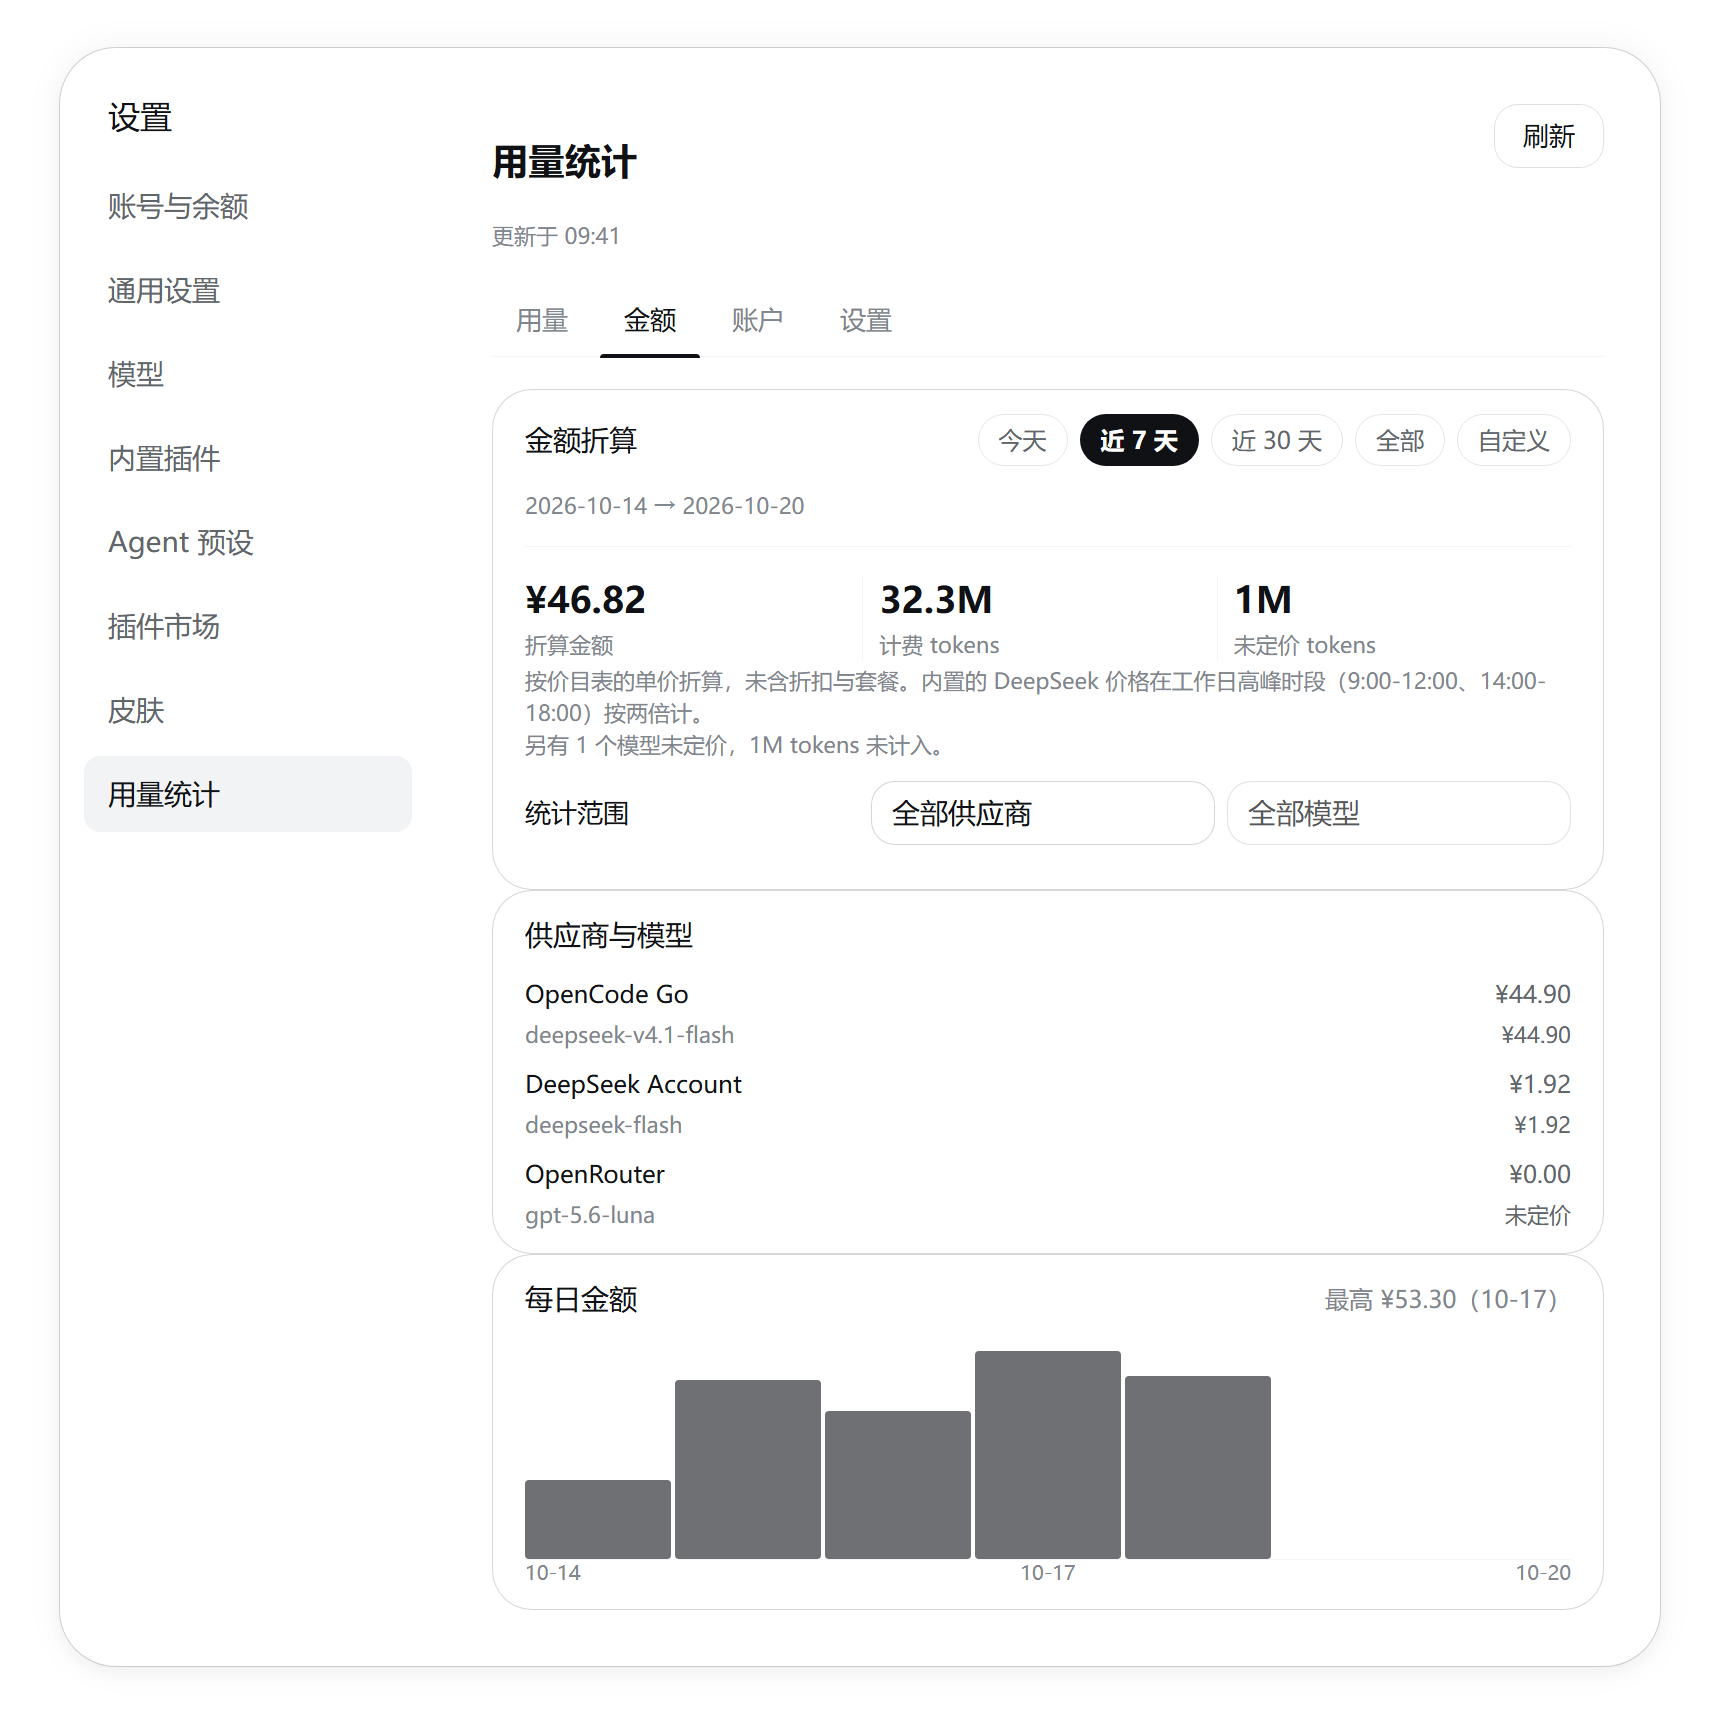
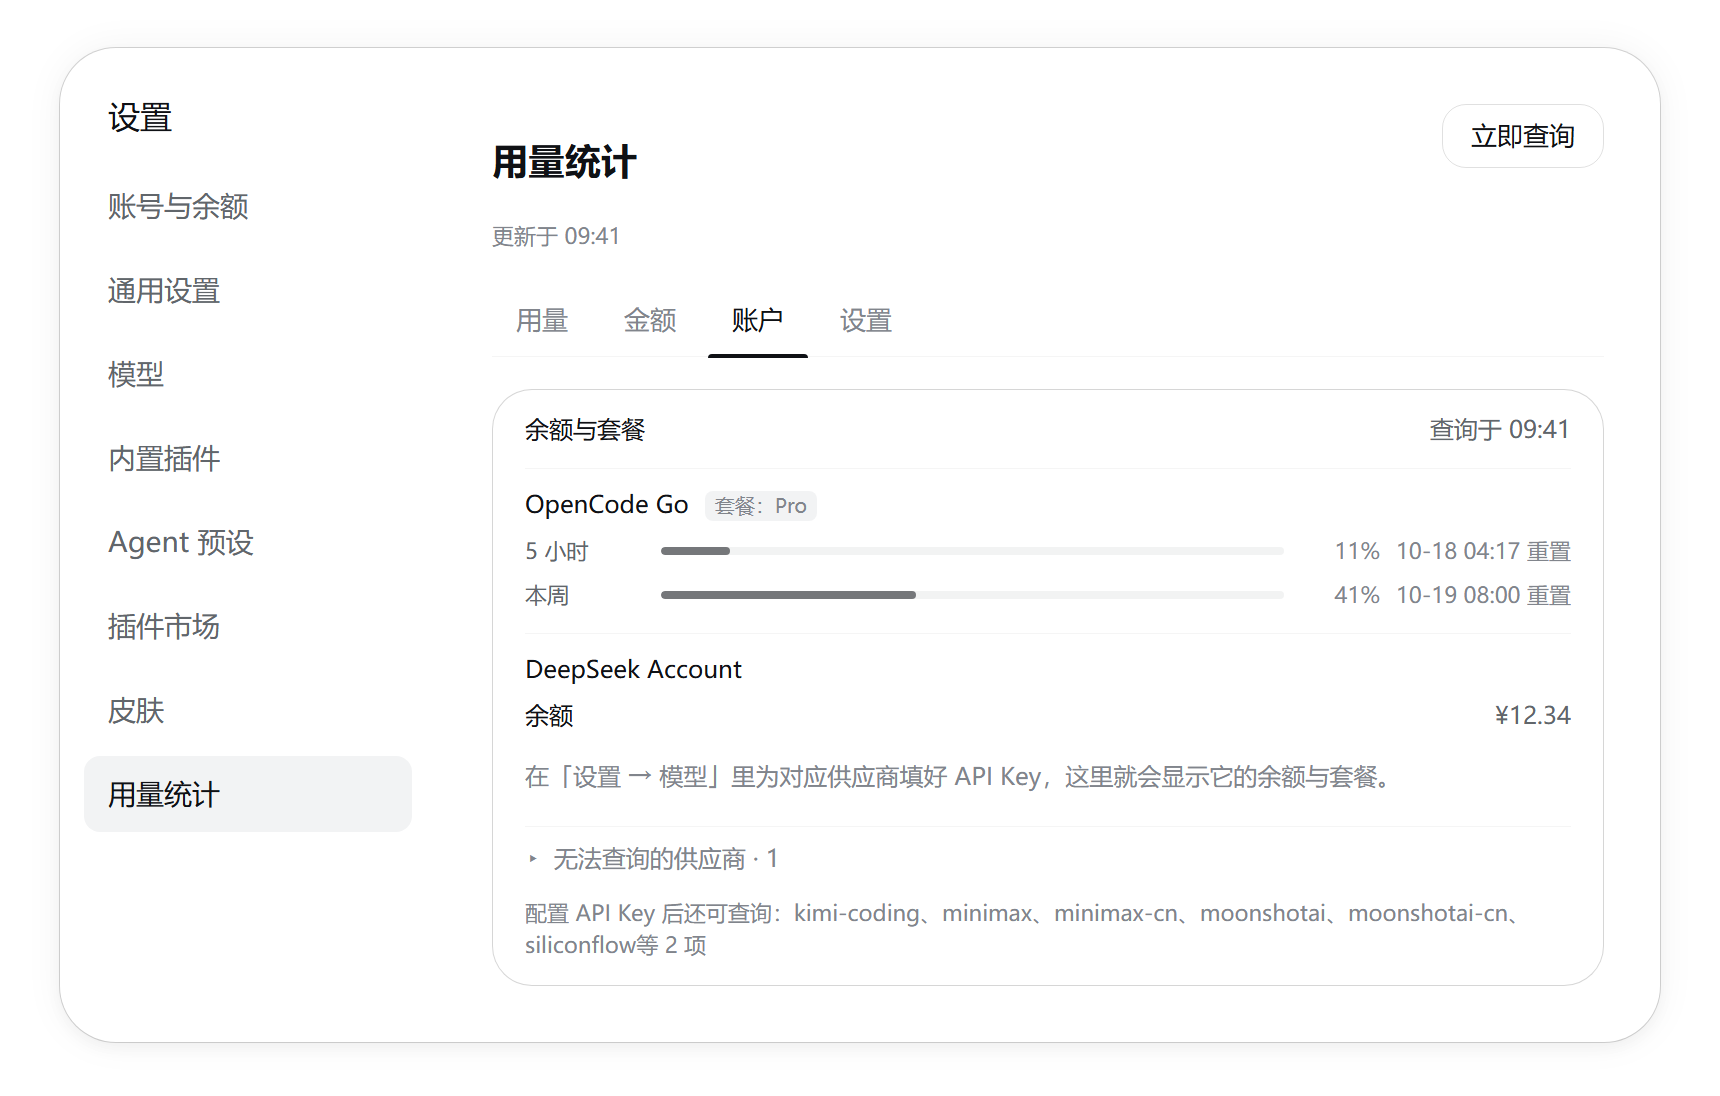
Click a shot for full size
## What it does - **Usage tab**: a row of equal-width figures (total tokens / input / output / cache read / calls — cache write only takes a column when the window actually contains some), a per-provider and per-model breakdown, and a daily chart covering the whole selected window. The range picker at the top offers today, last 7 days, last 30 days, all, or a custom span. Every card follows the selected range, and the provider bars share one scale across the page. - **Account tab**: each provider's balance and plan windows in one place — the balance in its own currency, the plan showing used percentage and reset time for the 5-hour, weekly and monthly windows. Providers that cannot be queried are folded to the bottom of the card with the reason written out (no API key, signed in with an account, non-official address, the vendor publishes no such figure). - **Cost tab**: converts the selected window's tokens into money at the price list. The scope can be everything, one provider, or one model of one provider, and a single-day window is broken down by the hour. A model with no price is never counted as zero — it is listed separately, with the number of tokens left out of the total. - **Settings tab**: usage refresh interval, the account-query switch and interval, reminder thresholds, the price list, plus the running version and the state of the history scan at the bottom. - **Low-quota reminders**: set a threshold for the balance and for each of the three plan windows; a provider that falls below gets a red dot beside its name (both on the sidebar card and on the Account tab). A threshold of 0 switches that line off. The comparison happens at read time, so a new threshold applies immediately. - **History backfill**: the plugin only records what happens while it runs. On first start it automatically replays the past sessions DSH still has on disk; if the plugin was switched off for a while you can run the scan again from the Settings tab. Replayed calls land on the day they happened, not on today. ### The chart's vertical axis The axis is **relative**: the heaviest day in the window fills the chart. An absolute scale squashes a quiet week into an invisible line, while a relative one shows the shape at a glance; the card names the anchor in its top-right corner (for example "Peak 33.3M (10-17)"), and hovering a column gives that day's total and call count. Pick "today" or a single date and this chart becomes **hourly**: a fixed 24 columns, with quiet hours drawn as nothing at all (no record and zero usage are different things), and the peak named in the corner the same way. Longer windows stay daily. ### How the cost is worked out It is the **list price** from the price table, with no discount, subscription or reseller markup applied — a reference figure, not a bill. The official DeepSeek models ship with prices; anything else can be added on the Settings tab as a line of input, output, cache-read and cache-write prices per million tokens. The built-in rows are DeepSeek's **off-peak** rates. DeepSeek bills double during 09:00-12:00 and 14:00-18:00 Beijing time on weekdays, and off-peak all day at weekends and on Chinese public holidays. Each call is judged by the moment it happened, so peak and off-peak hours in one window are each billed at their own rate. A price row can carry an **effective date**: a price rise is a second row with the day it started, and the old row still governs the history it was in force for. Leaving the date empty means "from the start". Correcting a price **changes the money reported for every call inside the range it governs**. The cost is recomputed at read time from the current table rather than stamped into the ledger as each call is folded, so fixing one price fixes that history instead of only the future. The built-in price list and holiday calendar **update themselves**: the DeepSeek pricing page is read once a day and the holiday table once a month, and both are cached locally. A fetch that fails, or a page that no longer parses, leaves the previous answer in place — and with nothing fetched at all the bundled tables stand — so an outage never moves a price. A cache write with no price of its own bills as input. A model with no price is left out of the total and reported as "N models unpriced, X tokens not counted" — treating an unknown price as zero would make the total look free, which is worse than showing nothing. ## Install Requires DSH 0.2.0-rc.2 or later. The Web GUI and the official desktop client both work. From GitHub: ```bash dsh plugin --profile desktop add git+https://github.com/SereneJi/dsh-abacus.git ``` From a local clone (the source is the artifact — edit and refresh the page, which suits hacking on it): ```bash git clone https://github.com/SereneJi/dsh-abacus.git dsh plugin --profile desktop add link:./dsh-abacus ``` Use the profile you actually run (`desktop` for the desktop client, usually `web` for `dsh web`). Host-side changes need one DSH restart; interface changes after that only need a page refresh. The settings section is at **Settings → Usage stats**. Uninstall: ```bash dsh plugin --profile desktop remove dsh-abacus ``` ## Migrating from `dsh-usage-stat` The 2.0.0 rename is not just a new title: the **plugin id, the HTTP route prefix and the state directory all changed** (`usage-stat` → `abacus`), so an old install has to be removed before the new one is added — it cannot be upgraded in place: ```bash dsh plugin --profile desktop remove dsh-usage-stat dsh plugin --profile desktop add git+https://github.com/SereneJi/dsh-abacus.git ``` The ledger survives. On its first boot, if `$DSH_HOME/abacus/` does not exist yet, the plugin copies the whole of `$DSH_HOME/usage-stat/` across before it starts recording, and leaves the old directory in place as a backup (delete it yourself once the new UI shows the right history). An existing `$DSH_HOME/abacus/` is never touched — no merging, no overwriting: picking one of two ledgers to merge is worse than losing none. Browser-side preferences from the old build (the sidebar card's expanded state, the last range preset) are carried over once, from `dsh-usage-stat.*` keys to `dsh-abacus.*`. ## Configuration Every control on the Settings tab corresponds to a key in `$DSH_HOME/abacus/config.json` (`$DSH_HOME` defaults to `~/.dsh`). | Key | Default | Meaning | | --- | --- | --- | | `enabled` | `true` | Master switch; when off nothing is recorded, probed or rendered | | `pollIntervalSec` | `60` | How often the interface refreshes usage (5–600 s) | | `probeEnabled` | `true` | Whether to query provider balances and plans | | `probeIntervalSec` | `300` | Balance and plan query interval (60–3600 s) | | `alertEnabled` | `true` | Master switch for low-quota reminders | | `alertBalanceBelow` | `0` | Remind when the balance falls below this amount; `0` disables it | | `alertWindow5h` | `0` | Remind when the 5-hour window has less than this percentage left; `0` disables it | | `alertWindowWeek` | `0` | Remind when the weekly window has less than this percentage left; `0` disables it | | `alertWindowMonth` | `0` | Remind when the monthly window has less than this percentage left; `0` disables it | | `prices` | the two official DeepSeek models | The price table: model name to per-million-token `input` / `output` / `cacheRead` / `cacheWrite`, in CNY | The price table can also be written straight into the config file, in the same shape the Settings tab shows: ```json "prices": { "deepseek-flash": { "input": 2, "output": 8, "cacheRead": 0.04, "cacheWrite": 2 } } ``` Names carrying a version or suffix — `deepseek-v4.1-flash`, `deepseek-v4-flash` — resolve to the built-in `deepseek-flash` row, so a point release does not make the price disappear. Recording is local and cheap; querying a provider goes out to the network and can be rate-limited, so the two have separate switches and intervals: with `probeEnabled` off, usage is still counted — only balances and plans stop refreshing. The comparison is strictly **below**: a balance exactly equal to the threshold, or a window with exactly the threshold left, does **not** count as a hit. A reminder also only appears when there is a figure to compare — a provider with no credential, no readable balance, or no percentage window is never marked because something could not be read. Out-of-range values are clamped and unknown keys are ignored, so editing the file by hand cannot put the plugin into a state its interface cannot express. ## Where the data lives | Path | Contents | | --- | --- | | `$DSH_HOME/abacus/usage.json` | The usage ledger | | `$DSH_HOME/abacus/providers.json` | Balance and plan snapshots | | `$DSH_HOME/abacus/upstream.json` | The fetched price list and holiday table (the bundled ones stand when a fetch fails) | | `$DSH_HOME/abacus/config.json` | Configuration | The ledger deliberately has **no retention window and no size cap**. A day's bucket is on the order of 1 KB, so a year is a few hundred KB, and any "keep only N days" or "delete past N KB" rule would one day quietly discard history you could still see. The only remaining bound is the number of session rows (5000), a guard against a runaway file rather than a budget. Provider API keys are held by DSH's own credential service, read only on the host side, and **never reach the browser**. ## Known limitations - **History backfill can only recover sessions whose DSH logs still exist** — deleted logs, or logs cleared in another workspace, cannot come back. Events without a sequence number are skipped: an event that cannot be told apart from an already-counted call is better left out than double counted. The scan is a one-shot bookmark, not a subscription: logs keep growing while the plugin runs, and that part is handled by live events. - **Balances and plans only cover providers with a known endpoint** (9 balance routes, 8 plan routes). Everything else reads "this provider does not publish this figure" rather than converting local token counts into money. - **A balance needs a readable API key.** Providers you sign into with an account (the desktop client's DeepSeek account, for instance) do not necessarily expose an open-platform balance endpoint, and the interface says so plainly. - **The cost figure is list price, not a bill.** It carries no discount, subscription or reseller markup. The built-in rows are DeepSeek's **off-peak** rates, doubled during 09:00-12:00 and 14:00-18:00 on weekdays; peak is judged in the **local time zone**, and the holiday calendar comes from the published one, so a year the State Council has not announced yet counts as ordinary weekdays. A cache write with no price of its own bills as 0, and a model with no price is reported rather than counted. - **The chart reaches back at most 366 days.** In an "all" or cross-year window the daily chart draws only the most recent 366 days, and the axis labels are month-day, so anything earlier is neither drawn nor named. - **A reminder is a mark in the interface, not a system notification**: it appears on the sidebar card and the Account tab, never as a popup or a sound. - **The per-provider breakdown of "this chat" only covers chats since the plugin was enabled.** Older chats kept a total only; the panel says so instead of attributing that total to one provider. - **The interface copy ships in zh and en**, chosen once from the browser language; it does not follow the language switch inside DSH settings. - The sidebar card depends on the sidebar's DOM structure; if it cannot find its place it degrades to appending at the end of the footer rather than crashing — the inherent cost of DOM injection. ## Licence and provenance MIT, see [LICENSE](LICENSE). The layout takes its cue from [`@linxin666/dsh-usage`](https://github.com/zhu1090093659/dsh-web) (Apache-2.0). ## Development Maintainer-facing material — where the numbers come from and how folding works, the HTTP routes, the code map, design choices, tests and the preview bench, rollback and the upgrade path — lives in [DEVELOPMENT.md](DEVELOPMENT.md).