#
#  **World Electricity Analysis Through SQL, Python And Excel**
**This depository contains the analysis of World Electricity Accsessibility and the different sources of electricity prodution for different countries. The Project's objectives were to investigate accessibility patterns for various nations,Additionally, it compared the production of various power generation sources in different regions. Moreover, it aimed to reveal some of the datasets' hidden insights. The data cleaning part was done in python, the aggregation of data and formation of tables in SQL and the analysis of data along with the visualisation in excel.**
**World Electricity Analysis Through SQL, Python And Excel**
**This depository contains the analysis of World Electricity Accsessibility and the different sources of electricity prodution for different countries. The Project's objectives were to investigate accessibility patterns for various nations,Additionally, it compared the production of various power generation sources in different regions. Moreover, it aimed to reveal some of the datasets' hidden insights. The data cleaning part was done in python, the aggregation of data and formation of tables in SQL and the analysis of data along with the visualisation in excel.**


##  **User's Manual**
| Files/Folder| Description |
| ------------- | ------------- |
| **Excel Dashboard ana Analysis** | This file contains the excel worksheets and dashboard of the insights. |
| **World Electricity IPYNB** | This file contains the ipynb code of the data cleaning part. |
| **Project SQL Queries** | This file provides SQL queries of the aggregation of the data |
| **Project PPT Files** | This file provides the powerpoint presentation which contains all the major insights and conclusions. |
| **Raw Data Files** | This folder provides the raw data for the analysis . |
| **Final CSV Files** | This folder provides the final csv files after the data cleaning. |
**User's Manual**
| Files/Folder| Description |
| ------------- | ------------- |
| **Excel Dashboard ana Analysis** | This file contains the excel worksheets and dashboard of the insights. |
| **World Electricity IPYNB** | This file contains the ipynb code of the data cleaning part. |
| **Project SQL Queries** | This file provides SQL queries of the aggregation of the data |
| **Project PPT Files** | This file provides the powerpoint presentation which contains all the major insights and conclusions. |
| **Raw Data Files** | This folder provides the raw data for the analysis . |
| **Final CSV Files** | This folder provides the final csv files after the data cleaning. |
##  Analysis
o Analysed The Accessibilty of eletricity in different countries.
o Explored the trends for the different regions and their electrification across the rural and urban areas in the country.
o Studied the growth trends of count of countires over 75% electrification over the years .
o Analysed if there is any correlation between Income group of country and their electrification across regions.
o Comparison of access to electricity post 2000s in different countries.
o Presented a way to compare every country’s performance with respect to world average for every year
o Defined a way to present the evolution of nuclear power presence based on Region and IncomeGroup.
o Analysed production of electricity across different sources (nuclear, oil, etc.) as a function of time
o Illustrated a way to calculated the average the average of electricition of countries in different areas
##
Analysis
o Analysed The Accessibilty of eletricity in different countries.
o Explored the trends for the different regions and their electrification across the rural and urban areas in the country.
o Studied the growth trends of count of countires over 75% electrification over the years .
o Analysed if there is any correlation between Income group of country and their electrification across regions.
o Comparison of access to electricity post 2000s in different countries.
o Presented a way to compare every country’s performance with respect to world average for every year
o Defined a way to present the evolution of nuclear power presence based on Region and IncomeGroup.
o Analysed production of electricity across different sources (nuclear, oil, etc.) as a function of time
o Illustrated a way to calculated the average the average of electricition of countries in different areas
##  Prior Knowledge


Prior Knowledge


##  Quick Start
1. Started with reading the JSON files in python and converting it into CSV.
2. Did the data cleaning part with the help of pandas and imported the CSVs into SQL for furthur analysis.
3. Took help of different SQL clauses like group by, order by, having etc in order to manupalate the data and get the insights out.
4. Also used some of the aggregate functions like sum, average , count along with pivot and subqueries for the aggregation of data.
5. Exported all the tables from SQL to excel and created required tables to gain some insights.
6. Created the different charts from the table for better understanding of the data
7. Also Designed a interactive dashboard from the charts for better visualisation.
8. Created some useful drop-downs for fetching the required data like count of countries with 75% electrification over the year, country-wise electricity data etc.
9. Created a powerpoint presentation with all the insights and conclusions listed with the indepth analysis.
Quick Start
1. Started with reading the JSON files in python and converting it into CSV.
2. Did the data cleaning part with the help of pandas and imported the CSVs into SQL for furthur analysis.
3. Took help of different SQL clauses like group by, order by, having etc in order to manupalate the data and get the insights out.
4. Also used some of the aggregate functions like sum, average , count along with pivot and subqueries for the aggregation of data.
5. Exported all the tables from SQL to excel and created required tables to gain some insights.
6. Created the different charts from the table for better understanding of the data
7. Also Designed a interactive dashboard from the charts for better visualisation.
8. Created some useful drop-downs for fetching the required data like count of countries with 75% electrification over the year, country-wise electricity data etc.
9. Created a powerpoint presentation with all the insights and conclusions listed with the indepth analysis.
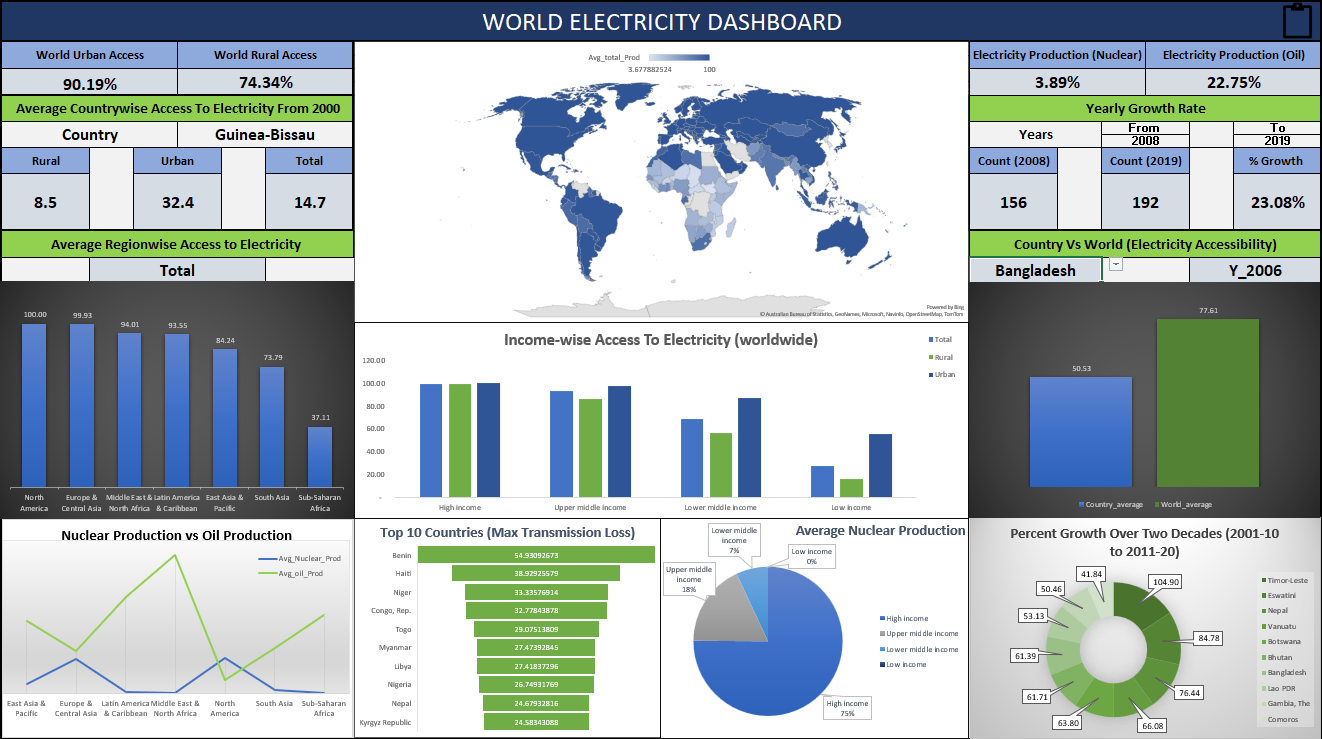
 Screenshots


##  Conclusion
1. North America And Europe have the highest average electrification in both rural and urban areas as they are among highly developed regions in the world.
Regions belonging to lower and lower middle income have comparatively lower electrification along with considerable difference of distribution between rural and urban areas.
2. There is gradual increase in number of developing countries accomplishing minimum 75% electrification over the last two decades.
3. Developed regions have increased their electricity production through nuclear sources whereas some developing regions have gradually started increasing their foothold in nuclear power generation while some regions have been unable to do so.
4. Transmission loss has been highest among the countries having poor economy, political instability , infrastructure issues and outdated technologies.
5. Countries having emphasis on tourism , geographical & demographic constraint have seen highest growth rate of electrification in the last two decades.
6. Higher income region have been in forefront of increasing renewable energy production along with nuclear sources whereas middle and lower middle countries are in gradual process.
Conclusion
1. North America And Europe have the highest average electrification in both rural and urban areas as they are among highly developed regions in the world.
Regions belonging to lower and lower middle income have comparatively lower electrification along with considerable difference of distribution between rural and urban areas.
2. There is gradual increase in number of developing countries accomplishing minimum 75% electrification over the last two decades.
3. Developed regions have increased their electricity production through nuclear sources whereas some developing regions have gradually started increasing their foothold in nuclear power generation while some regions have been unable to do so.
4. Transmission loss has been highest among the countries having poor economy, political instability , infrastructure issues and outdated technologies.
5. Countries having emphasis on tourism , geographical & demographic constraint have seen highest growth rate of electrification in the last two decades.
6. Higher income region have been in forefront of increasing renewable energy production along with nuclear sources whereas middle and lower middle countries are in gradual process.
