[简体中文](./README.md) | English
MyPerf4J
A high performance, non-intrusive Java performance monitoring and statistical tool designed for high-concurrency, low-latency applications.
[](https://github.com/LinShunKang/MyPerf4J) [](https://app.travis-ci.com/LinShunKang/MyPerf4J) [](https://coveralls.io/github/LinShunKang/MyPerf4J?branch=develop) [](https://github.com/LinShunKang/MyPerf4J/issues) [](https://github.com/LinShunKang/MyPerf4J/issues?q=is%3Aissue+is%3Aclosed) [](./LICENSE)
## Features
* [High performance](https://github.com/LinShunKang/MyPerf4J/wiki/Overhead): Very low performance consumption, only **63 nano seconds** per record, can be used in production environment for a long time.
* No intrusion: Using **JavaAgent** mode, no intrusion to the application, no need to modify the application code.
* Low memory: With memory multiplexing, only a small number of temporary objects are generated throughout the life cycle, and the GC of the application is not affected.
* Real-time: Supports second level monitoring, minimum **1 second**
## Usage scenarios
* Quickly locate performance bottlenecks for Java applications in a development environment
* Long-term monitoring of performance metrics for Java applications in a production environment
## Multilingual document
* [English Doc](https://github.com/LinShunKang/MyPerf4J/wiki/English-Doc)
* [中文文档](https://github.com/LinShunKang/MyPerf4J/wiki/Chinese-Doc)
## What does it monitor?
MyPerf4J collects dozens of metrics per application. All these metrics are collected and visualized in real-time.
This is a list of what it currently monitors:
* **[Method Metrics](https://grafana.com/dashboards/7766)**
[RPS, Count, Avg, Min, Max, StdDev, TP50, TP90, TP95, TP99, TP999, TP9999, TP100](https://github.com/LinShunKang/MyPerf4J/wiki/Metrics#method-metrics)
- **[JVM Metrics](https://grafana.com/dashboards/8787)**
[Thread](https://github.com/LinShunKang/MyPerf4J/wiki/Metrics#jvm-thread-metrics),[Memory](https://github.com/LinShunKang/MyPerf4J/wiki/Metrics#jvm-memory-metrics),[ByteBuff](https://github.com/LinShunKang/MyPerf4J/wiki/Metrics#jvm-bytebuff-metrics),[GC](https://github.com/LinShunKang/MyPerf4J/wiki/Metrics#jvm-gc-metrics),[Class](https://github.com/LinShunKang/MyPerf4J/wiki/Metrics#jvm-class-metrics),[Compilation](https://github.com/LinShunKang/MyPerf4J/wiki/Metrics#jvm-compilation-metrics),[FileDescriptor](https://github.com/LinShunKang/MyPerf4J/wiki/Metrics#jvm-filedescriptor-metrics)
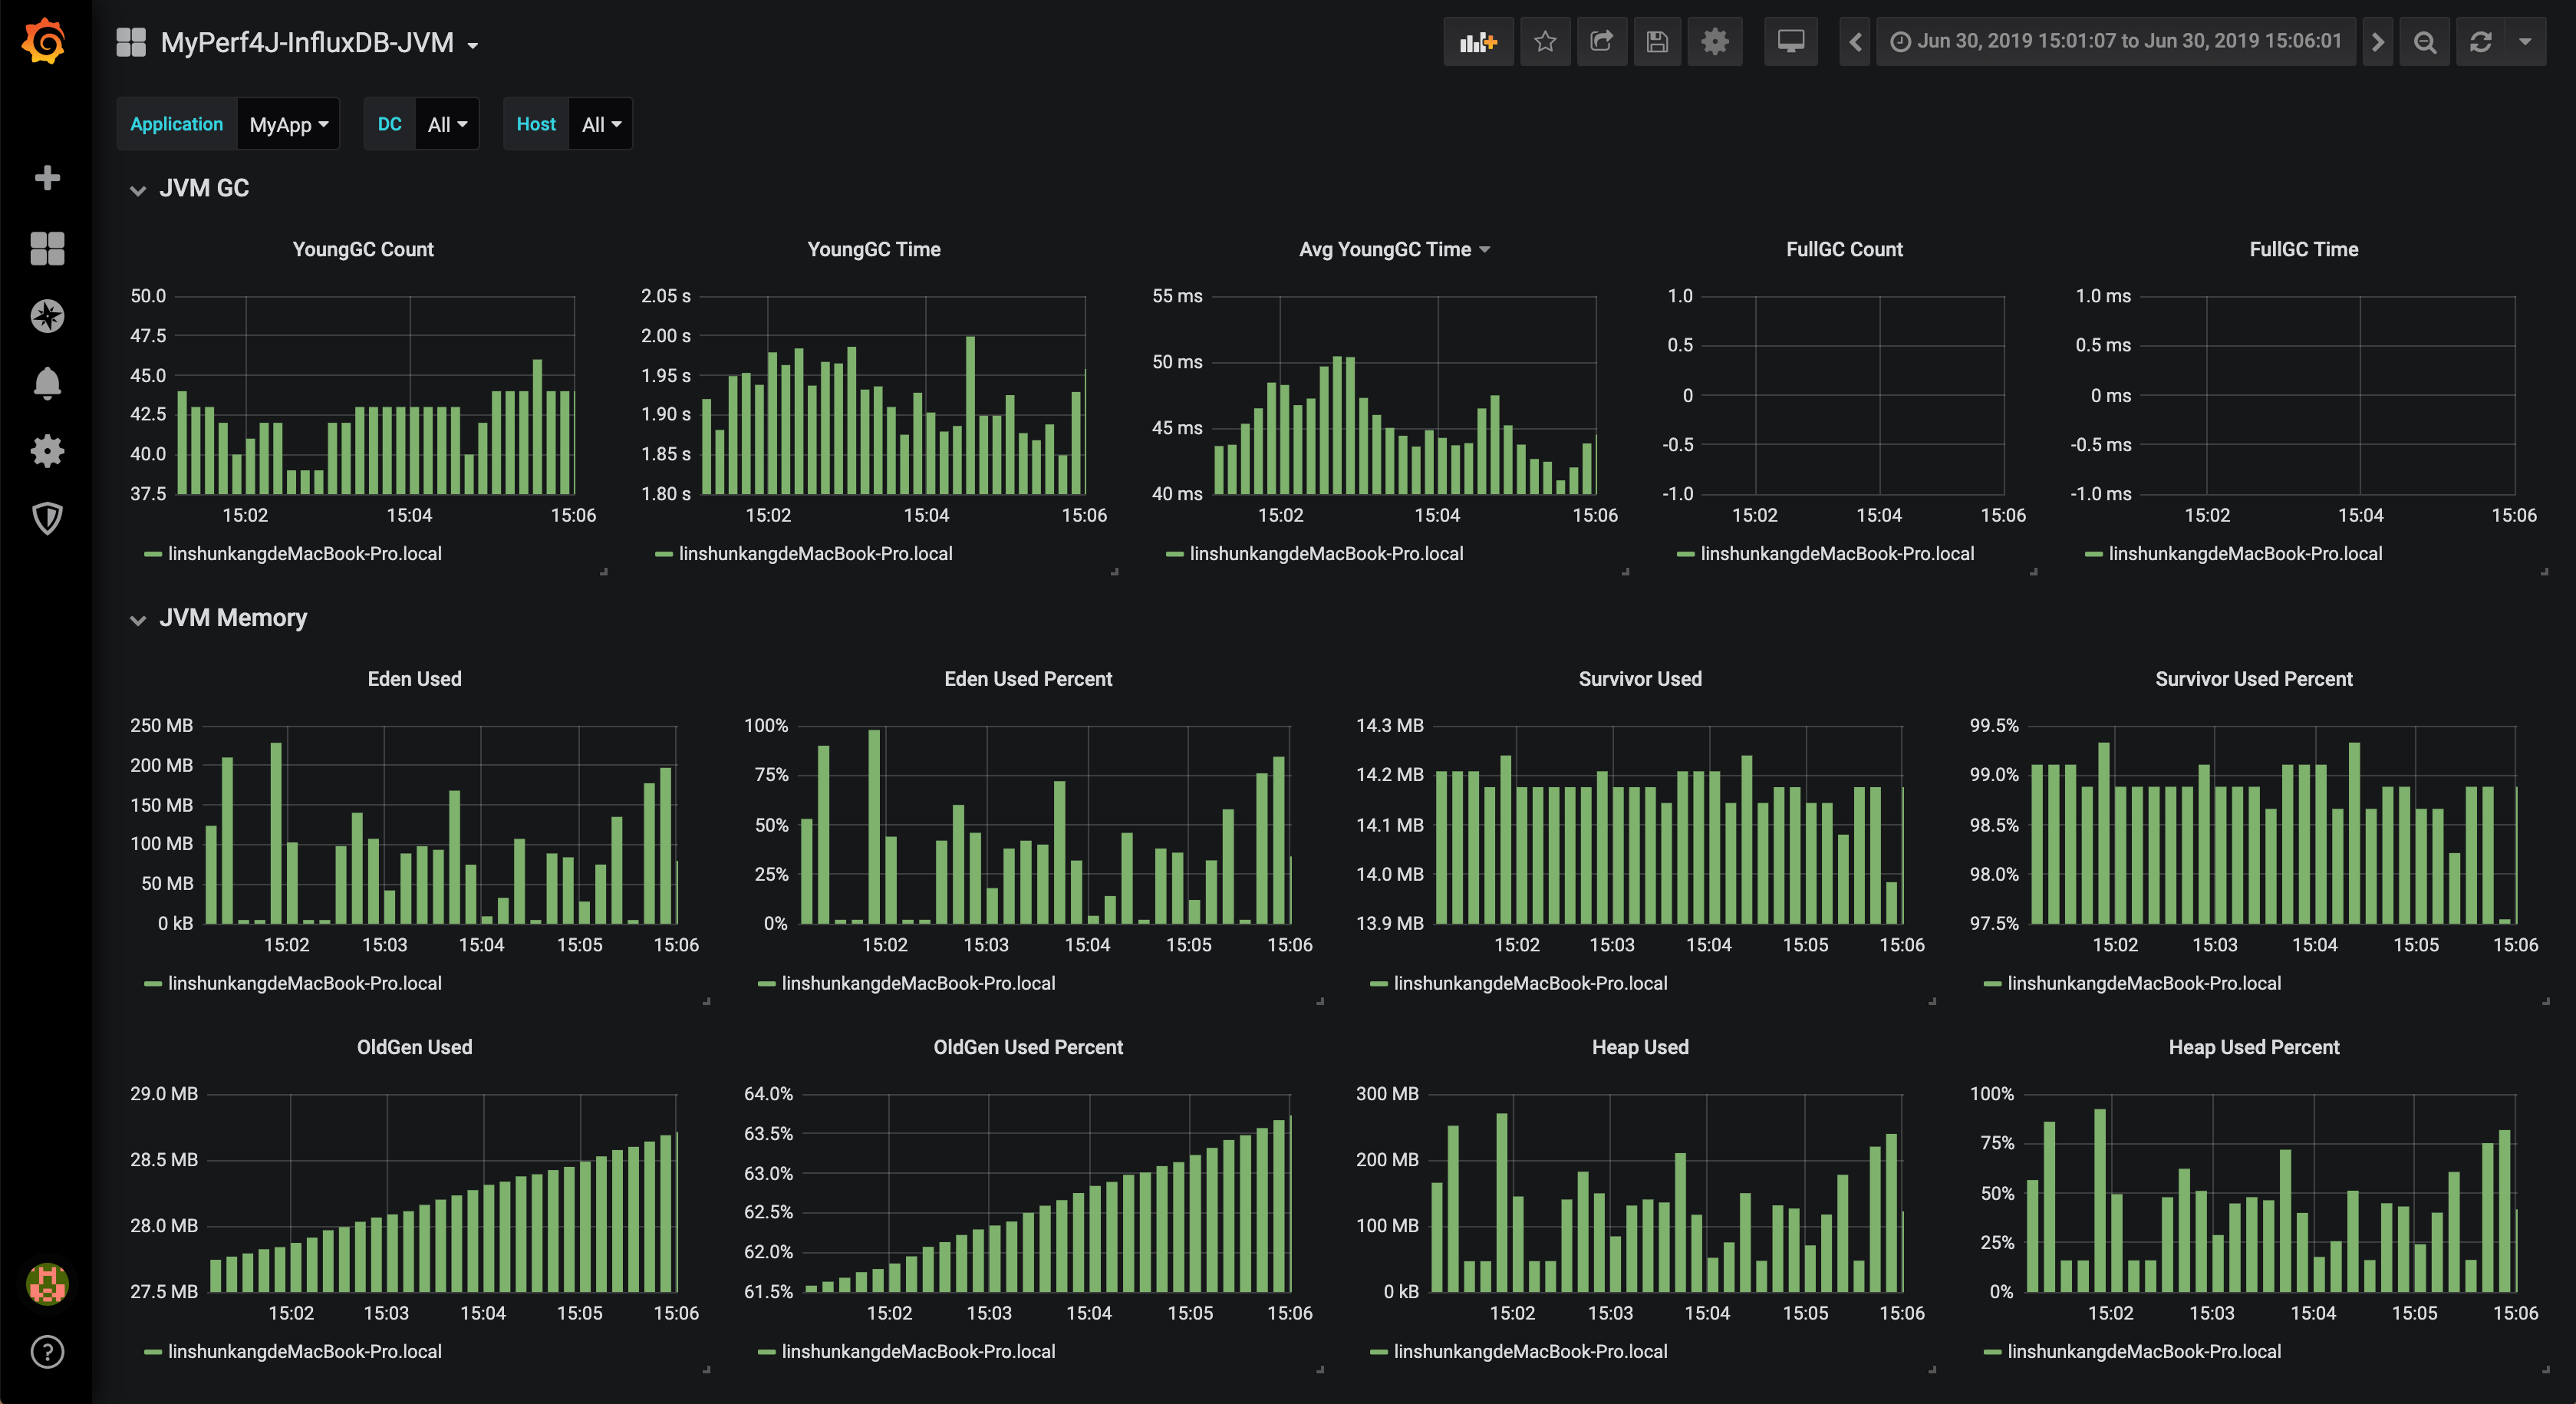
> Want to know how to achieve the above effect? Please start the application according to the description of [Quick Start](https://github.com/LinShunKang/MyPerf4J/blob/develop/README.EN.md#quick-start), and then follow the instructions in [here](https://github.com/LinShunKang/MyPerf4J/wiki/InfluxDB) to install and configure.
## Quick start
MyPerf4J adopts JavaAgent configuration mode, **transparent** access application, and the application code is completely **no-intrusive**.
### Download
* Download and unzip [MyPerf4J-ASM.zip](https://github.com/LinShunKang/Objects/blob/master/zips/EN/MyPerf4J-ASM-3.6.0.zip?raw=true)
* Read the `README` file
* Modify `app_name`, `metrics.log.xxx` and `filter.packages.include` in `MyPerf4J.properties`
### Configure
Add the following two parameters to the JVM startup parameters
* -javaagent:/path/to/MyPerf4J-ASM.jar
* -DMyPerf4JPropFile=/path/to/MyPerf4J.properties
> Like: java -javaagent:/path/to/MyPerf4J-ASM.jar -DMyPerf4JPropFile=/path/to/MyPerf4J.properties `-jar yourApp.jar`
>
> Note: If you are using JDK 9 and above, please add `--add-opens java.base/java.lang=ALL-UNNAMED` as an additional flag.
### Run
Start your application, the output is to /path/to/log/method_metrics.log:
```
MyPerf4J Method Metrics [2020-01-01 12:49:57, 2020-01-01 12:49:58]
Method[6] Type Level TimePercent RPS Avg(ms) Min(ms) Max(ms) StdDev Count TP50 TP90 TP95 TP99 TP999 TP9999
DemoServiceImpl.getId2(long) General Service 322.50% 6524 0.49 0 1 0.50 6524 0 1 1 1 1 1
DemoServiceImpl.getId3(long) General Service 296.10% 4350 0.68 0 1 0.47 4350 1 1 1 1 1 1
DemoServiceImpl.getId4(long) General Service 164.60% 2176 0.76 0 1 0.43 2176 1 1 1 1 1 1
DemoServiceImpl.getId1(long) General Service 0.00% 8704 0.00 0 0 0.00 8704 0 0 0 0 0 0
DemoDAO.getId1(long) DynamicProxy DAO 0.00% 2176 0.00 0 0 0.00 2176 0 0 0 0 0 0
DemoDAO.getId2() DynamicProxy DAO 0.00% 2176 0.00 0 0 0.00 2176 0 0 0 0 0 0
```
### Uninstall
Remove the following two parameters from the JVM startup parameters and restart to uninstall the tool.
* -javaagent:/path/to/MyPerf4J-ASM.jar
* -DMyPerf4JPropFile=/path/to/MyPerf4J.properties
## Build
You can build MyPerf4J-ASM.jar by yourself.
* git clone git@github.com:LinShunKang/MyPerf4J.git
* mvn clean package
> MyPerf4J-ASM-${MyPerf4J-version}.jar at MyPerf4J-ASM/target/
## Issues
If you encounter any issues or if you have a question, don't hesitate to [create an issue](https://github.com/LinShunKang/MyPerf4J/issues/new/choose) or [send email](mailto:linshunkang.chn@gmail.com) : )
## Known Users
Welcome to register the company name in this issue: [https://github.com/LinShunKang/MyPerf4J/issues/30](https://github.com/LinShunKang/MyPerf4J/issues/30) (In order of registration)
## Thanks
Thanks JetBrains support provided by [OpenSourceSupport](https://www.jetbrains.com/community/opensource/#support) : )
## Inspired by
* [Perf4J](https://github.com/perf4j/perf4j)
* [TProfiler](https://github.com/alibaba/TProfiler)
## More Information
For more information about the project, please read [https://github.com/LinShunKang/MyPerf4J/wiki/English-Doc](https://github.com/LinShunKang/MyPerf4J/wiki/English-Doc).