# IS-IS Topology Watcher
IS-IS Watcher is a monitoring tool of IS-IS topology changes for network engineers. It works via passively listening to IS-IS control plane messages through either a specially established IS-IS adjacency (GRE mode) or by receiving BGP-LS updates from a network router (BGP-LS mode). The tool logs IS-IS events and/or export by Logstash to **Elastic Stack (ELK)**, **Zabbix**, **WebHooks** and **Topolograph** monitoring dashboard for keeping the history of events, alerting, instant notification. By encapsulating the solution's elements in containers, it becomes exceptionally quick to start.
## Quick start
1. On a Docker host, install Topolograph and the watcher compose files:
```bash
curl -O https://raw.githubusercontent.com/Vadims06/topolograph-docker/master/install.sh
chmod +x install.sh
sudo ./install.sh
```
2. `cp .env.template .env`, then set `TOPOLOGRAPH_HOST` and `TOPOLOGRAPH_PORT` to the host IP (not `localhost`).
3. Pick a deployment size in [How to connect IS-IS watcher to real network](#how-to-connect-is-is-watcher-to-real-network).
No events on the dashboard? Start with [Troubleshooting](#troubleshooting).
## IS-IS Watcher detects the following network events:
* IS-IS neighbor adjacency Up/Down
* IS-IS link cost changes
* IS-IS networks appearance/disappearance from the topology
* IS-IS TE attributes:
* Administrative Group (color, resource class)
* Maximum Link Bandwidth
* Maximum Reservable Link Bandwidth
* Unreserved Bandwidth
* Traffic Engineering Default Metric
## Architecture
### Connection Modes
IS-IS Watcher supports two connection modes:
#### GRE Mode (Traditional)
The FRR container is isolated in an individual network namespace and establishes an IS-IS adjacency over a GRE tunnel with a network device. The **XDP IS-IS filter** inspects all outgoing IS-IS advertisements. It checks if FRR instance advertises only locally connected network (assigned on GRE tunnel) and no more. If it advertises multiple networks, IS-IS LSP will be dropped. It prevents the network from populating by unexpected network prefixes.
#### BGP-LS Mode (New)
The watcher connects to a network router via BGP-LS (BGP Link-State) protocol. The router must be configured to advertise IS-IS topology information via BGP-LS. The watcher uses GoBGP (bgplswatcher) to establish a BGP session and receive BGP-LS updates, which are then processed by the IS-IS watcher component. This mode eliminates the need for GRE tunnels and IS-IS adjacencies, making it easier to deploy in environments where GRE tunnels are not feasible.
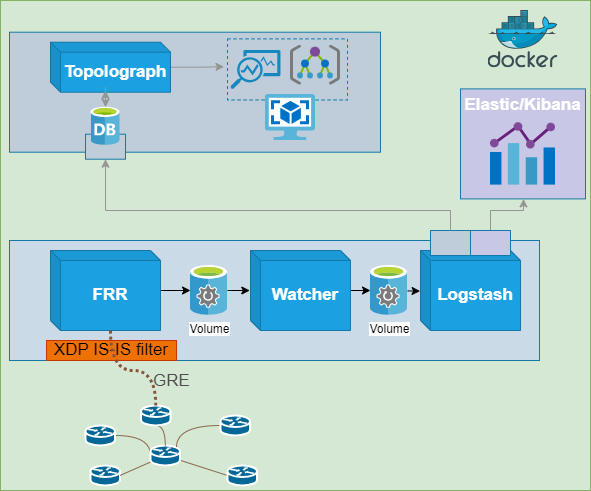
> [!NOTE]
> isiswatcher:v1.0 is compatible with [topolograph:v2.38](https://github.com/Vadims06/topolograph/releases/tag/v2.38)
> , it means that IS-IS network changes can be shown on the network graph.
### Functional Role
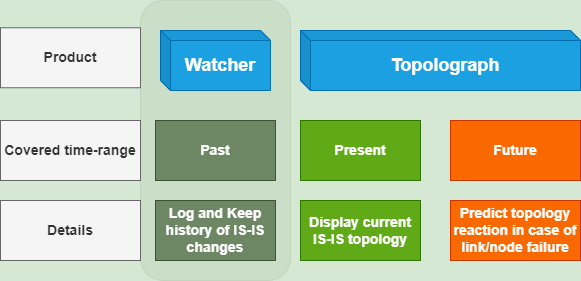
Watcher stores topology events/state to show historical network state, whereas Topolograph exhibits present network state and potential future outcomes.
### Supported IS-IS TLV
| TLV name | TLV | subTLV |
|----------------------------------|-----|------------------------|
| IS Reachability | 2 | |
| Extended IS Reachability (new) | 22 | 3,6,8,9,10,11,12,13,18 |
| IPv4 Internal Reachability (old) | 128 | |
| IPv4 External Reachability (old) | 130 | |
| Extended IPv4 Reachability (new) | 135 | |
| IPv6 Reachability | 236 | |
### Network architecture
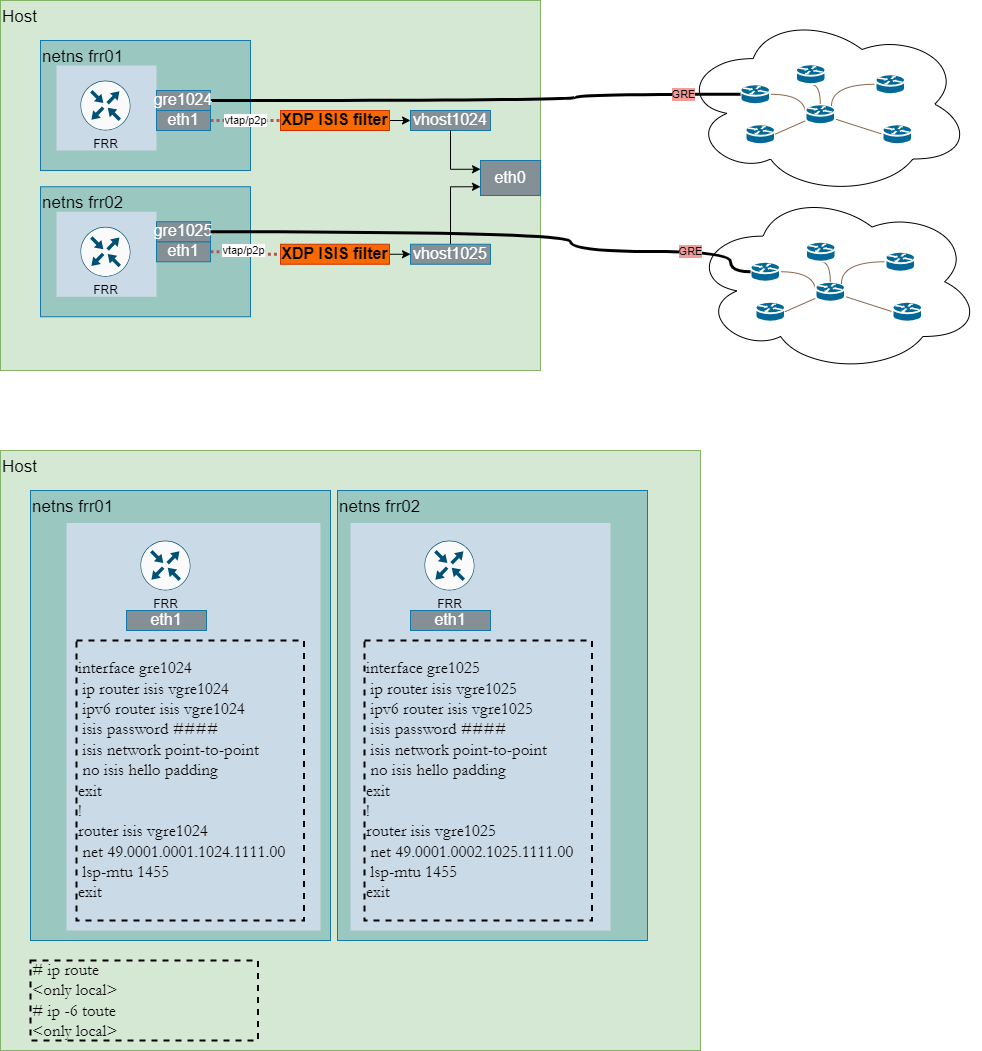
**GRE Mode**: Number of watchers is equal to the number of IS-IS areas and each Watcher is placed in individual network namespace. IS-IS LSDB sits in watcher's namespace and doesn't interact with other Watchers keeping it isolated.
**BGP-LS Mode**: Each watcher connects to a BGP-LS capable router. Multiple watchers can connect to the same router if it advertises multiple IS-IS areas, or each watcher can connect to different routers.
## Demo
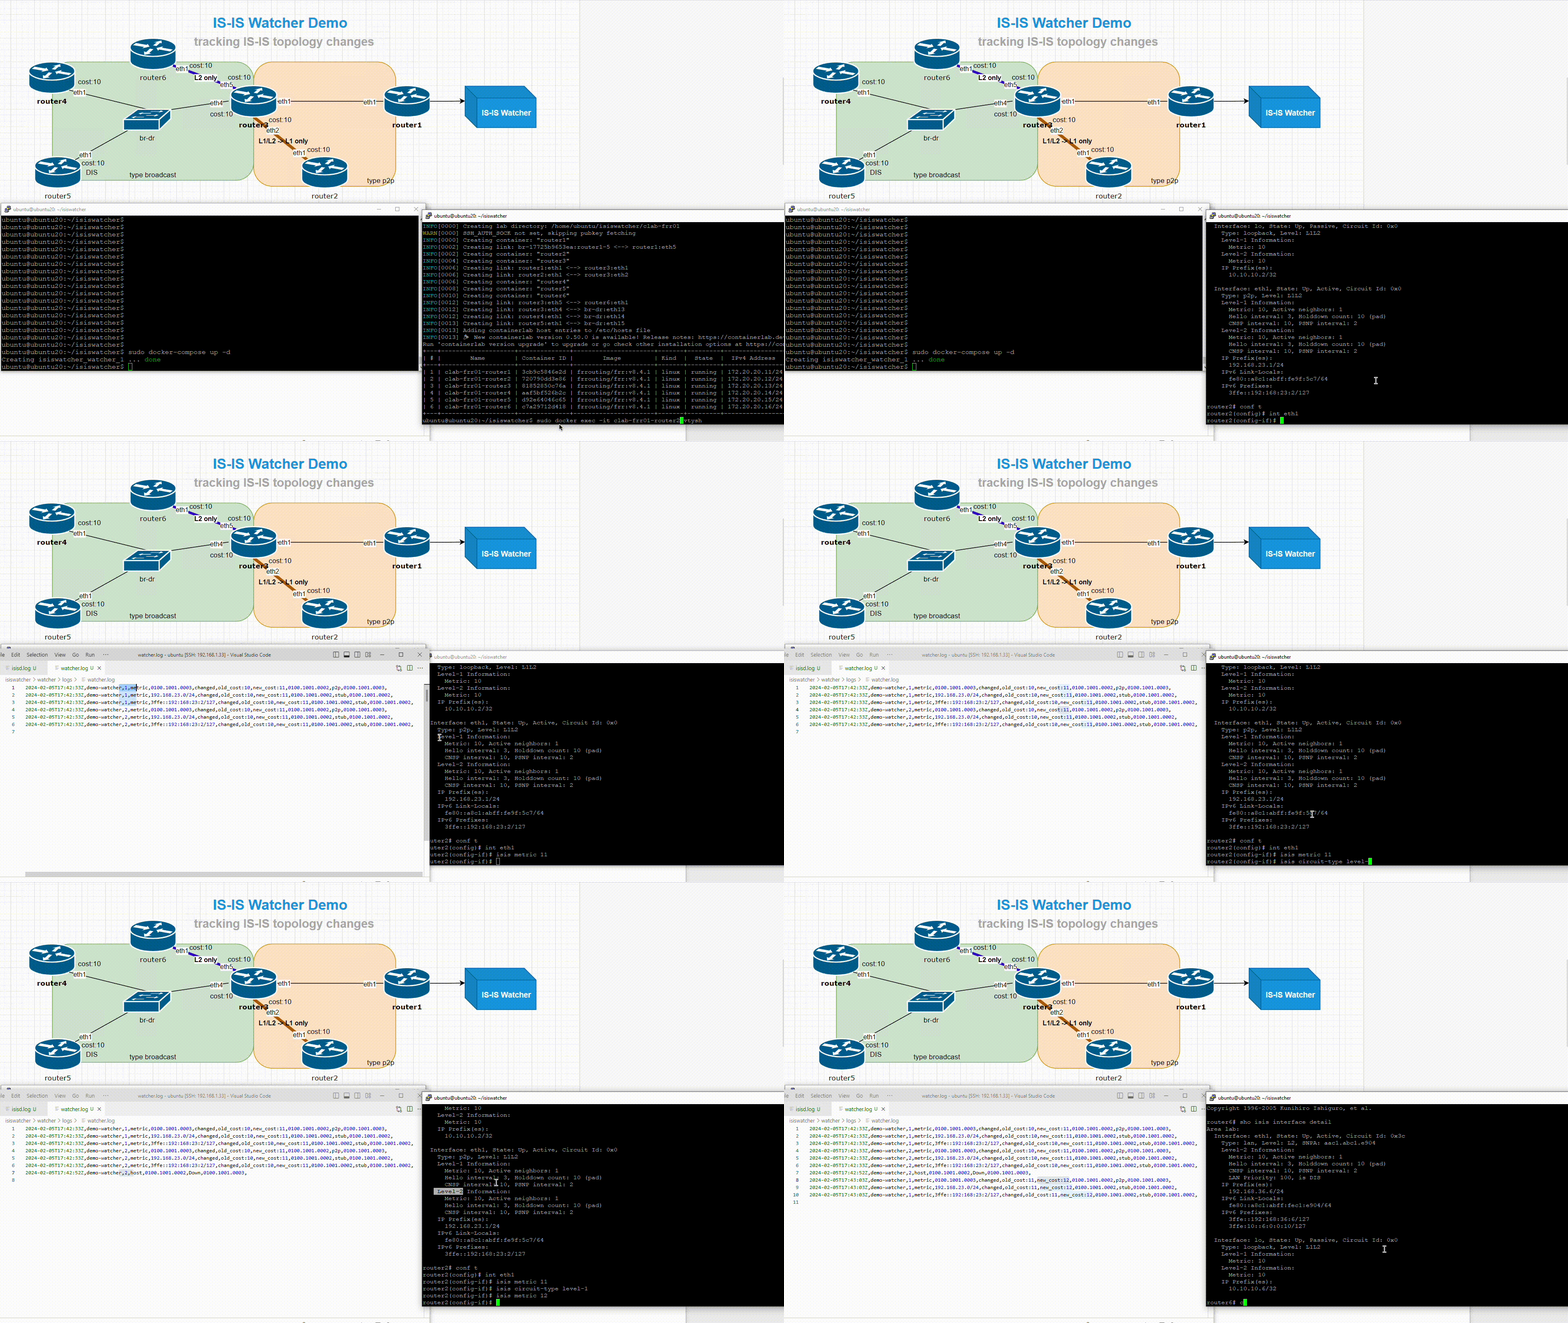
The demo shows how IS-IS watcher detected:
* p2p links:
1. metric cost changes on eth1 interface on router2 from 10 to 11. There were three duplicated logs for each level: L1 and L2.
2. 0100.1001.0002 (router2) went down for L2 after applying "isis circuit-type level-1" on it and router3 detected that.
3. metric cost changes on eth1 interface on router2 from 11 to 12 only for L1.
* broadcast links:
4. new stub network was added on router6 in L2
5. 0100.1001.0004 went down and 0100.1001.0005 (router5) detected that
## Discovering IS-IS logs in Kibana. Examples
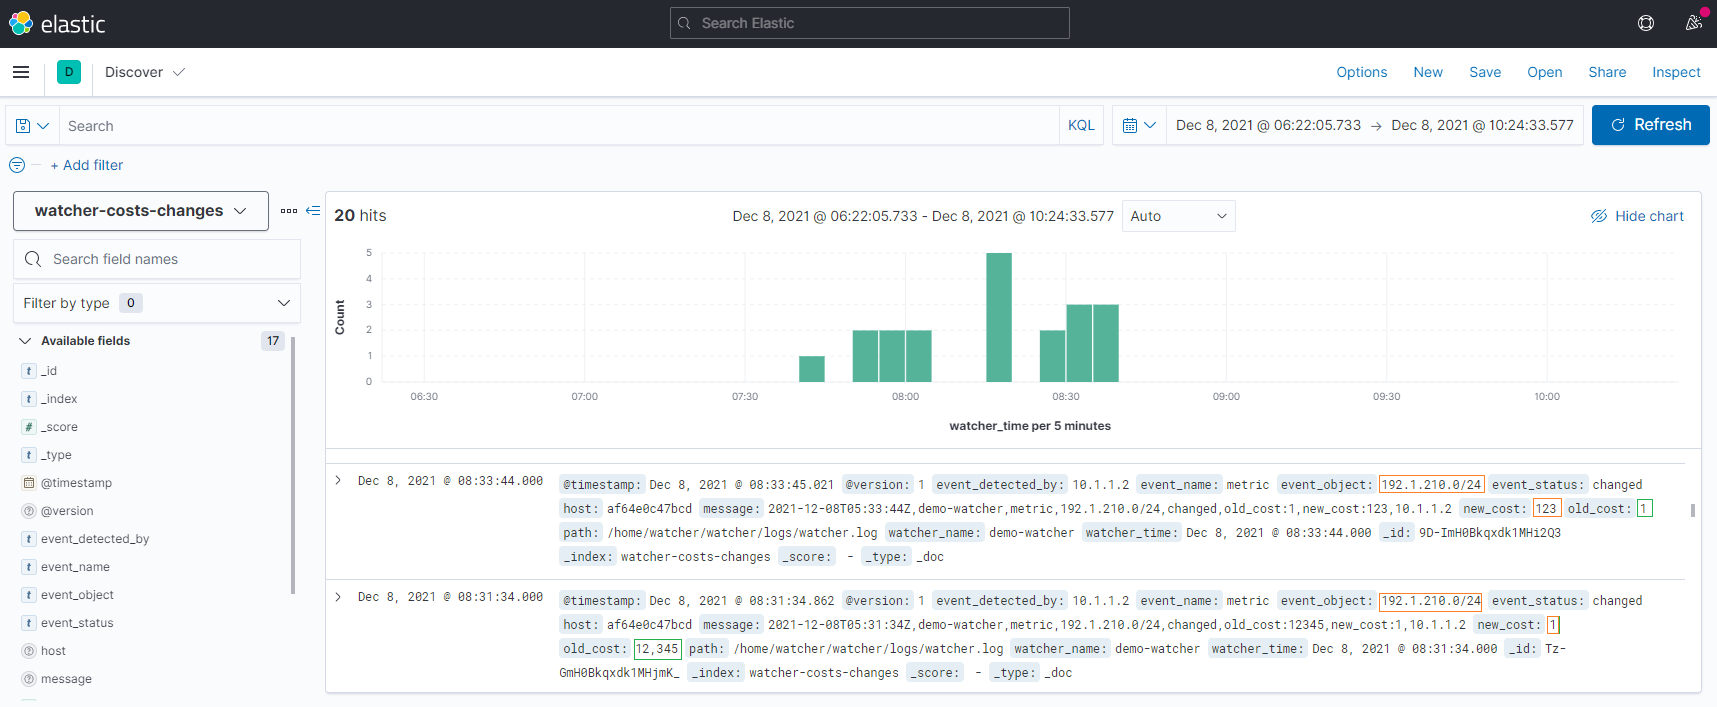
#### Cost attribute, metric
IS-IS cost changes on links
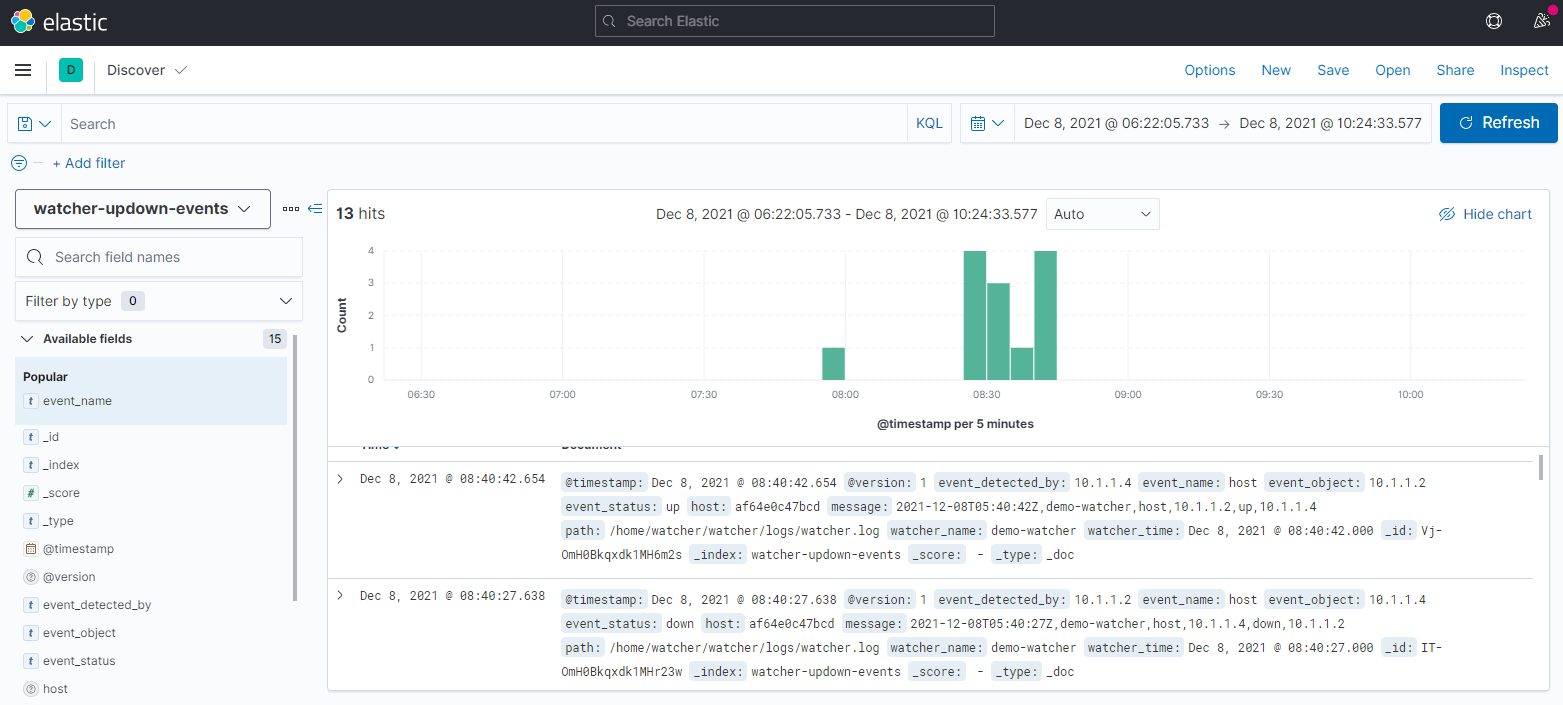
#### IS-IS adjacency
Logs if IS-IS adjacency was Up/Down or any networks appeared/disappeared.
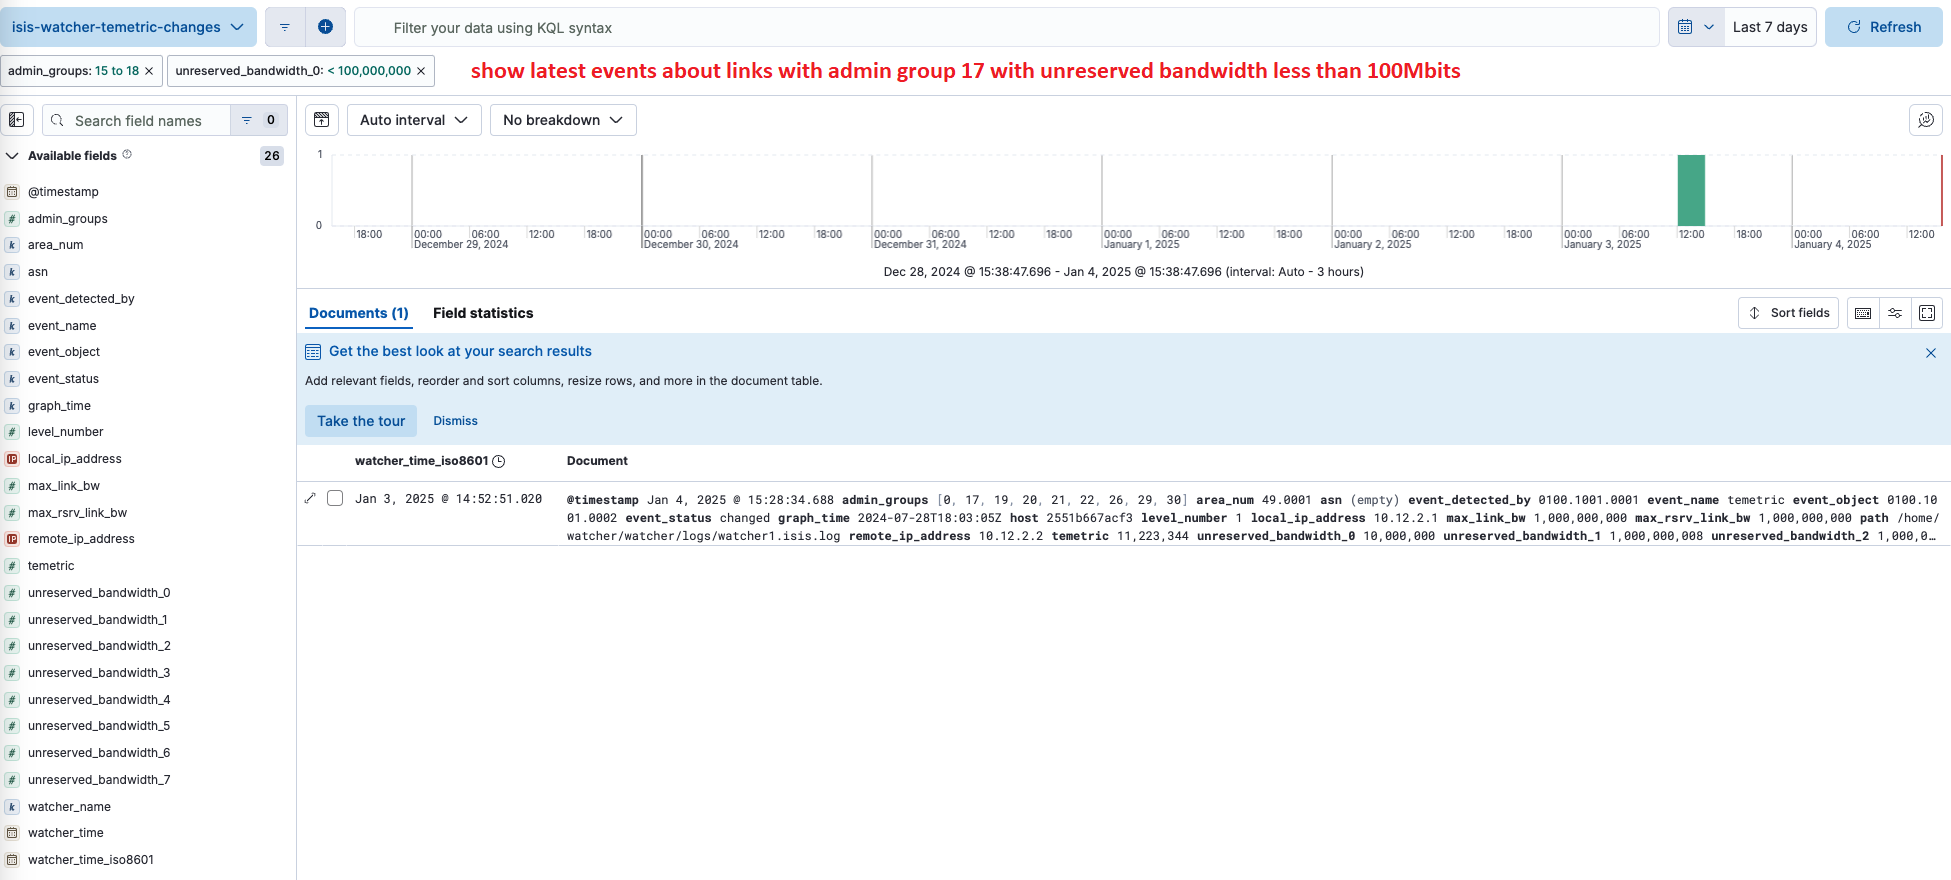
#### IS-IS TE metric
Latest events about links with admin group **17** with unreserved bandwidth for priority of 0 less than 100Mbits
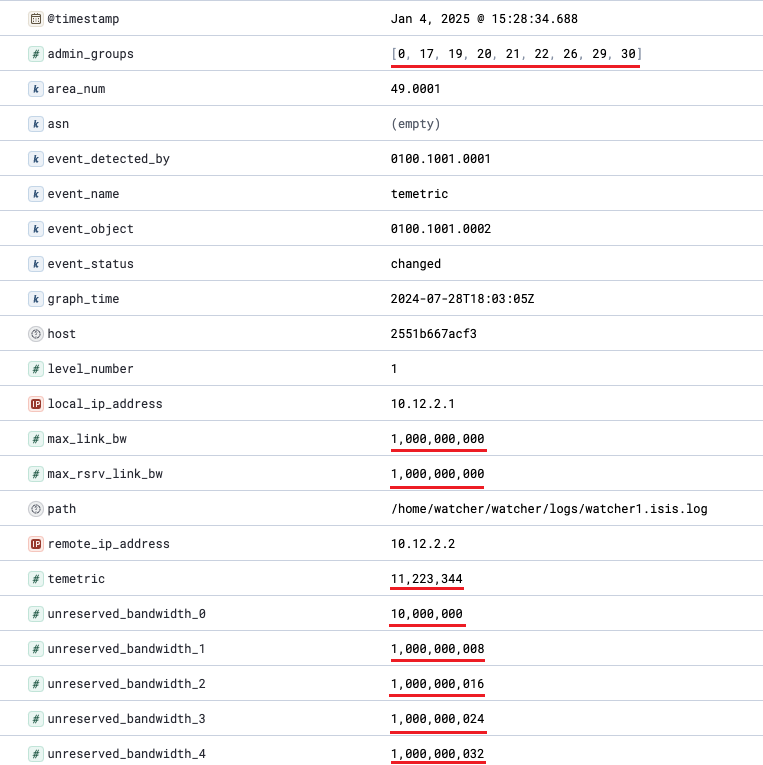
#### Full IS-IS TE log
#### Topolograph IS-IS Monitoring.
Monitoring dashboard allows to see events on the timeline and on the topology. Red timelines show link (~adjacency) down events, green one - up link (~adjacency).
Events are grouped by IS-IS level (L1/L2).
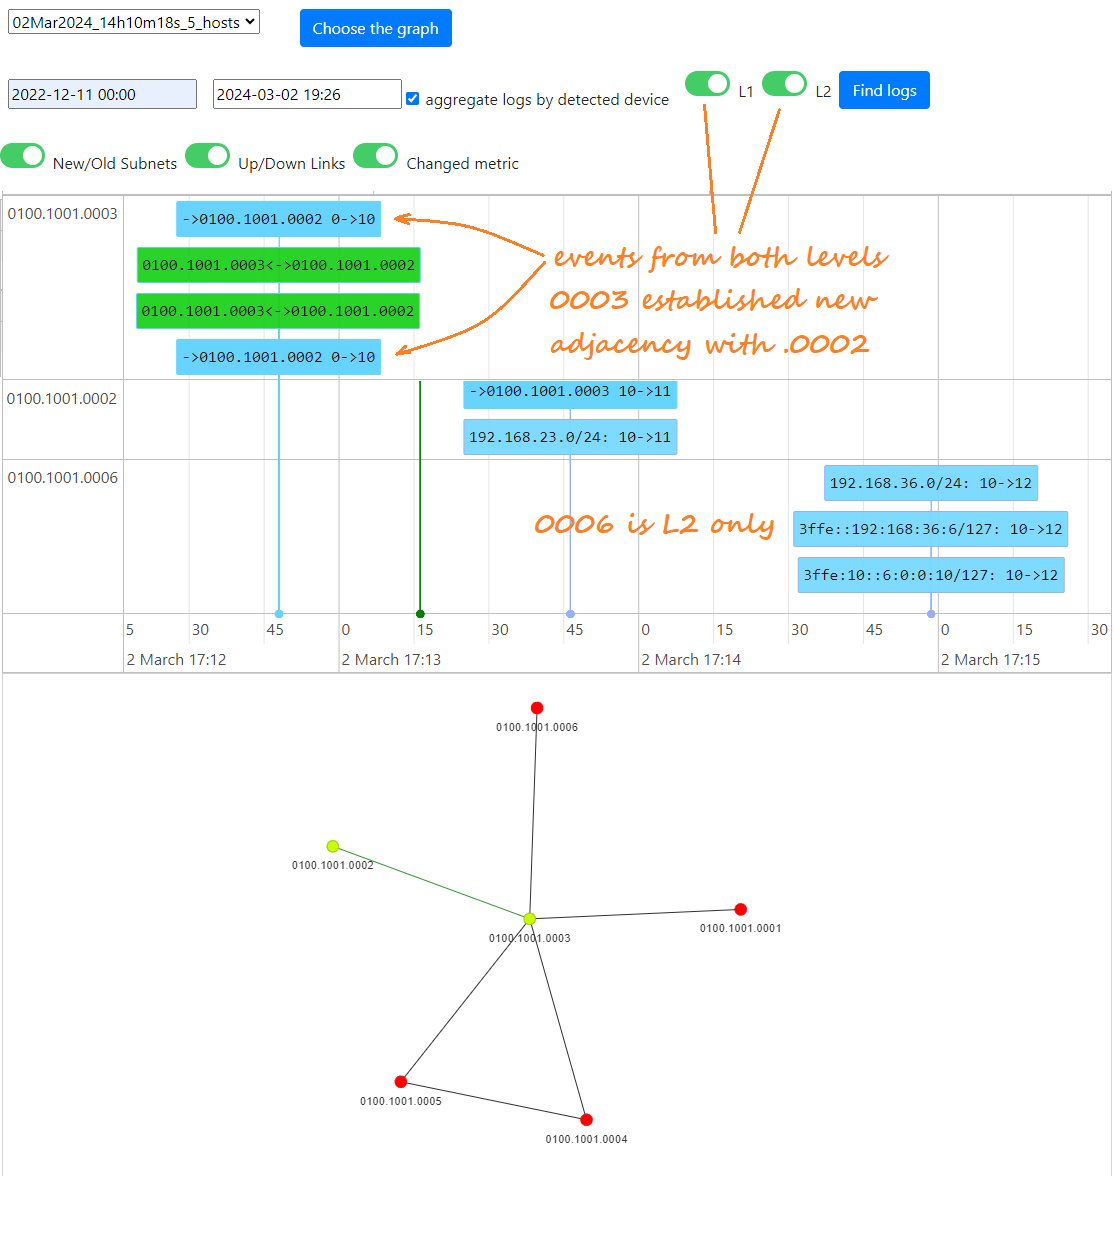
Here is a demo of checking events on Monitoring dashboard `./docs/isisdemo_with_topolograph_au.mp4`
## Watcher Heartbeats
isiswatcher can periodically POST a heartbeat to Topolograph so the UI displays all registered IS-IS watchers with their liveness status (`up` / `stale` / `down`), independent of whether the network is producing topology events.
### Prerequisites
- Topolograph v3.x or later
- One shared Topolograph user account per organisation (all watchers must use the same API token so they appear together in the UI)
### Setup
**Step 1 — Generate an API token in Topolograph**
Log in to Topolograph → **Settings → API Tokens → Create token**. Copy the `sk-...` value.
**Step 2 — Provision the watcher**
When running `client.py --action add_watcher`, you will be prompted:
```
Topolograph API token (sk-..., leave empty to skip heartbeats):
```
Paste the `sk-...` token. It will be written to the watcher container's environment automatically.
To add a token to an existing watcher, edit the watcher's `config.yml` and add `TOPOLOGRAPH_API_TOKEN: sk-...` under the watcher node's `env` block, then redeploy.
**Step 3 — Verify**
After the watcher starts, check Topolograph UI → **Watchers** tab. The watcher should appear with status `up` within one `HEARTBEAT_INTERVAL` (default: 60 seconds).
### Status values
| Status | Meaning |
|--------|---------|
| `up` | Last heartbeat received within `HEARTBEAT_INTERVAL × 3` seconds |
| `stale` | Last heartbeat older than `× 3` but within `× 6` seconds |
| `down` | No heartbeat for more than `× 6` seconds, or watcher never connected |
### Environment variables
| Variable | Default | Description |
|----------|---------|-------------|
| `TOPOLOGRAPH_API_TOKEN` | _(empty)_ | Bearer token from Topolograph UI. If empty, heartbeats are disabled. |
| `HEARTBEAT_INTERVAL` | `60` | Seconds between heartbeats. |
### Multi-watcher organisations
All watchers belonging to the same organisation should use the **same API token** (generated under one shared service account). This ensures all watchers appear together under `GET /api/watcher/status` in the Topolograph UI. IS-IS and OSPF watchers sharing the same Topolograph account will all appear in the same Watchers view.
## IS-IS topology change notification/alarming via Zabbix. Examples
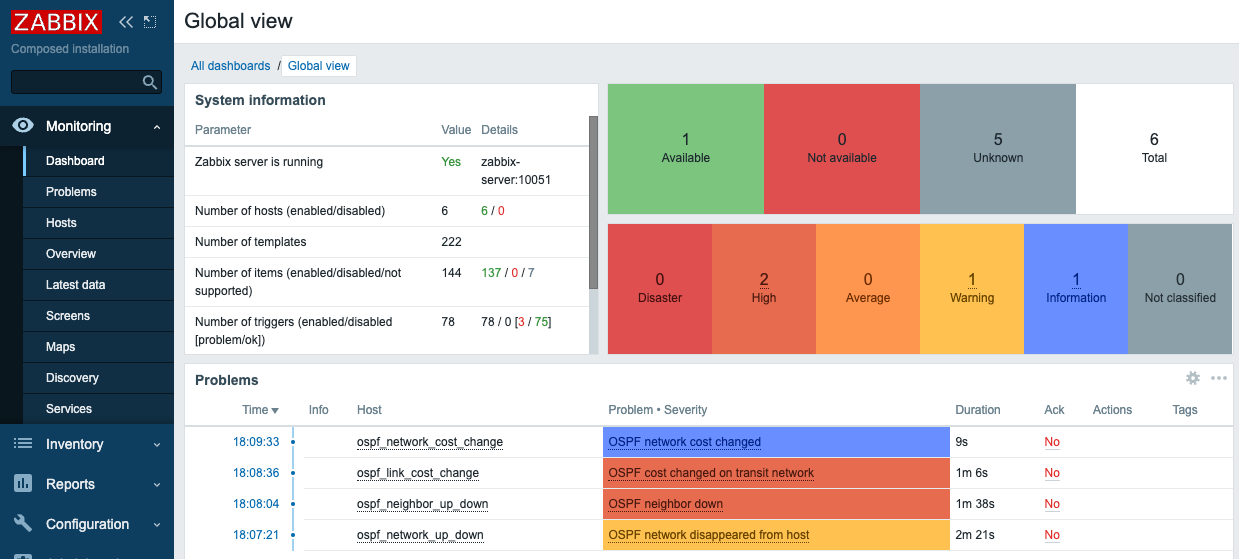
Zabbix's dashboard with active alarms. It's universal method to track OSPF and IS-IS events. *The screenshot is taken from OSPF watcher.*
#### Zabbix IS-IS neighbor up/down alarm
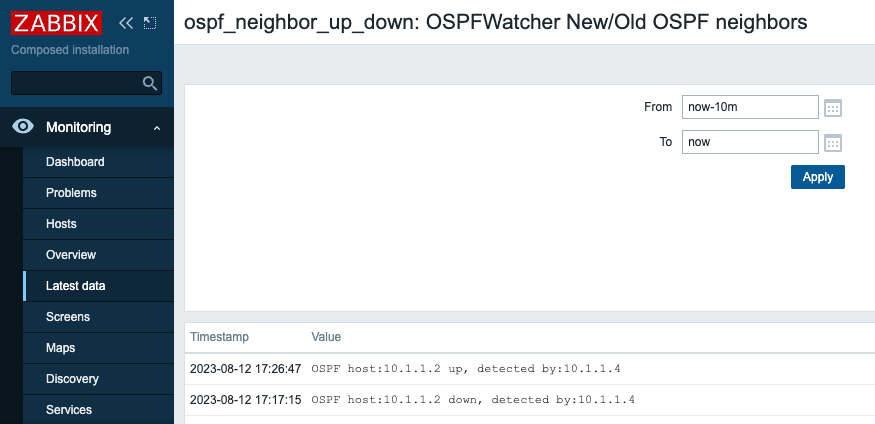
This alarm tracks all new IS-IS/OSPF adjacencies or when a device loses its neighbor. *The screenshot is taken from OSPF watcher.*
#### Zabbix IS-IS Cost changed on transit links
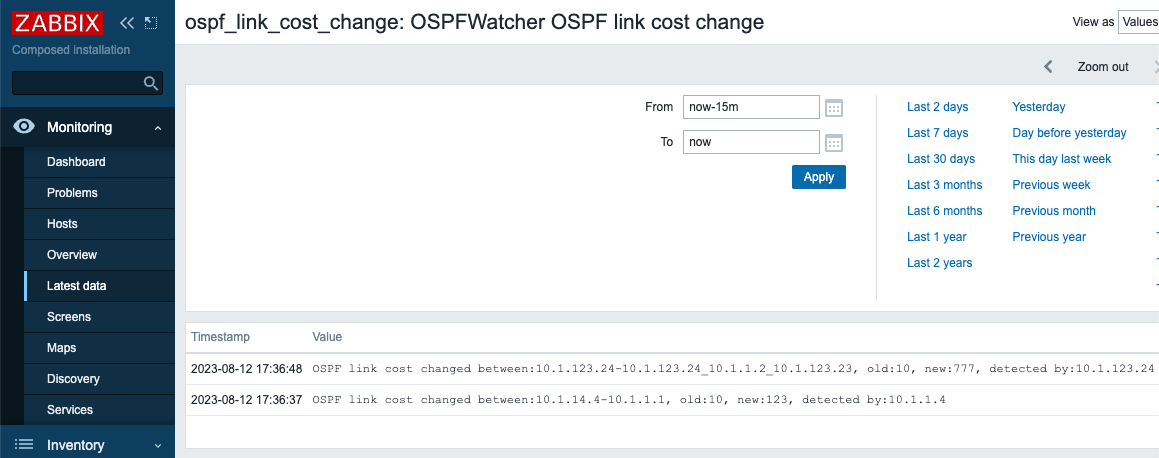
Transit links are all links between active IS-IS/OSPF neighbors. If cost on a link was changed it might affect all actual/shortest paths traffic follows. *The screenshot is taken from OSPF watcher.*
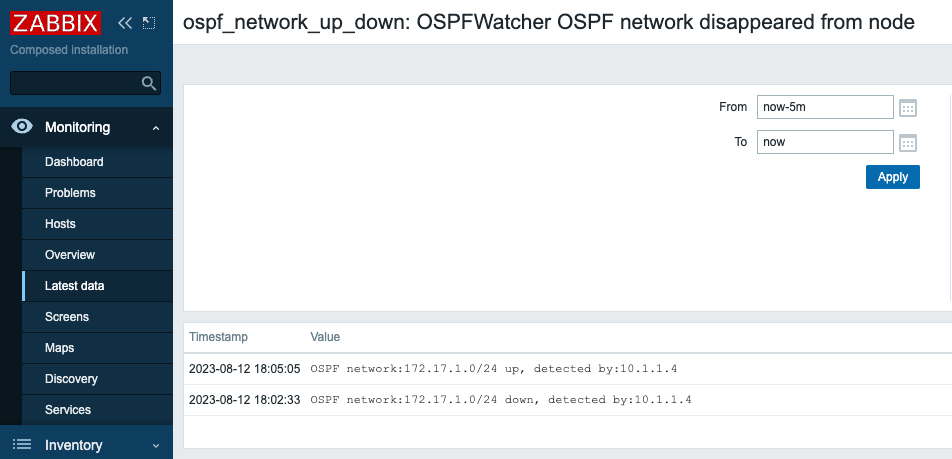
#### Zabbix alert if IS-IS network was stopped announcing from node
If a subnet was removed from IS-IS/OSPF node (the node withdrew it from the announcement) it means the network from this node became unavailable for others, this event will be logged too. *The screenshot is taken from OSPF watcher.*
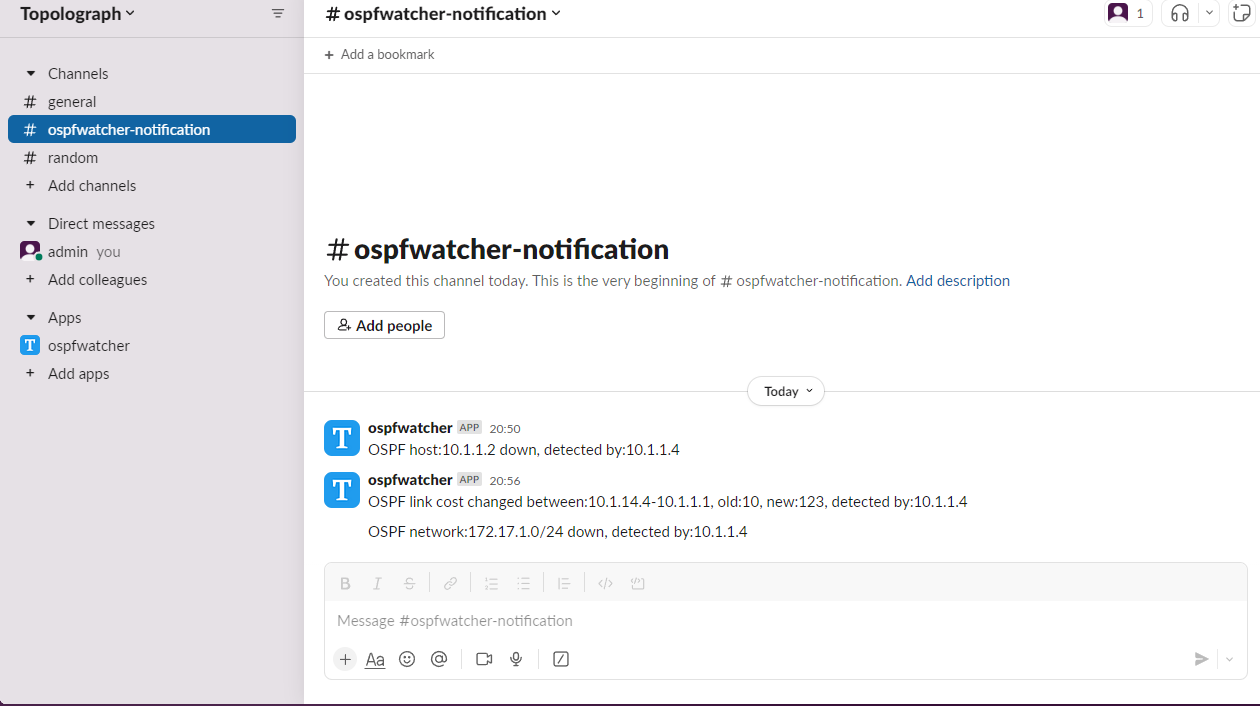
#### Slack notification
HTTP POST messages can be easily accepted by messengers, which allows to get instant notifications of IS-IS/OSPF topology changes: *The screenshot is taken from OSPF watcher.*
## Push IS-IS topology changes to Loki
You can configure [Loki](https://grafana.com/oss/loki/) to receive topology changes. Edit `.env` and set `EXPORT_TO_LOKI_BOOL` and `LOKI_URL`.
Both shippers declare the same stream labels, so one set of Grafana queries
works whichever of them you run:
| Label | Values |
|---|---|
| `job` | `topolograph-isis` |
| `event_name` | `network`, `host`, `metric`, `temetric`, `node` |
| `event_status` | `up`, `down`, `changed` |
| `area_num` | `49.0001` (IS-IS area) |
| `asn` | autonomous system number, e.g. `65001` |
| `watcher_name` | name of the watcher that reported the event |
Example query: `{job="topolograph-isis", event_status="down"}`
## Quick lab
#### Containerlab
Containerlab's topology is placed under **containerlab** folder. Local `README` includes instructions how to run it. IS-IS topology changes are printed by Watcher in a text file only.

```
./containerlab/frr01/prepare.sh
sudo clab deploy --topo ./containerlab/frr01/frr01.clab.yml
```
## How to connect IS-IS watcher to real network
Table below shows different options of possible setups, starting from the bare minimum in case of running Containerlab for testing and ending with maximum setup size with Watcher, Topolograph and ELK. The following setup describes setup №1 and №2.
| № | Deployment size | Number of compose files | Text file logs | View changes on network map | Zabbix/HTTP/Messengers notification | Searching events by any field any time |
|---|--------------------------------------------------------------------------------------------|-------------------------|----------------|-----------------------------|-------------------------------------|----------------------------------------|
| 1 | Bare minimum. Containerlab | 0 | ✅ | ❌ | ❌ | ❌ |
| 2 | 1. Local Topolograph
2. local compose file with ELK **disabled** (commented) | 2 | ✅ | ✅ | ✅ | ❌ |
| 3 | 1. Local Topolograph
2. local compose file with ELK **enabled** | 3 | ✅ | ✅ | ✅ | ✅ |
| 4 | Same as №2 but **Fluent Bit** instead of Logstash (Zabbix not available) | 2 | ✅ | ✅ | HTTP / Webhook only | ❌ |
#### Setup №2. Text logs + timeline of network changes on Topolograph
1. Choose a Linux host with Docker installed
2. Run script:
```bash
curl -O https://raw.githubusercontent.com/Vadims06/topolograph-docker/master/install.sh
chmod +x install.sh
sudo ./install.sh
```
It will:
* Install Docker, Containerlab, Git, and conntrack (if not already installed)
* Install and start Topolograph
* Guide you through IS-IS Watcher setup (GRE or BGP-LS mode)
* Configure watcher for either local Containerlab or network device deployment
* Start Logstash or Fluent Bit for log export (see **Compose profiles** under *Start log export*)
Alternatively, you can setup manually:
3. Setup Topolograph
* launch your own Topolograph on docker using [topolograph-docker](https://github.com/Vadims06/topolograph-docker)
* create a user for API authentication using `Local Registration` form on the Topolograph page, add your IP address in `API/Authorised source IP ranges`.
Set variables in `.env` file:
> [!NOTE]
> * `TOPOLOGRAPH_HOST` - *set the IP address of your host, where the docker is
> hosted (if you run all demo on a single machine), do not put **localhost**,
> because ELK, Topolograph and IS-IS Watcher run in their private network
> space*
> * `TOPOLOGRAPH_PORT` - by default `8080`
> * `TOPOLOGRAPH_WEB_API_USERNAME_EMAIL` - by default `ospf@topolograph.com` or
> put your recently created user
> * `TOPOLOGRAPH_WEB_API_PASSWORD` - by default `ospf`
> * Logstash and Fluent Bit send live events to Topolograph with this login and
> password; Topolograph rejects events without them (HTTP 401) and shows
> them only to this user
> * `TEST_MODE` - if mode is `True`, a demo IS-IS events from static file will
> be uploaded, not from FRR
3. Setup ELK (skip it, it's only needed for setup № 3)
* if you already have ELK instance running, fill `ELASTIC_IP` in env file and uncomment Elastic config here `isiswatcher/logstash/pipeline/logstash.conf`. Currently additional manual configuration is needed for Index Templates creation, because `create.py` script doesn't accept the certificate of ELK. It's needed to have one in case of security setting enabled. Required mapping for the Index Template is in `isiswatcher/logstash/index_template/create.py`.
To create Index Templates, run:
```
sudo docker run -it --rm --env-file=./.env -v ./logstash/index_template/create.py:/home/watcher/watcher/create.py vadims06/isis-watcher:latest python3 ./create.py
```
To create Index Templates, run:
```
sudo docker run -it --rm --env-file=./.env -v ./logstash/index_template/create.py:/home/watcher/watcher/create.py vadims06/isis-watcher:latest python3 ./create.py
```
* if not - boot up a new ELK from [docker-elk](https://github.com/deviantony/docker-elk) compose. For demo purporse set license of ELK as basic and turn off security. The setting are in docker-elk/elasticsearch/config/elasticsearch.yml
```
xpack.license.self_generated.type: basic
xpack.security.enabled: false
```
> [!TIP]
> When the Elastic output plugin fails to connect to the ELK host, it blocks all
> other outputs and ignores `EXPORT_TO_ELASTICSEARCH_BOOL` value from env file.
> Regardless of `EXPORT_TO_ELASTICSEARCH_BOOL` being `False`, it tries to
> connect to Elastic host. The solution - uncomment this portion of config in
> case of having running ELK.
4. Setup IS-IS Watcher
```bash
git clone https://github.com/Vadims06/isiswatcher.git
cd isiswatcher
cp .env.template .env
```
Generate configuration files
`vadims06/isis-watcher:v1.1` includes a client for generating configurations for each Watcher for each IS-IS area. To generate individual settings - run the client with `--action add_watcher`
```
sudo docker run -it --rm --user $UID -v ./:/home/watcher/watcher/ -v /etc/passwd:/etc/passwd:ro -v /etc/group:/etc/group:ro vadims06/isis-watcher:latest python3 ./client.py --action add_watcher
```
The script will prompt you to choose a connection mode: **GRE** or **BGP-LS**.
#### GRE Mode Setup
When you select GRE mode, you'll see the following output:
```
+---------------------------+
| Watcher Host | +-------------------+
| +------------+ | | Network device |
| | netns FRR | | | |
| | Tunnel [4] | | Tunnel [4] |
| | gre1 [3]TunnelIP----+-----------------------+[2]TunnelIP |
| | eth1------+-vhost1 | +-----+ | IS-IS area num [5]|
| | | Host IP[6]+-------+ LAN |--------[1]Device IP |
| | | | +-----+ | |
| +------------+ | | |
| | +-------------------+
+---------------------------+
```
The script will create:
1. a folder under `watcher` folder with FRR configuration under `router` folder
2. a containerlab configuration file with network settings
3. an individual watcher log file in `watcher` folder.
#### BGP-LS Mode Setup
When you select BGP-LS mode, you'll see:
```
+-------------------------------+
| Watcher Host | +-------------------+
| +-------------------+ | | Network Router |
| | bgplswatcher[3][4]| | | |
| | (GoBGP) |<-------+BGP Session [1][2]---+ | BGP Session [1][2]|
| | [gRPC] | | | ^ |
| | | | | | | |
| | v | | | BGP-LS |
| | isis-watcher | | | ^ |
| | (Python) | | | | |
| | | | | IS-IS [5] |
| +-------------------+ | | |
| | +-------------------+
+-------------------------------+
```
You'll be prompted for:
- **[1] Router IP address (BGP peer)** - IP address of the router running BGP-LS
- **[2] Router AS number** - AS number of the BGP-LS router
- **[3] Watcher AS number** - AS number for the watcher
- **[4] Watcher router-id** - Router ID for the watcher (IP address format)
- **[5] IS-IS area number** - IS-IS area being monitored (format: 49.xxxx)
- **[6] Passive mode** - Whether to use passive BGP mode (y/N)
The script will create:
1. a folder under `watcher` folder with bgplswatcher configuration
2. a containerlab configuration file
3. an individual watcher log file in `watcher` folder
To stop IS-IS routes from being installed in the host's routing table, we the following policy has been applied on the watcher (GRE mode only):
```bash
# frr/config/isisd.conf
route-map TO_KERNEL deny 200
exit
!
ip protocol isis route-map TO_KERNEL
```
5. Start IS-IS Watcher
[Install](https://containerlab.srlinux.dev/install/) containerlab
To start the watcher run the following command. `clab deploy` is like a `docker compose up -d` command
```
sudo clab deploy --topo watcher/watcher-gre-isis/config.yml
```
For BGP-LS mode:
```
sudo clab deploy --topo watcher/watcher-bgpls-isis/config.yml
```
**GRE Mode** will create:
* Individual network namespace for Watcher and FRR
* A pair of tap interfaces to connect the watcher to Linux host
* GRE tunnel in Watcher's namespace
* NAT settings for GRE traffic
* FRR & Watcher instance
* assign XDP IS-IS filter on watcher's tap interface (if enabled)
**BGP-LS Mode** will create:
* bgplswatcher (GoBGP) container for BGP-LS session
* IS-IS watcher container connected via gRPC
* Log rotation container
6. Configure Network Device
#### For GRE Mode:
Setup GRE tunnel from the network device to the host with the Watcher. An example for Cisco:
```bash
interface gigabitether0/1
ip address
tunnel mode gre
tunnel source
tunnel destination
ip router isis
isis network point-to-point
```
It's needed to have a minimum one GRE tunnel to an area, which is needed to be monitored. If the IS-IS domain has multiple areas, setup one GRE in each area. It's a restriction of Link State architecture to know about new/old adjacency or link cost changes via LSPs per area basis only.
#### For BGP-LS Mode:
Configure the network router to advertise IS-IS topology via BGP-LS. The router must:
- Support BGP-LS (BGP Link-State) protocol
- Be configured to redistribute IS-IS topology into BGP-LS
- Establish a BGP session with the watcher's bgplswatcher instance
Example configuration for routers supporting BGP-LS (syntax varies by vendor):
**Juniper JunOS:**
> **Version Requirements:**
> - Starting with Junos OS Release 14.2 (M Series, MX Series, or T Series routers), the traffic engineering database only exported RSVP-TE topology information
> - Starting in Junos OS Release 17.4R1, TED exports non RSVP-TE topology information as well
> - Starting in Junos OS Release 20.4R1, you can configure IS-IS traffic engineering to store IPv6 information in the traffic engineering database (TED) in addition to IPv4 addresses
```bash
# Configure policy to import IS-IS and OSPF into TED
set protocols mpls traffic-engineering database import policy ted2nlri
set policy-options policy-statement ted2nlri term 1 from protocol isis
set policy-options policy-statement ted2nlri term 1 from protocol ospf
set policy-options policy-statement ted2nlri term 1 then accept
set policy-options policy-statement ted2nlri term 2 then reject
# Configure IS-IS traffic engineering and BGP-LS export
set protocols isis traffic-engineering l3-unicast-topology
set protocols mpls traffic-engineering database import l3-unicast-topology bgp-link-state
set protocols mpls traffic-engineering database import policy ted2nlri
# Configure BGP export policy for IS-IS
set protocols bgp export isis2bgp
set policy-options policy-statement isis2bgp term 1 from protocol isis
set policy-options policy-statement isis2bgp term 1 then accept
```
**Cisco IOS XR**: TODO
**Mikrotik**: BGP-LS is not supported
The watcher will connect to the router's BGP-LS peer IP address specified during configuration.
7. Start log export to Topolograph and/or ELK
**Compose profiles (Logstash vs Fluent Bit):**
- **Logstash (ELK + index templates):** services use Compose profile `logstash`. Run:
```bash
docker compose --profile logstash up -d
```
(equivalent: `docker compose --profile logstash up -d isis-logstash isis-logstash-index-creator`).
- **Fluent Bit only:** profile `fluentbit`. Run:
```bash
docker compose --profile fluentbit up -d isis-fluentbit
```
Pipeline definition: [`fluentbit/fluent-bit.yaml`](./fluentbit/fluent-bit.yaml). Logstash and Fluent Bit send HTTP payloads in different shapes; see **HTTP output: Logstash vs Fluent Bit** under *Versions*.
## Kibana settings
1. **Index Templates**
Have been already created by `isis-logstash-index-creator` container in compose yaml file.
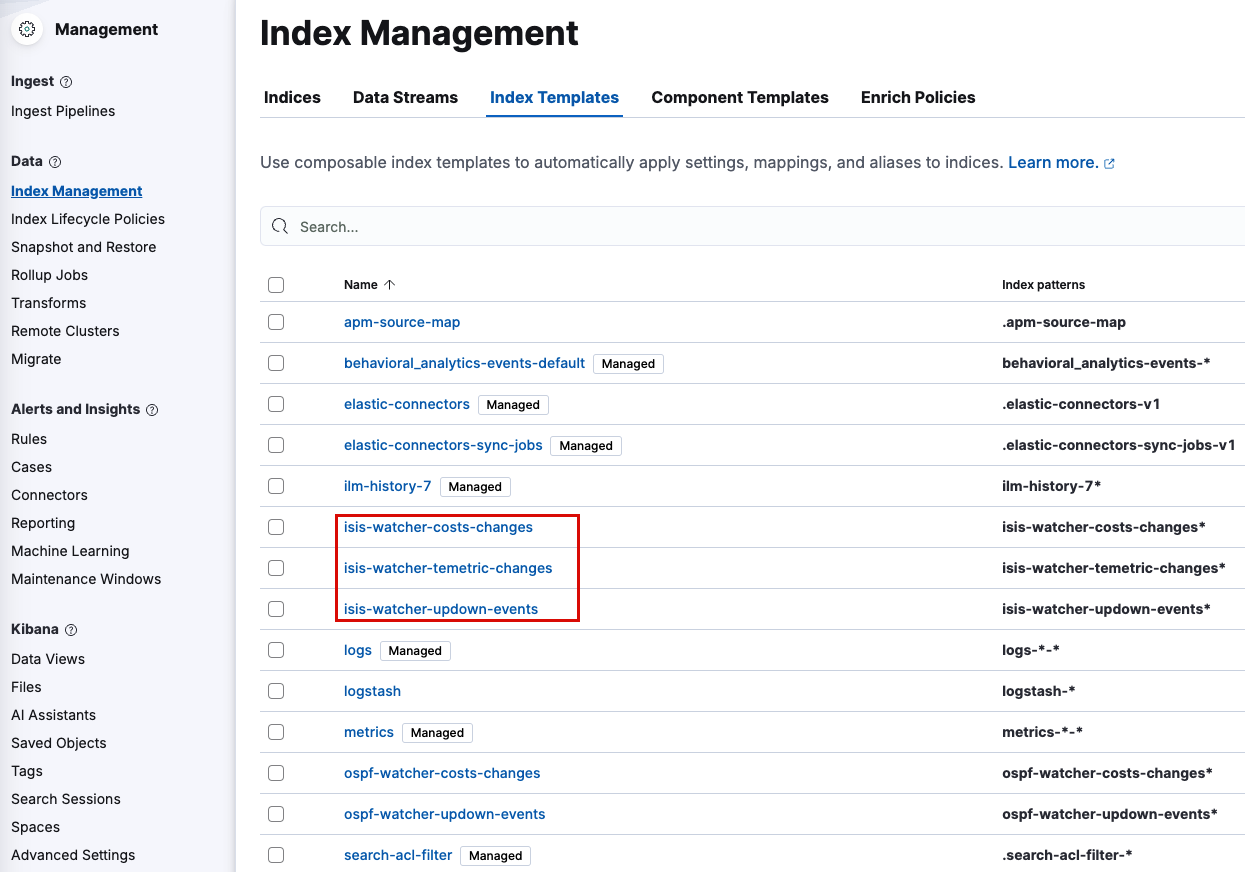
Open `Management -> Stack Management -> Index Management ->[ Index Templates ]` to make sure that the following templates are in the list:
* `isis-watcher-costs-changes`
* `isis-watcher-temetric-changes`
* `isis-watcher-updown-events`
2. **Index Pattern**
Create indices with the same name as index templates
Go to:
old ELK `Stack Management/ Kibana/ Stack Management/ Index Pattern -> Create index pattern`
new ELK 8.x `Management -> Stack Management -> Index Management -> [ Indices ]`
then `Create index`
* isis-watcher-costs-changes
* isis-watcher-updown-events
* isis-watcher-temetric-changes
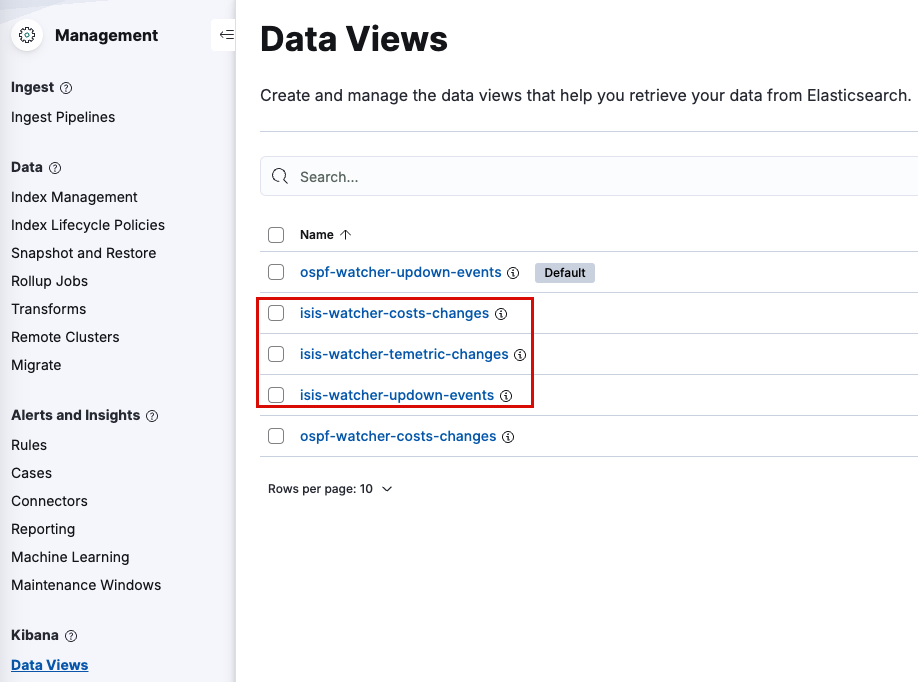
3. **Data View**
Create data view for two event types.
Go to `Management -> Stack Management -> Data Views`
then `Create data view`
```
Name: isis-watcher-costs-changes
Index pattern: isis-watcher-costs-changes
Timestamp field: use watcher time
```
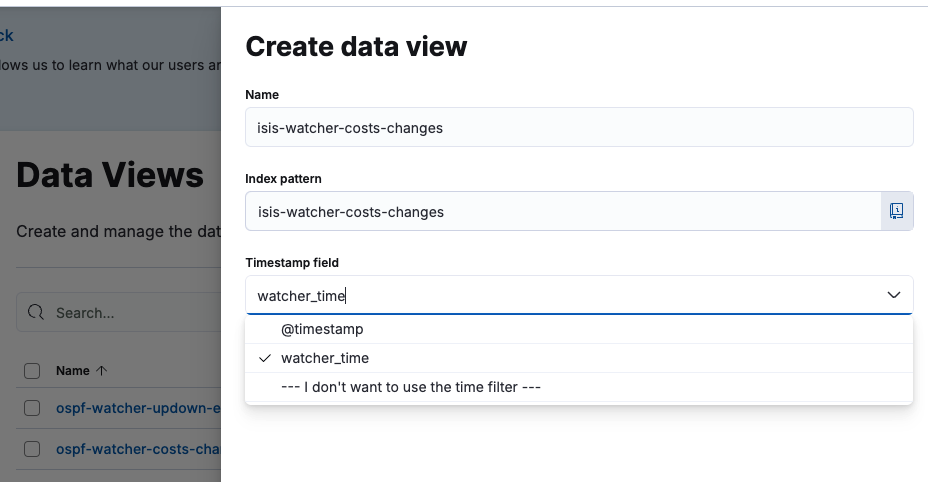
Repeat the same for `isis-watcher-updown-events` and for `isis-watcher-temetric-changes`
As a result, there are two data views should be listed
> Note
What time to use @timestamp or watcher
It's better to use `watcher` time, because connection between Watcher and Logstash can be lost, but the watcher continues to log all topology changes with the correct time. When the connection is repaired, all logs will be added to ELK and you can check the time of the incident. If you choose `@timestamp` - the time of all logs will be the time of their addition to ELK.
4. **Additional checks**
Make sure that:
* `.env` has `EXPORT_TO_ELASTICSEARCH_BOOL=True`
* `./logstash/pipeline/logstash.conf` has ELK uncommented
## Zabbix settings
Zabbix settings are available here ```/docs/zabbix-ui```. There are 4 hosts and items (host and item inside each host has the same names) are required:
* isis_neighbor_up_down
* isis_network_up_down
* isis_link_cost_change
* isis_stub_network_cost_change
## WebHook setting
1. Create a Slack app
2. Enable Incoming Webhooks
3. Create an Incoming Webhook (generates URL)
4. Uncomment `EXPORT_TO_WEBHOOK_URL_BOOL` in `.env`, set the URL to `WEBHOOK_URL`
## Browse your topology changes logs
Text logs are available here `isiswatcher/watcher/logs/`
If Topolograph is installed, logs are available under `Real-Time Monitoring` tab
If ELK is installed, logs are available here http://localhost:5601/ -> `Analytics/Discover` `watcher-updown-events`.
##### Logs sample 1
```
2023-01-01T00:00:00Z,demo-watcher,1,host,0200.1001.0002,down,0200.1001.0003,01Jan2023_00h00m00s_7_hosts,49.0002,12345
```
* `2023-01-01T00:00:00Z` - event timestamp
* `demo-watcher` - name of watcher
* `1` - IS-IS level
* `host` - event name: `host`, `network`, `metric`, `temetric`
* `0200.1001.0002` - event object. Watcher detected an event related to `0200.1001.0002` host
* `down` - event status: `down`, `up`, `changed`
* `0200.1001.0003` - event detected by this node.
* `01Jan2023_00h00m00s_7_hosts` - name of graph in Topolograph dashboard
* `49.0002` - area number
* `12345` - AS number
* `10.1.23.3` - Local IP address of detected node `0200.1001.0003` (available in 2.0.15)
* `10.1.23.2` - Remote IP address relative to the detected node `0200.1001.0003` (available in 2.0.16)
*Summary: `0200.1001.0003` on the interface with `10.1.23.3` IP address detected that `0200.1001.0002` host went down at `2023-01-01T00:00:00Z` in IS-IS level 1 in area 49.0002 in AS 12345*
##### Logs sample 2
```
2023-01-01T00:00:00Z,isis-watcher,2,metric,4ffe::192:168:23:2/127,changed,old_cost:10,new_cost:12,0200.1001.0002,stub,0200.1001.0002,01Jan2023_00h00m00s_7_hosts,49.0002,12345,external,1
```
* `2023-01-01T00:00:00Z` - event timestamp
* `isis-watcher` - name of watcher
* `2` - IS-IS level
* `metric` - event name: `host`, `network`, `metric`, `temetric`
* `4ffe::192:168:23:2/127` - event object. Watcher detected an event related to 4ffe::192:168:23:2/127` subnet
* `changed` - event status: `down`, `up`, `changed`
* `10` - old cost
* `12` - new cost
* `0200.1001.0002` - event detected by this node.
* `stub` - subnet type
* `0200.1001.0002` - since it's a stub network it has router id of terminated node.
* `01Jan2023_00h00m00s_7_hosts` - name of graph in Topolograph dashboard
* `49.0002` - area number
* `12345` - AS number
* `external` - subnet type internal|external
* `1` - subnet ext type 1|2. 0 for internal subnets
*Summary: `0200.1001.0002` detected that metric of `4ffe::192:168:23:2/127` stub network changed from `10` to `12` at `2023-01-01T00:00:00Z` in IS-IS level 2*
##### Logs sample 3. TE
```
2024-12-29T13:20:50.398Z,
isis-watcher,1,temetric,0200.1001.0002,changed,0_17_19_20_21_22_26_29_30,1000000000,1000000000,1000000008_1000000016_1000000024_1000000032_1000000040_1000000048_1000000056,11223344,0200.1001.0003,2024-07-28T18:03:05Z,49.0001,01Jan2023_00h00m00s_7_hosts,10.1.23.3,10.1.23.2
* `2023-01-01T00:00:00Z` - event timestamp
* `demo-watcher` - name of watcher
* `1` - IS-IS level
* `temetric` - event name: `host`, `network`, `metric`, `temetric`
* `0200.1001.0002` - event object. Watcher detected an event related to `0200.1001.0002` host
* `changed` - event status: `down`, `up`, `changed`
* `0_17_19_20_21_22_26_29_30` - 0, 17, 19, 20, 21, 22, 26, 29, 30 admin groups
* `1000000000` - Maximum Link Bandwidth (Sub-TLV 9) bits per sec
* `1000000000` - Maximum Reservable Link Bandwidth (Sub-TLV 10) bits per sec
* `1000000008_1000000016_1000000024_1000000032_1000000040_1000000048_1000000056` - Unreserved Bandwidth (Sub-TLV 11) for priority 0,..7 bits per sec
* `11223344` - Traffic Engineering Default Metric (Sub-TLV 18)
* `0200.1001.0003` - event detected by this node.
* `01Jan2023_00h00m00s_7_hosts` - name of graph in Topolograph dashboard
* `49.0002` - area number
* `12345` - AS number
* `10.1.23.3` - Local IP address of detected node `0200.1001.0003` (available in 2.0.15)
* `10.1.23.2` - Remote IP address relative to the detected node `0200.1001.0003` (available in 2.0.16)
```
FRR configuration
```
interface eth1
ip address 20.168.23.1/24
ip router isis lab
ipv6 address 4ffe::192:168:23:2/127
ipv6 router isis lab
isis network point-to-point
link-params
admin-grp 0x647a0001
enable
metric 11223344
max-bw 1e+08
unrsv-bw 0 1.23e+06
unrsv-bw 5 1.23e+06
!
router isis lab
net 49.0002.0200.1001.0002.00
mpls-te on
mpls-te router-address 10.10.10.2
exit
```
### Listen-only mode. XDP in action.
If, for some reason, an extra network is advertised from Watcher, this announcement will be dropped.
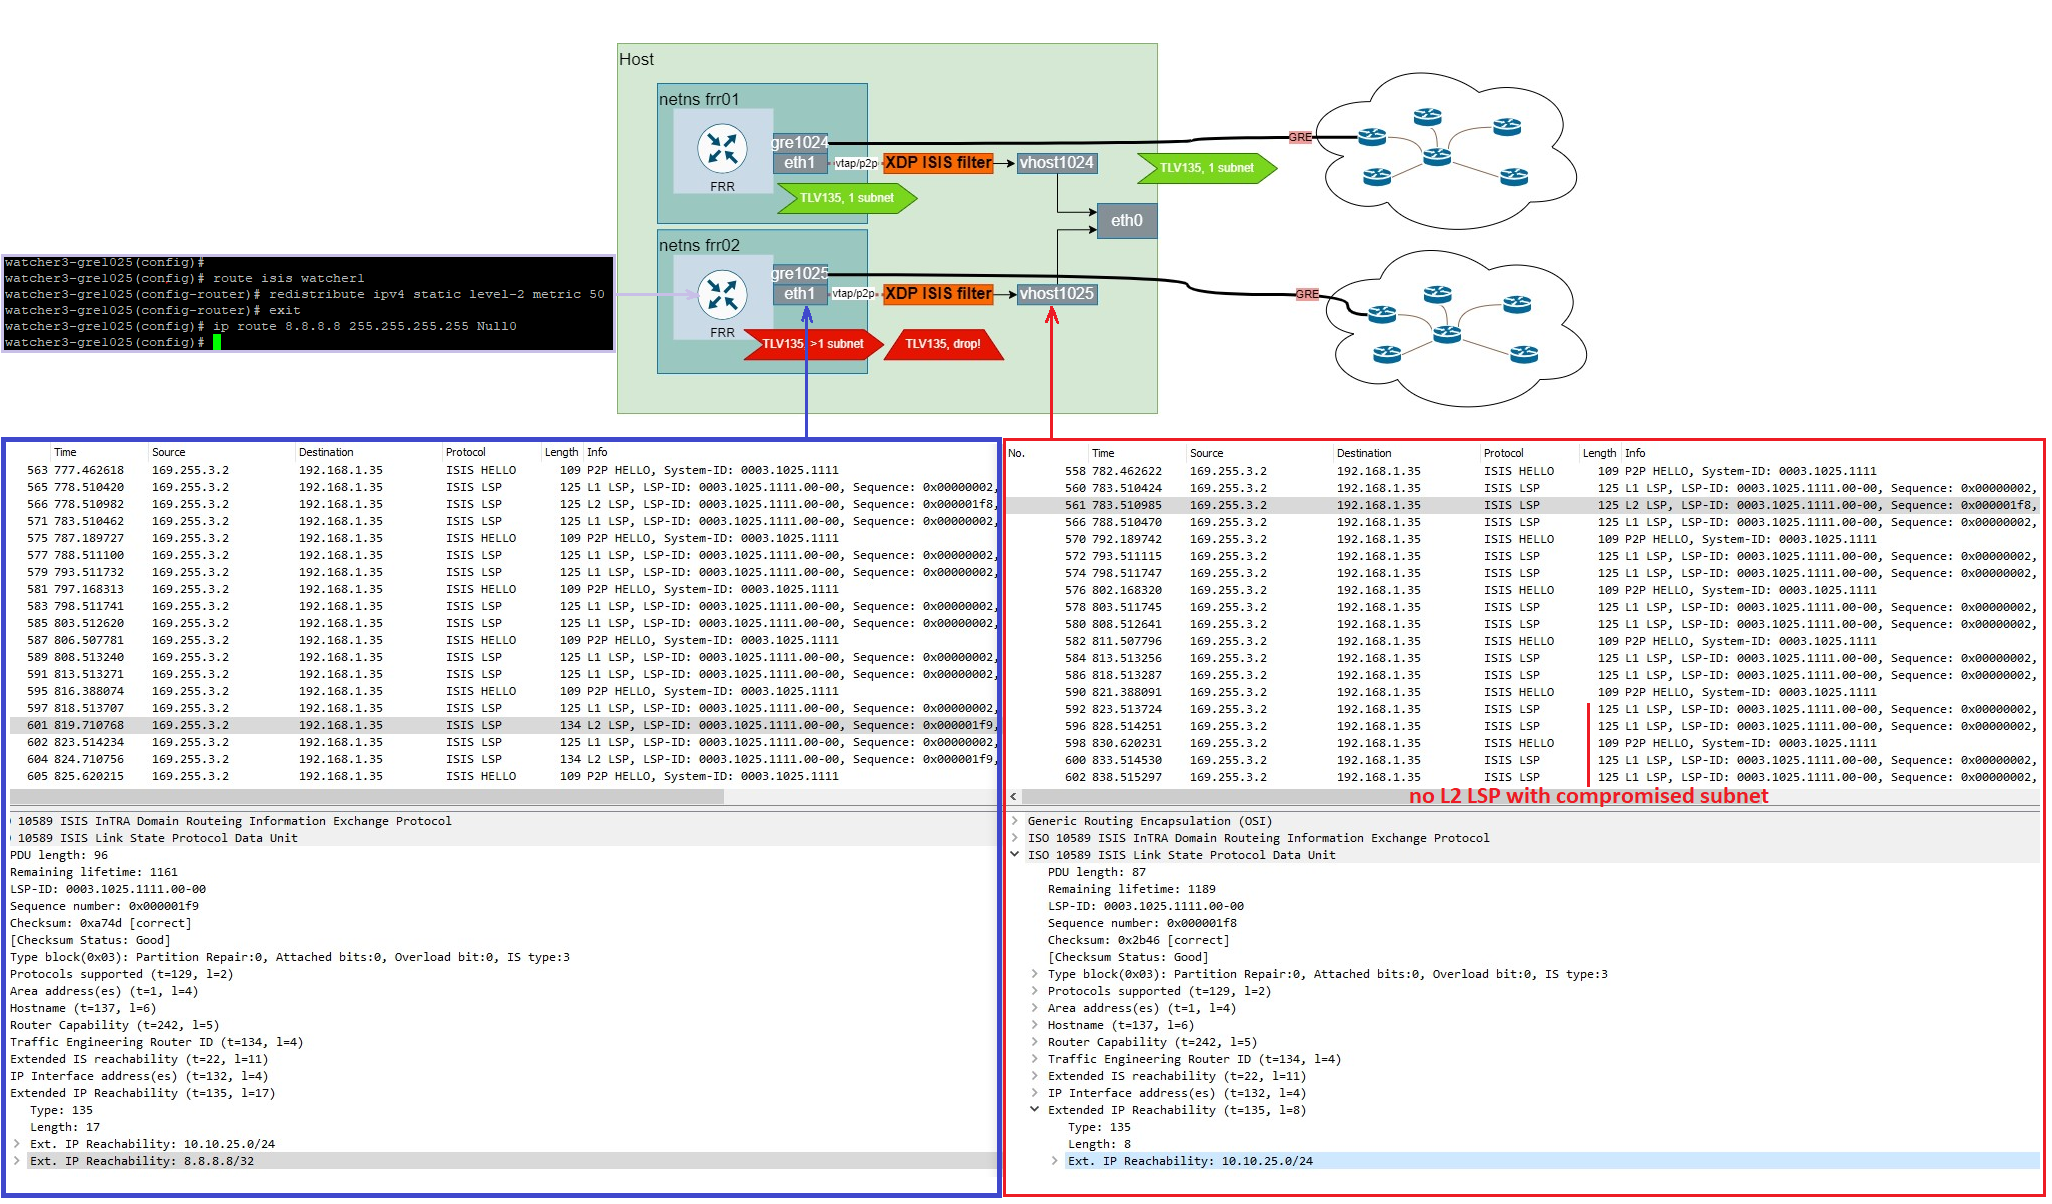
This examples shows that `8.8.8.8` prefix was redistributed on Watcher and added into its announcement, but it was dropped by XDP and eventually didn't reach the network.
To check XDP logs, run
```
sudo cat /sys/kernel/debug/tracing/trace_pipe
```
To enable/disable XDP
```
sudo docker run -it --rm -v ./:/home/watcher/watcher/ --cap-add=NET_ADMIN -u root --network host vadims06/isis-watcher:latest python3 ./client.py --action enable_xdp --watcher_num
```
##### Support
Currently XDP was tested on Ubuntu 18,20 Kernel 5.4.0-204-generic.
If you faced with XDP errors - skip it while generating config file or use `--action disable_xdp` as it mentioned in the example above.
## Troubleshooting
##### Symptoms
Networks changes are not tracked. Log file `./watcher/logs/watcher...log` is empty.
##### Steps:
**For GRE Mode:**
1. Run diagnostic script. It will check **IS-IS Watcher** <-> **Network device** connection (iptables, packets from FRR/network device)
```
sudo docker run -it --rm -v ./:/home/watcher/watcher/ --cap-add=NET_ADMIN -u root --network host vadims06/isis-watcher:latest python3 ./client.py --action diagnostic --watcher_num
```
2. Login on FRR, check adjancency:
```
sudo docker exec -it watcher-gre-isis-router vtysh
show isis neighbor
```
if there is no IS-IS neighbor, ping remote end of GRE tunnel from the Watcher. At the same time, make tcpdump on watcher's interface and check counters of iptables
```
sudo iptables -nvL -t filter --line-numbers
sudo iptables -nvL -t nat --line-numbers
```
Clear connections of GRE tunnel
```
sudo conntrack -D -p 47
```
Check ICMP ping packets on Watcher's host and on network device.
**For BGP-LS Mode:**
1. Check bgplswatcher container logs:
```
sudo docker logs watcher-bgpls-isis-bgplswatcher
```
IS-IS Watcher posts topology to Topolograph after 30 sec from establing BGP session.
2. Verify BGP session is established using gobgp CLI:
```bash
# List all BGP neighbors with session status
docker exec -it watcher-bgpls-isis-bgplswatcher gobgp neighbor
# Show detailed status for a specific neighbor
docker exec -it watcher-bgpls-isis-bgplswatcher gobgp neighbor
# Check routes received from a neighbor (BGP-LS address family)
docker exec -it watcher-bgpls-isis-bgplswatcher gobgp neighbor adj-in -a ls
# Check global RIB (accepted routes)
docker exec -it watcher-bgpls-isis-bgplswatcher gobgp global rib -a ls
```
The `gobgp neighbor` command shows:
- **Peer**: Neighbor IP address
- **AS**: Remote AS number
- **Up/Down**: Session uptime
- **State**: Session state (`Establ` = Established, `Idle`, `Connect`, `Active`, etc.)
- **#Received**: Number of routes received
- **Accepted**: Number of routes accepted
> Run `sudo sysctl -w net.ipv4.ip_unprivileged_port_start=0` on the Linux host to allow GoBGP on port 179 if needed to start goBGP in passive mode.
3. Check IS-IS watcher container logs:
```
sudo docker logs watcher-bgpls-isis-isis-watcher
```
4. Verify gRPC connection between bgplswatcher and isis-watcher:
- Check that gRPC port (default: 50100+watcher_num for IS-IS) is accessible
- Verify both containers are running and can communicate
##### Symptoms
Dashboard page is blank. Events are not present on OSPF/IS-IS Monitoring page.
##### Steps:
**GRE Mode**: IS-IS Watcher consists of three services: IS-ISd/FRR [1] -> Watcher [2] -> Logstash [3] -> Topolograph & ELK & Zabbix & WebHooks.
**BGP-LS Mode**: IS-IS Watcher consists of: bgplswatcher (GoBGP) [1] -> Watcher [2] -> Logstash [3] -> Topolograph & ELK & Zabbix & WebHooks.
1. Check if topology changes are tracked in `./watcher/logs/watcher...log` file (previous case)
You should see tracked changes of your network, i.e.
```
2024-10-08T22:54:54Z,watcher1,1,network,4ffe::192:168:145:4/127,changed,old_cost:44,new_cost:4,0200.1001.0004,,49.0002,12345,internal,0
```
2. Check that the log shipper from [docker-compose.yml](./docker-compose.yml) is running via `docker ps` (`isis-logstash` with profile `logstash`, or `isis-fluentbit` with profile `fluentbit`).
1. With Logstash: uncomment `DEBUG_BOOL="True"` in `.env` and run `docker logs -f isis-logstash`.
2. Copy and paste the log from the first step in watcher's log file `./watcher/logs/watcher#-gre#-isis.isis.log`. With Logstash, `docker logs -f isis-logstash` should show the event; with Fluent Bit only, use `docker logs -f isis-fluentbit` if you need to debug the agent.
3. Check that Topolograph stored the event: `docker logs isis-logstash` shows no `401` or `403`, and the events API returns it:
```
curl -u "$TOPOLOGRAPH_WEB_API_USERNAME_EMAIL:$TOPOLOGRAPH_WEB_API_PASSWORD" \
"http://$TOPOLOGRAPH_HOST:$TOPOLOGRAPH_PORT/api/events//adjacency"
```
`401` means a wrong login or password in `.env`; `403` means the event's `graph_time` is not a graph uploaded by this user.
2. Check that `graph_time` is **not** empty. If so, check that you can login on the Topolograph page [`Login/Local Login`] using credentials defined in `.env` and your local network is added in `API/Authorised source IP ranges`. Usually, `10.0.0.0/8`, `172.16.0.0/12` ,`192.168.0.0/16` is enought.
### Versions
#### FRR
FRR 8 perfectly logs any IS-IS LSPs, but doesn't establish IS-IS adjacency over GRE because of internal packet filtering. The filter has been updated to permit IS-IS over GRE through Pull request [#12979](https://github.com/FRRouting/frr/pull/12979) and is only supported in FRR 9 versions. However, this version has wrong LSDB output (mix LSPID with hostnames) and is incompatible with the Watcher. Therefore, a custom FRR build based on FRR 8.x version with an altered internal filter for GRE packets is required. `vadims06/frr:v8.5.4_isis_over_gre` is prepaired and tested to work IS-IS over GRE tunnel. If you need another 8.x version or want to build your own FRR image - follow the instructions mentioned below.
##### How to prepare FRR instance (optional)
1. clone FRR and choose any FRR 8.x branch
```
git clone https://github.com/FRRouting/frr.git
cd frr
git fetch --all --tags
git checkout tags/frr-8.5.4 -b frr-8.5.4
```
2. Change isis filter `frr/isisd/isis_pfpacket.c` how it's mentioned in this [GRE filter](https://github.com/FRRouting/frr/pull/12979) CR.
```
vi frr/isisd/isis_pfpacket.c
```
3. Build FRR container
```
sudo docker/alpine/build.sh
```
4. Inspect your new FRR image name using `docker image ls` and replace `router/image` by your own image name in `isiswatcher/watcher/watcher-template/config.yml`
### Minimum Logstash version
7.17.21, this version includes bug fix of [issues_281](https://github.com/logstash-plugins/logstash-input-file/issues/281), [issues_5115](https://github.com/elastic/logstash/issues/5115)
> [!NOTE]
> **HTTP output: Logstash vs Fluent Bit** — the `http` plugins use different `format` options and batching rules. Align the receiver (e.g. Topolograph `/websocket`) with the body shape you send.
>
> * **Logstash** ([http output](https://www.elastic.co/guide/en/logstash/current/plugins-outputs-http.html)): `format` is one of `json` (default), `json_batch`, `form`, or `message`. With **`json`**, each request body is typically **one JSON object per event**. With **`json_batch`**, each request sends **one JSON array** containing a whole pipeline batch (common for Logstash-to-Logstash). `content_type` defaults from `format` (e.g. `application/json` for `json` / `json_batch`).
> * **Fluent Bit** ([http output](https://docs.fluentbit.io/manual/pipeline/outputs/http)): `Format` is one of `json` (default), `json_lines`, `json_stream`, `msgpack`, or `gelf`. With **`json`**, the body is a **JSON array** of records for a flush chunk. **`json_lines`** is newline-delimited JSON (one object per line). How many records appear in one POST is driven mainly by the engine **chunk** and the global **[SERVICE] `Flush`** interval, not by Logstash’s `json` vs `json_batch` switch.
>
> Example Fluent Bit pipeline for this repo: [`fluentbit/fluent-bit.yaml`](./fluentbit/fluent-bit.yaml).
### Topolograph suite
* OSPF Watcher [link](https://github.com/Vadims06/ospfwatcher)
* IS-IS Watcher [link](https://github.com/Vadims06/isiswatcher)
* Topolograph [link](https://github.com/Vadims06/topolograph)
* Topolograph in docker [link](https://github.com/Vadims06/topolograph-docker)
### Community & feedback
* https://t.me/topolograph
* admin at topolograph.com
### License
The functionality was tested using Basic ELK license.