
# 🪄 Datacmd: auto-generative dashboards from different sources in your CMD
**The Ultimate Terminal Dashboard**
> Turn any data source into a stunning interactive dashboard, directly in your terminal. No fluff, no GUI, just pure terminal sorcery. ⚡
---
## 🚀 Why you'll love Datacmd
Tired of bloated web UIs? `datacmd` brings data visualization back to where real devs live: **the terminal.**
- ⚡ **One Command = Instant Dashboard**
- 📊 **Dynamic Widgets:** Tables, charts, gauges, pies, radars & more
- 🧠 **Smart Layout Engine:** Auto-generates from data OR use YAML to customize
- 💻 **Real-Time Feeds:** From APIs, metrics, JSON, CSV
- 🧼 **Zero Setup:** No deps, no bullshit, just `go run`
> Think of it like `htop` meets `grafana`, but cooler and terminal-native.
>
It follows my obsession with data, which I developed by building **[https://datastripes.com](Datastripes)**, the web data engine that transform data analysis into simple flows.
---
## ✨ Demo
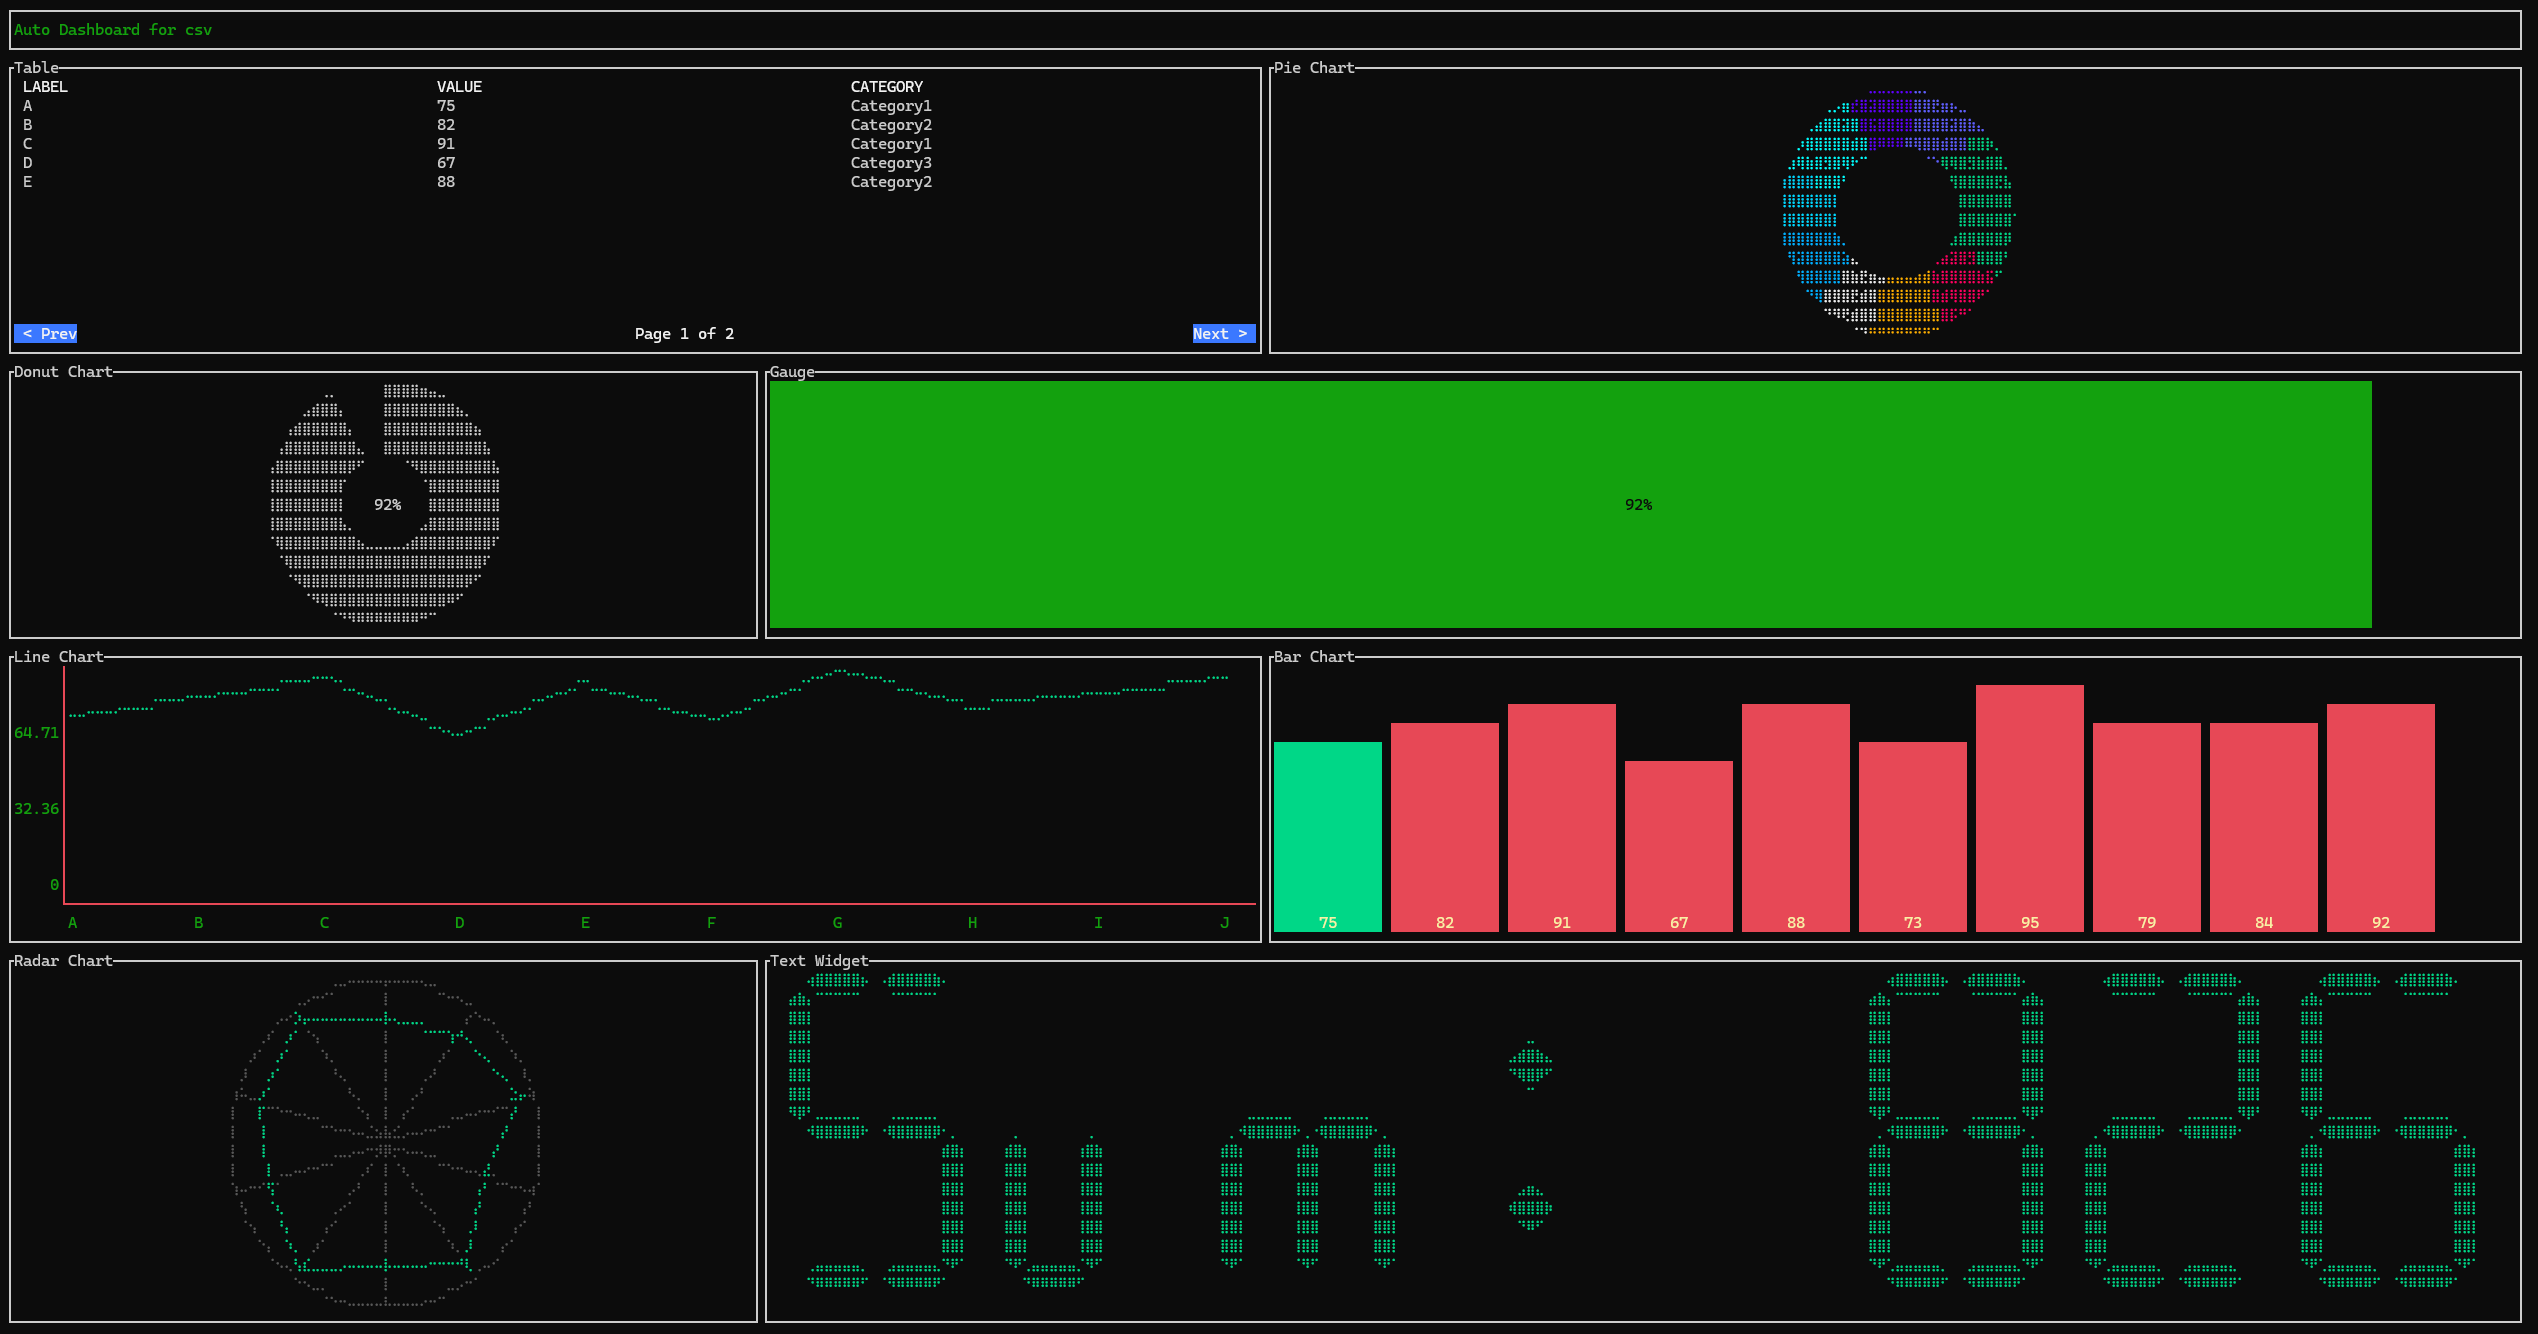
📈 Realtime stock tracker via `datacmd --source=stock.json`
---
## 🧰 Installation (pick your style)
### 👉 Option 1: **Download prebuilt binary (Recommended)**
No setup, no Go, no stress.
> ✅ macOS · 🪟 Windows · 🐧 Linux
📦 Go to the [**Releases**](https://github.com/VincenzoManto/datacmd/releases) page and download the latest binary for your OS.
Then:
```bash
# macOS / Linux
chmod +x datacmd
./datacmd --generate --source=your-data.csv
# Windows
datacmd.exe --generate --source=your-data.csv
```
---
### 🛠 Option 2: **Run from source (for Developers)**
```bash
git clone https://github.com/VincenzoManto/Datacmd.git
cd datacmd
go mod tidy
go run main.go --generate --source=your-data.csv
```
## 🧠 How it works
```bash
# Auto-generate a dashboard from any CSV or JSON
datacmd --generate --source=./data.csv
# Or load your own layout
datacmd --config=dashboard.yml
```
Data sources supported:
* `.csv` 📂
* `.json` 📜
* REST APIs 🌐
* Live system metrics (CPU, RAM, disk) 🖥️
---
## 🧩 Widgets you can use
* 📋 **Table** – Paginated, sortable
* 🎯 **Gauge** – Perfect for usage stats, thresholds
* 🍰 **Pie Chart** – Categorical comparisons
* 📈 **Line Chart** – Trends, time-series
* 📡 **Radar** – Multi-metric comparisons
* 💬 **Text Box** – Notes, alerts, logs
* 🔢 **Number** – Big, bold KPIs
* 📊 **Funnel** – Visualize stages in a process
Customize via YAML, or let `--generate` do it all.
---
## 📦 Installation
```bash
git clone https://github.com/VincenzoManto/Datacmd.git
cd datacmd
go mod tidy
```
---
## 🪄 Quick Start
### Example: `stock.json`
```json
[
{"ticker": "AAPL", "price": 175.50, "volume": 1200000},
{"ticker": "GOOG", "price": 140.25, "volume": 950000},
{"ticker": "MSFT", "price": 280.75, "volume": 1500000}
]
```
```bash
go run main.go --generate --source=stock.json
```
Instantly shows:
* 📋 Table of stocks
* 🎯 Volume gauges
* 🍰 Market share pie chart
---
## 🎨 YAML Customization
```yaml
layout:
- type: table
source: stock.json
fields: [ticker, price, volume]
- type: pie
title: "Market Share"
field: volume
```
> Your dashboard, your rules.
---
## 🧬 Inspired by Datastripes. Rebuilt for Power Users.
`datacmd` is the spiritual open source successor to [Datastripes](https://datastripes.com), reimagined with more muscle, more magic, and **zero fluff**.
---
## Linked resources
Based on `datacmd`, with the team @ Datatripes, we developed our complete and curated [toolkit for data analysis](https://github.com/Datastripes/the-data-analyst-toolkit)
## 🤝 Community
We’re building more than a CLI, we’re starting a movement.
Star the repo ⭐, submit PRs, file issues, or just show us the wild dashboards you build.
---
## 📝 License
Apache 2.0, free as in freedom and fast as in Go.
---





```txt
🔥 Stop using Grafana for your side projects
I built `datacmd`, a tool that turns CSV/JSON/API into live dashboards, directly in your terminal
✅ No deps
🪄 Auto layout
⚡ One command
→ https://github.com/VincenzoManto/datacmd