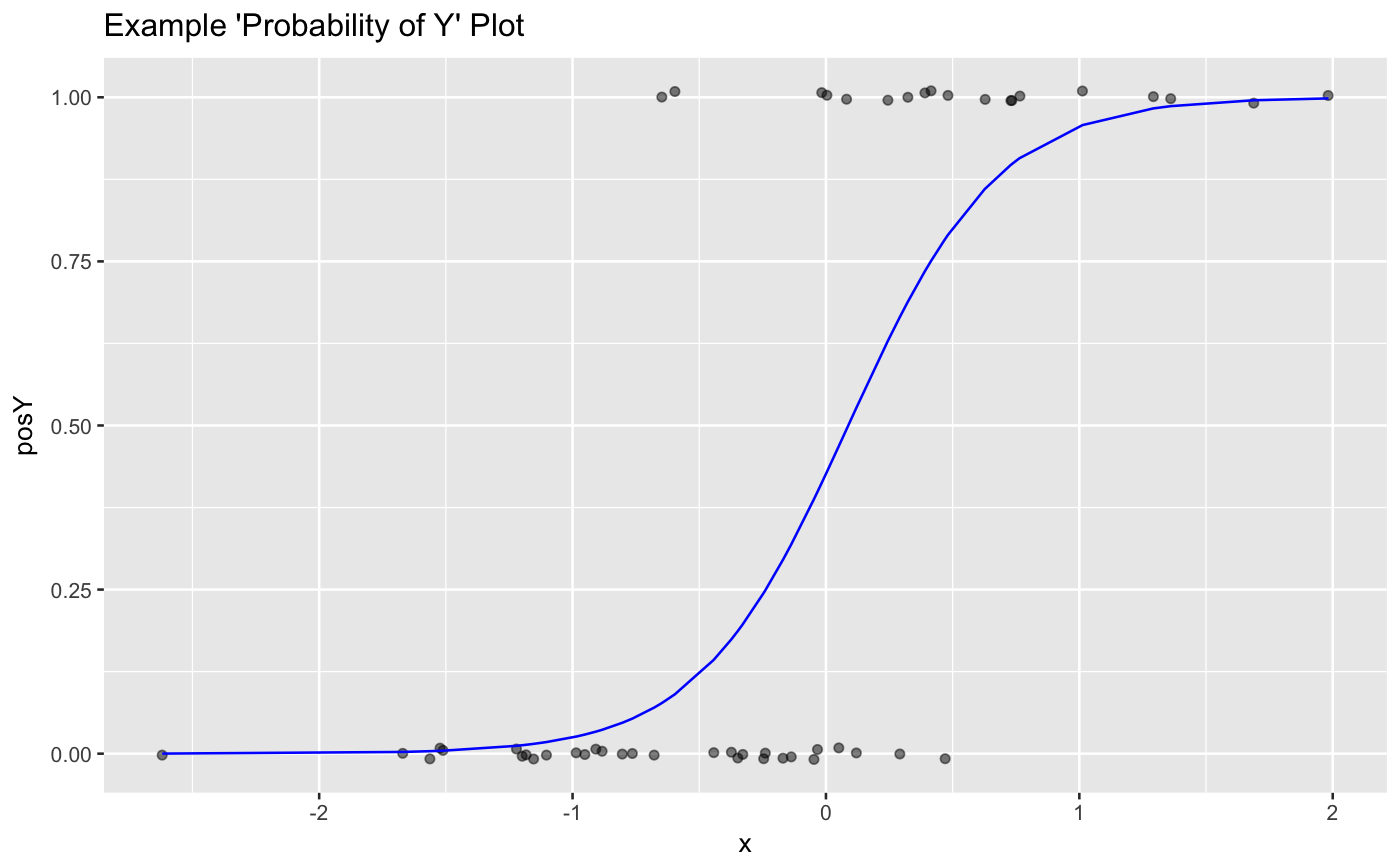
Plot a scatter plot of a binary variable. xvar is the continuous independent variable and yvar is the dependent binary variable
Plot a scatter plot of a binary variable. xvar is the continuous independent variable and yvar is the dependent binary variable
BinaryYScatterPlot(frame, xvar, yvar, title, ..., se = FALSE,
  use_glm = TRUE)
Arguments
| frame | data frame to get values from |
|---|---|
| xvar | name of the independent column in frame |
| yvar | name of the dependent (output or result to be modeled) column in frame |
| title | title to place on plot |
| ... | no unnamed argument, added to force named binding of later arguments. |
| se | if TRUE, add error bars (defaults to FALSE). Ignored if useGLM is TRUE |
| use_glm | if TRUE, "smooths" with a one-variable logistic regression (defaults to TRUE) |
Examples
set.seed(34903490)
x = rnorm(50)
y = 0.5*x^2 + 2*x + rnorm(length(x))
frm = data.frame(x=x,y=y,yC=y>=as.numeric(quantile(y,probs=0.8)))
frm$absY <- abs(frm$y)
frm$posY = frm$y > 0
frm$costX = 1
WVPlots::BinaryYScatterPlot(frm, "x", "posY",
   title="Example 'Probability of Y' Plot")