Plot distribution of a single continuous variable.
Plot distribution of a single continuous variable.
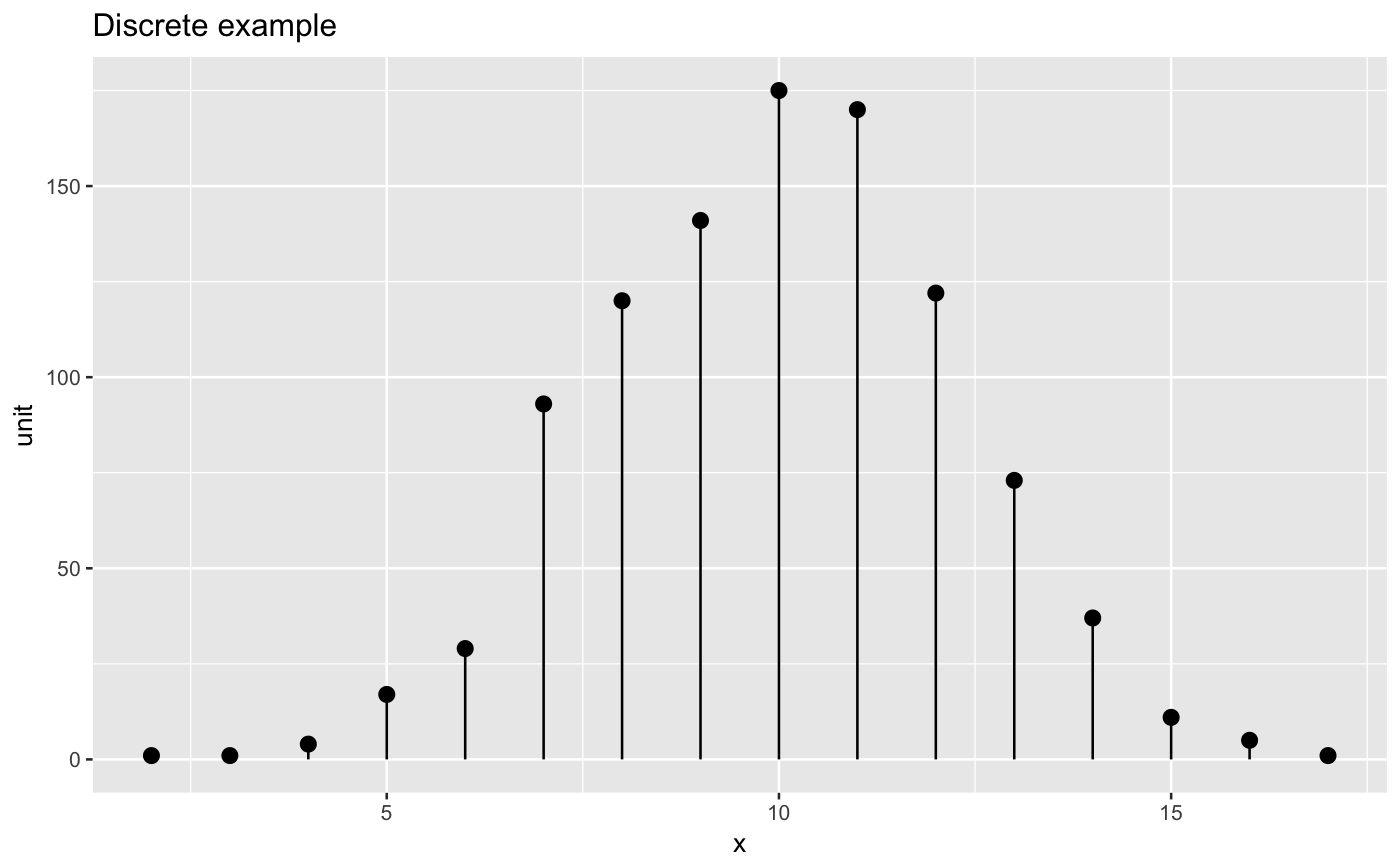
DiscreteDistribution(frm, xvar, title, ..., stem = TRUE)
Arguments
| frm | data frame to get values from |
|---|---|
| xvar | name of the independent (input or model) column in frame |
| title | title to place on plot |
| ... | no unnamed argument, added to force named binding of later arguments. |
| stem | if TRUE add whisker/stems to plot |
Examples
frmx = data.frame(x = rbinom(1000, 20, 0.5))
WVPlots::DiscreteDistribution(frmx, "x","Discrete example")