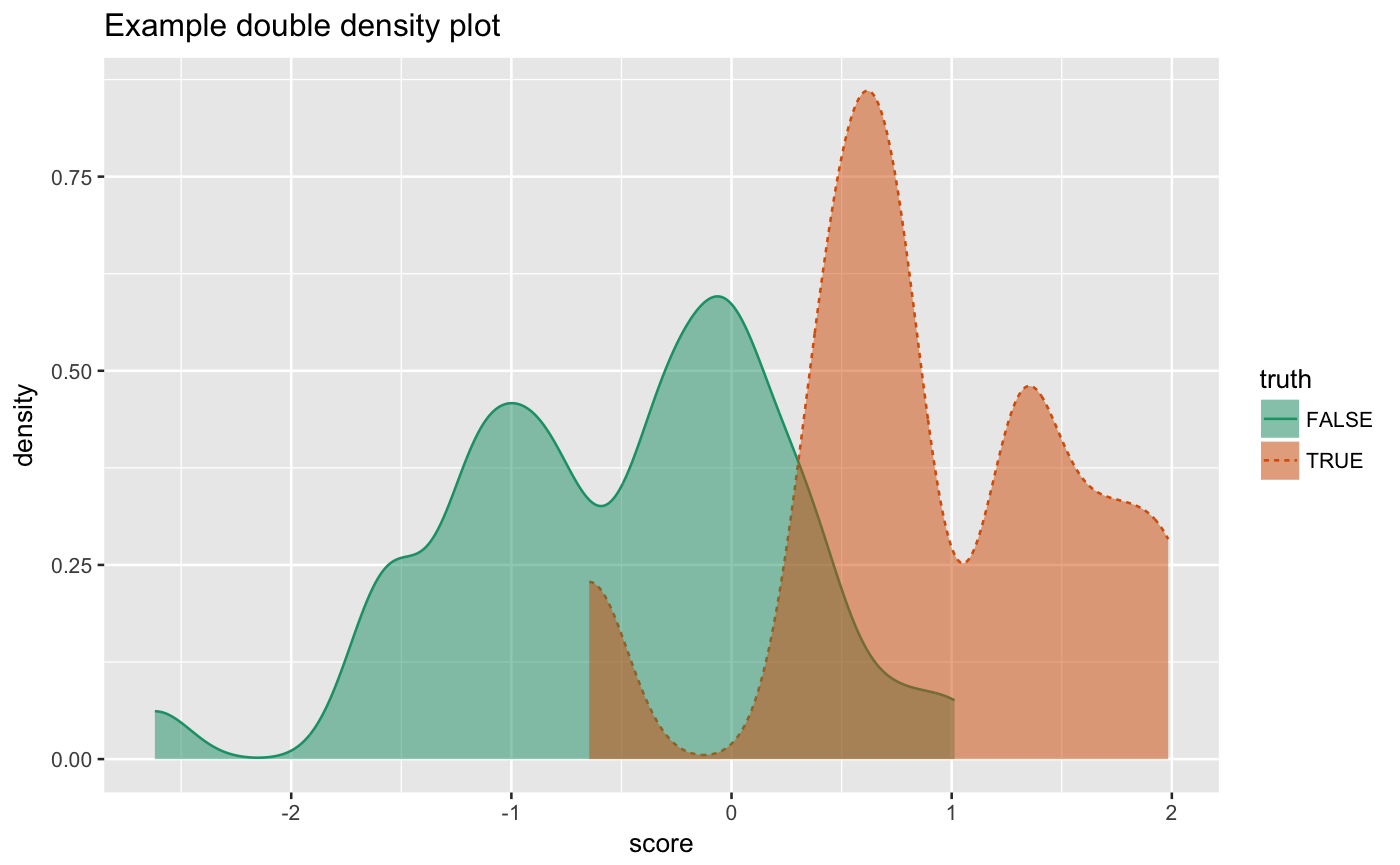
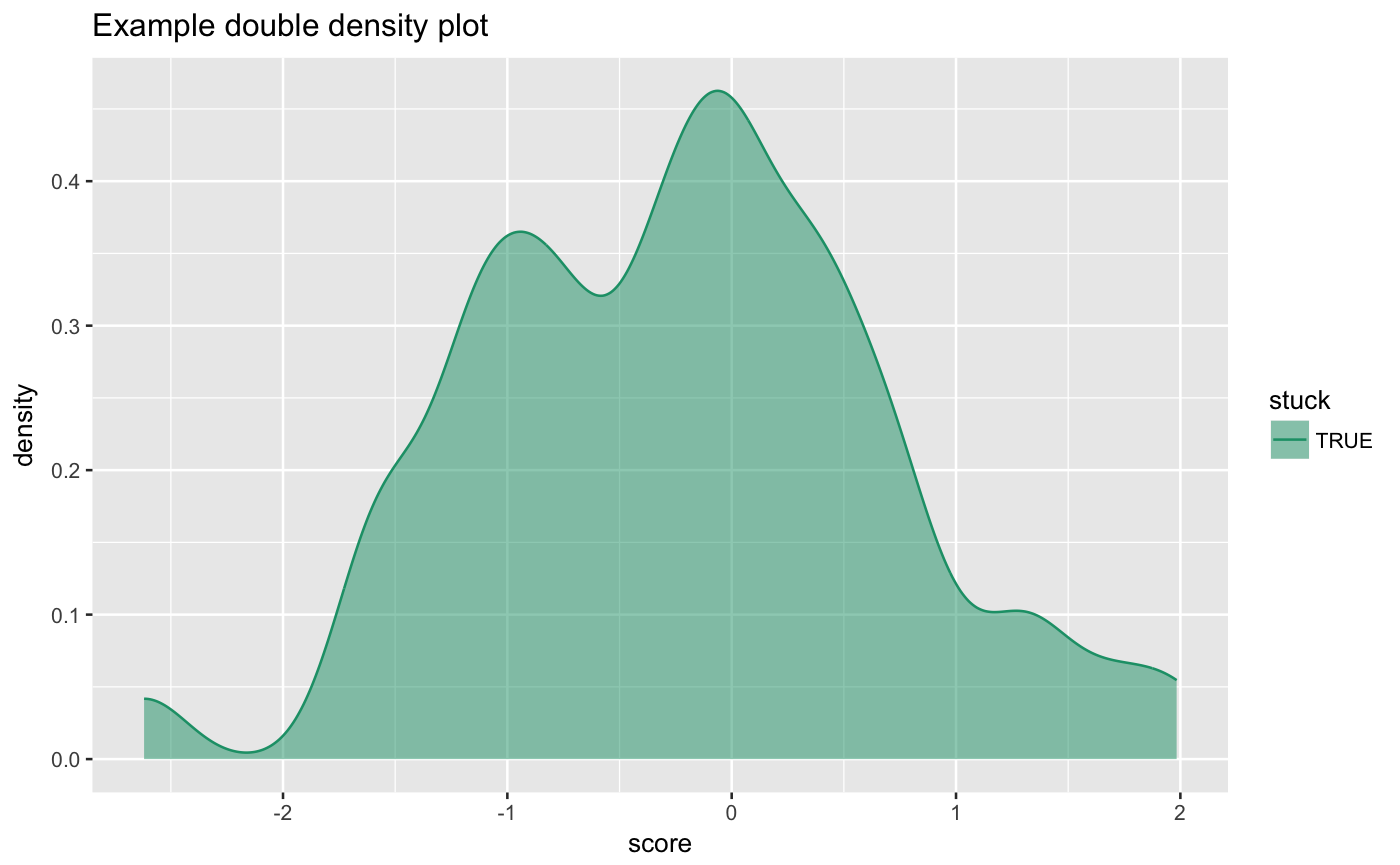
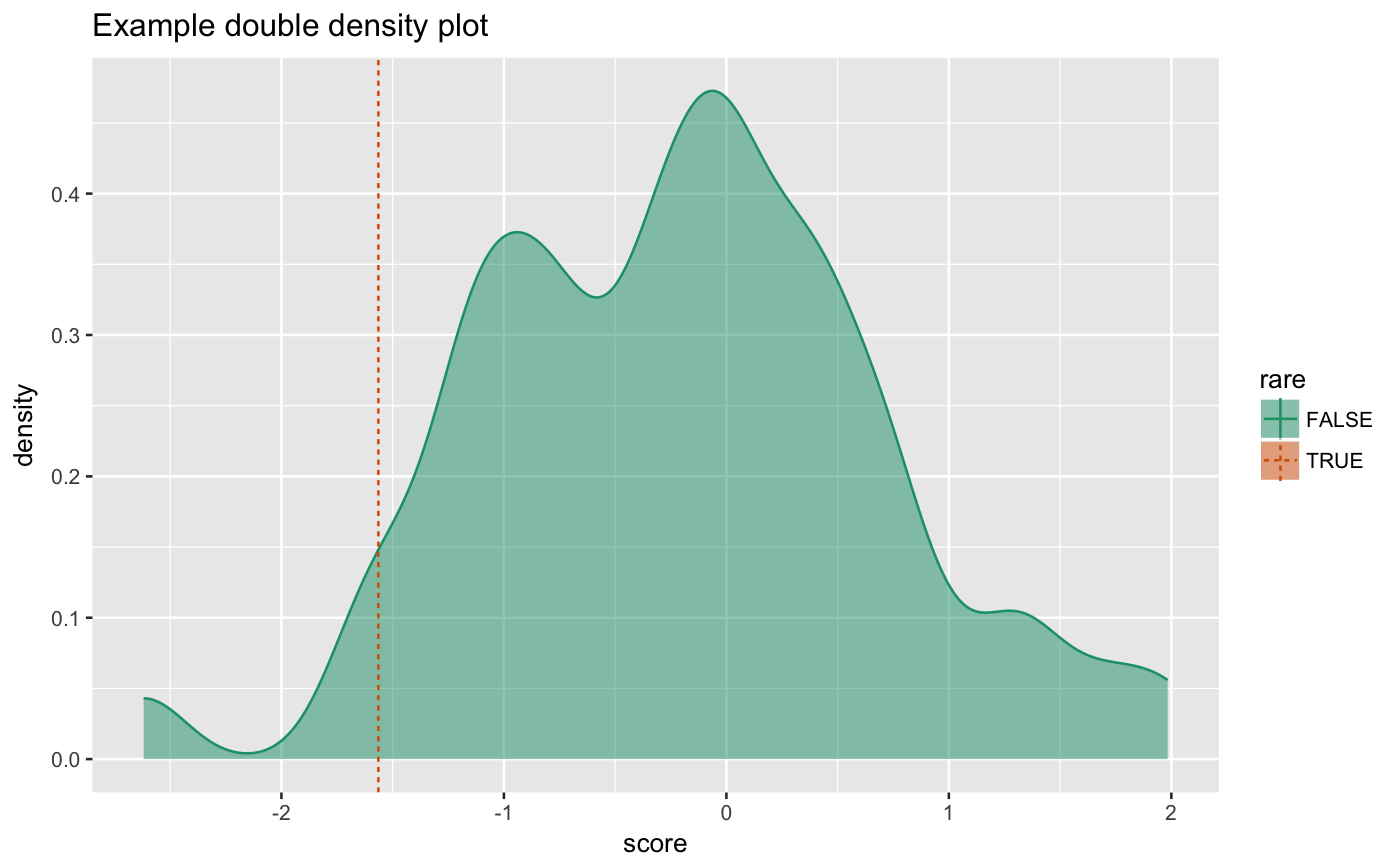
Plot two density plots conditioned on truthVar.
Plot two density plots conditioned on truthVar.
DoubleDensityPlot(frame, xvar, truthVar, title, ...)
Arguments
| frame | data frame to get values from |
|---|---|
| xvar | name of the independent (input or model) column in frame |
| truthVar | name of the dependent (output or result to be modeled) column in frame |
| title | title to place on plot |
| ... | no unnamed argument, added to force named binding of later arguments. |
Examples
set.seed(34903490) x = rnorm(50) y = 0.5*x^2 + 2*x + rnorm(length(x)) frm = data.frame(score=x, truth=(y>=as.numeric(quantile(y,probs=0.8))), stuck=TRUE, rare=FALSE) frm[1,'rare'] = TRUE WVPlots::DoubleDensityPlot(frm, "score", "truth", title="Example double density plot")#> Warning: Removed 512 rows containing missing values (geom_vline).