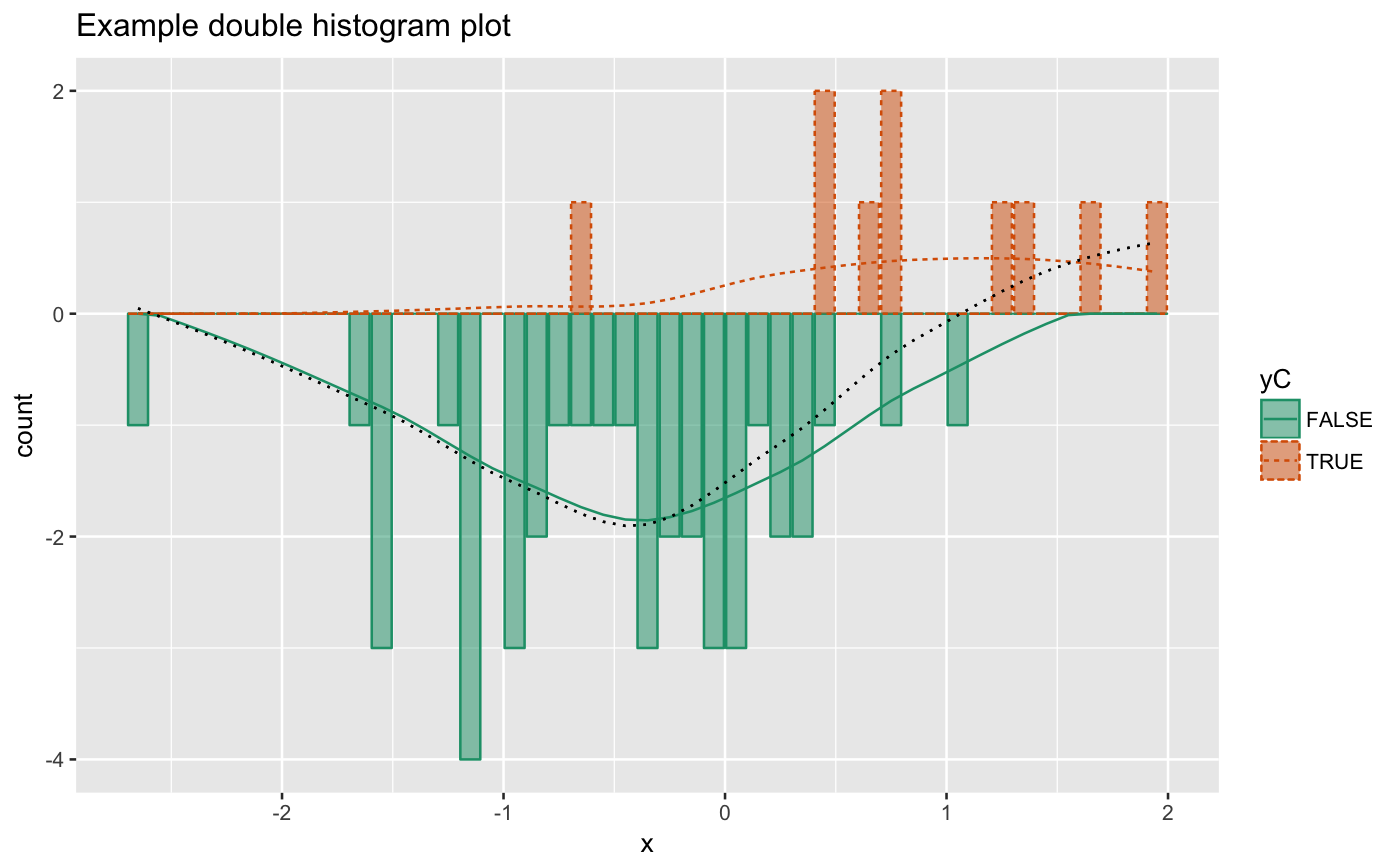
Plot two histograms conditioned on truthVar.
Plot two histograms conditioned on truthVar.
DoubleHistogramPlot(frame, xvar, truthVar, title, ..., breaks = 40)
Arguments
| frame | data frame to get values from |
|---|---|
| xvar | name of the independent (input or model) column in frame |
| truthVar | name of the dependent (output or result to be modeled) column in frame |
| title | title to place on plot |
| ... | no unnamed argument, added to force named binding of later arguments. |
| breaks | breaks to pass to histogram |
Examples
set.seed(34903490)
x = rnorm(50)
y = 0.5*x^2 + 2*x + rnorm(length(x))
frm = data.frame(x=x,y=y,yC=y>=as.numeric(quantile(y,probs=0.8)))
frm$absY <- abs(frm$y)
frm$posY = frm$y > 0
frm$costX = 1
WVPlots::DoubleHistogramPlot(frm, "x", "yC", title="Example double histogram plot")