Plot the gain curve of a sort-order with costs.
Plot the gain curve of a sort-order with costs.
GainCurvePlotC(frame, xvar, costVar, truthVar, title, ...)
Arguments
| frame | data frame to get values from |
|---|---|
| xvar | name of the independent (input or model) column in frame |
| costVar | cost of each item (drives x-axis sum) |
| truthVar | name of the dependent (output or result to be modeled) column in frame |
| title | title to place on plot |
| ... | no unnamed argument, added to force named binding of later arguments. |
Examples
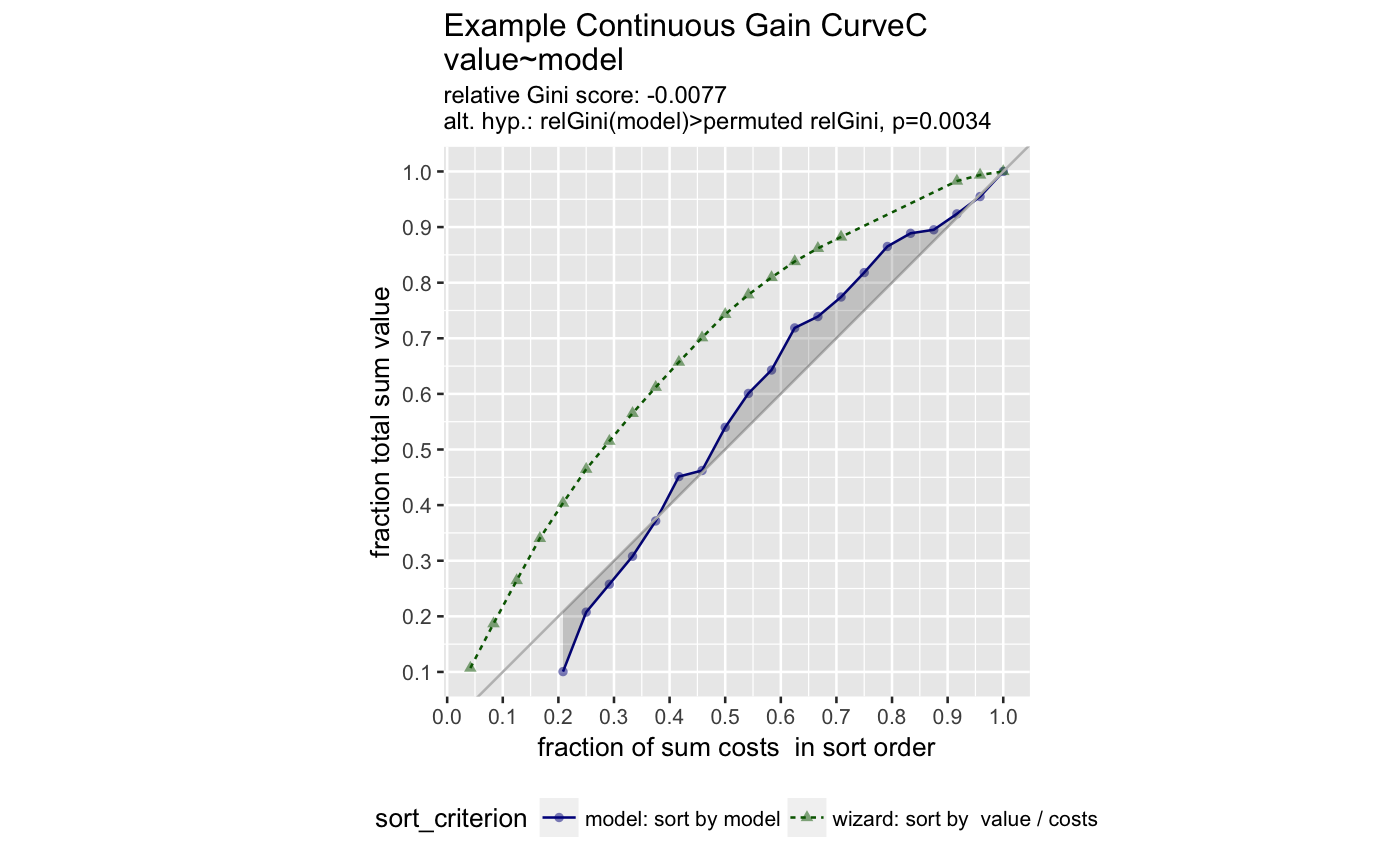
set.seed(34903490)
y = abs(rnorm(20)) + 0.1
x = abs(y + 0.5*rnorm(20))
frm = data.frame(model=x, value=y)
frm$costs=1
frm$costs[1]=5
frm$rate = with(frm, value/costs)
frm$isValuable = (frm$value >= as.numeric(quantile(frm$value, probs=0.8)))
WVPlots::GainCurvePlotC(frm, "model", "costs", "value",
   title="Example Continuous Gain CurveC")