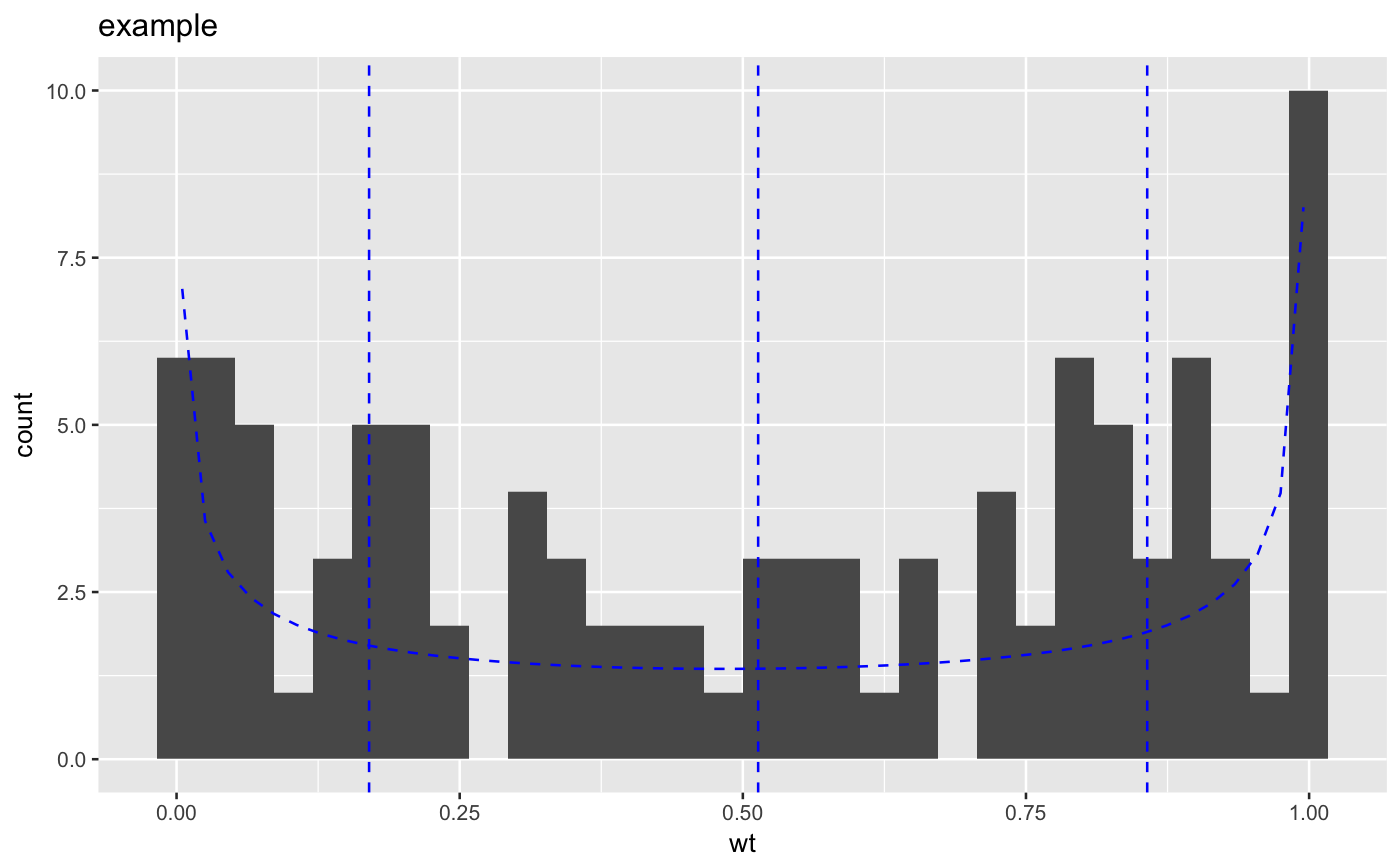
plot distribution details as a density plus matching beta
assumes that xvar is a factor variable sort < 0 sorts the factor levels in decreasing order (most frequent level first) sort > 0 sorts the factor levels in increasing order (good when used in conjunction with coord_flip()) sort = 0 leaves the factor levels in "natural order" -- usually alphabetical stem = FALSE will plot only the dots, without the stem to the y=0 line. limit_n = NULL plots all the levels, N an integer limits to the top N most populous levels
PlotDistHistBeta(frm, xvar, title, ...)
Arguments
| frm | data frame to get values from |
|---|---|
| xvar | name of the independent (input or model) column in frame |
| title | title to place on plot |
| ... | no unnamed argument, added to force named binding of later arguments. |
Examples
set.seed(52523) d <- data.frame(wt=rbeta(100,shape1=0.5,shape2=0.5)) PlotDistHistBeta(d,'wt','example')#>