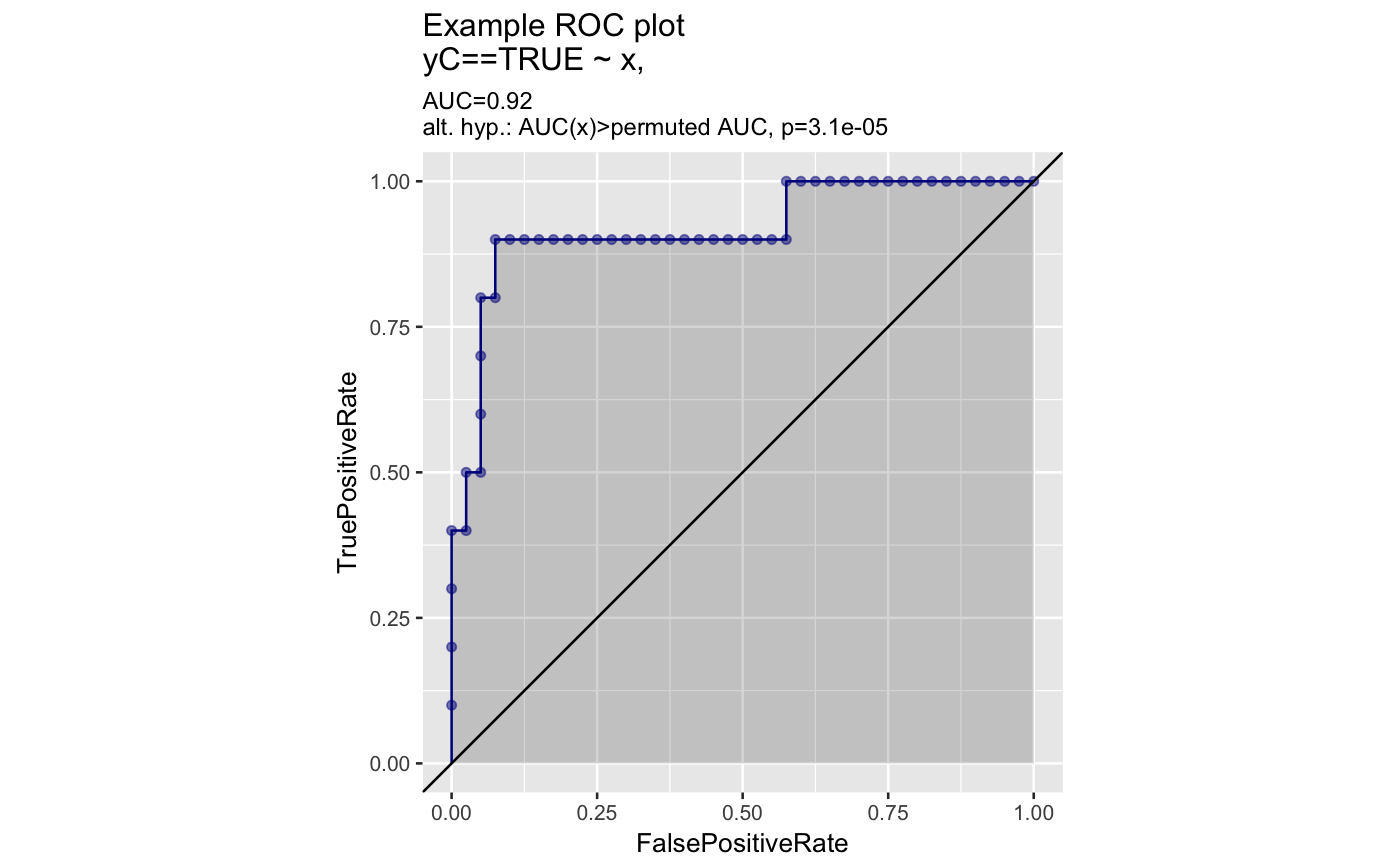
Plot receiver operating characteristic plot.
Plot receiver operating characteristic plot.
ROCPlot(frame, xvar, truthVar, truthTarget, title, ..., returnScores = FALSE,
  nrep = 100, parallelCluster = NULL)
Arguments
| frame | data frame to get values from |
|---|---|
| xvar | name of the independent (input or model) column in frame |
| truthVar | name of the dependent (output or result to be modeled) column in frame |
| truthTarget | value we consider to be positive |
| title | title to place on plot |
| ... | no unnamed argument, added to force named binding of later arguments. |
| returnScores | logical if TRUE return detailed permutedScores |
| nrep | number of permutation repititions to estimate p values. |
| parallelCluster | (optional) a cluster object created by package parallel or package snow. |
Examples
set.seed(34903490)
x = rnorm(50)
y = 0.5*x^2 + 2*x + rnorm(length(x))
frm = data.frame(x=x,yC=y>=as.numeric(quantile(y,probs=0.8)))
WVPlots::ROCPlot(frm, "x", "yC", TRUE, title="Example ROC plot")