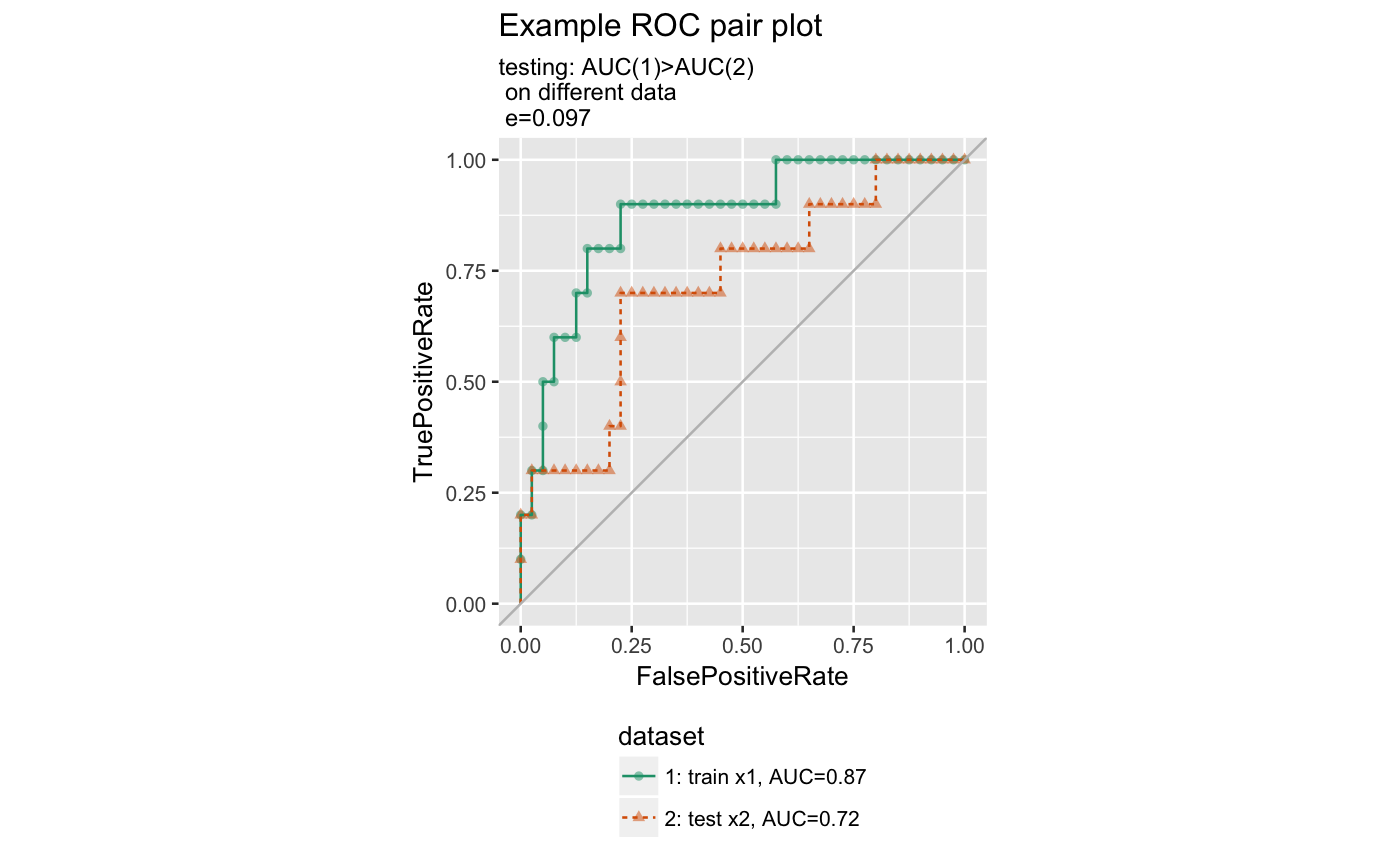
Plot two receiver operating characteristic plots from unrelated frames.
Plot two receiver operating characteristic plots from unrelated frames.
ROCPlotPair2(nm1, frame1, xvar1, truthVar1, truthTarget1, nm2, frame2, xvar2,
  truthVar2, truthTarget2, title, ..., returnScores = FALSE, nrep = 100,
  parallelCluster = NULL)
Arguments
| nm1 | name of first model |
|---|---|
| frame1 | data frame to get values from |
| xvar1 | name of the first independent (input or model) column in frame |
| truthVar1 | name of the dependent (output or result to be modeled) column in frame |
| truthTarget1 | value we consider to be positive |
| nm2 | name of second model |
| frame2 | data frame to get values from |
| xvar2 | name of the first independent (input or model) column in frame |
| truthVar2 | name of the dependent (output or result to be modeled) column in frame |
| truthTarget2 | value we consider to be positive |
| title | title to place on plot |
| ... | no unnamed argument, added to force named binding of later arguments. |
| returnScores | logical if TRUE return detailed permutedScores |
| nrep | number of permutation repititions to estimate p values. |
| parallelCluster | (optional) a cluster object created by package parallel or package snow. |
Examples
set.seed(34903490)
x1 = rnorm(50)
x2 = rnorm(length(x1))
y = 0.2*x2^2 + 0.5*x2 + x1 + rnorm(length(x1))
frm = data.frame(x1=x1,x2=x2,yC=y>=as.numeric(quantile(y,probs=0.8)))
# WVPlots::ROCPlot(frm, "x1", "yC", TRUE, title="Example ROC plot")
# WVPlots::ROCPlot(frm, "x2", "yC", TRUE, title="Example ROC plot")
WVPlots::ROCPlotPair2('train',frm, "x1", "yC", TRUE,
                      'test', frm, "x2", "yC", TRUE,
                      title="Example ROC pair plot")