Plot a scatter plot with marginals. xvar is the independent variable (input or model) and yvar is the dependent variable
Plot a scatter plot with marginals. xvar is the independent variable (input or model) and yvar is the dependent variable
ScatterHist(frame, xvar, yvar, title, ..., smoothmethod = "auto",
  annot_size = 5, minimal_labels = TRUE, binwidth_x = NULL,
  binwidth_y = NULL, adjust_x = 1, adjust_y = 1)
Arguments
| frame | data frame to get values from |
|---|---|
| xvar | name of the independent (input or model) column in frame |
| yvar | name of the dependent (output or result to be modeled) column in frame |
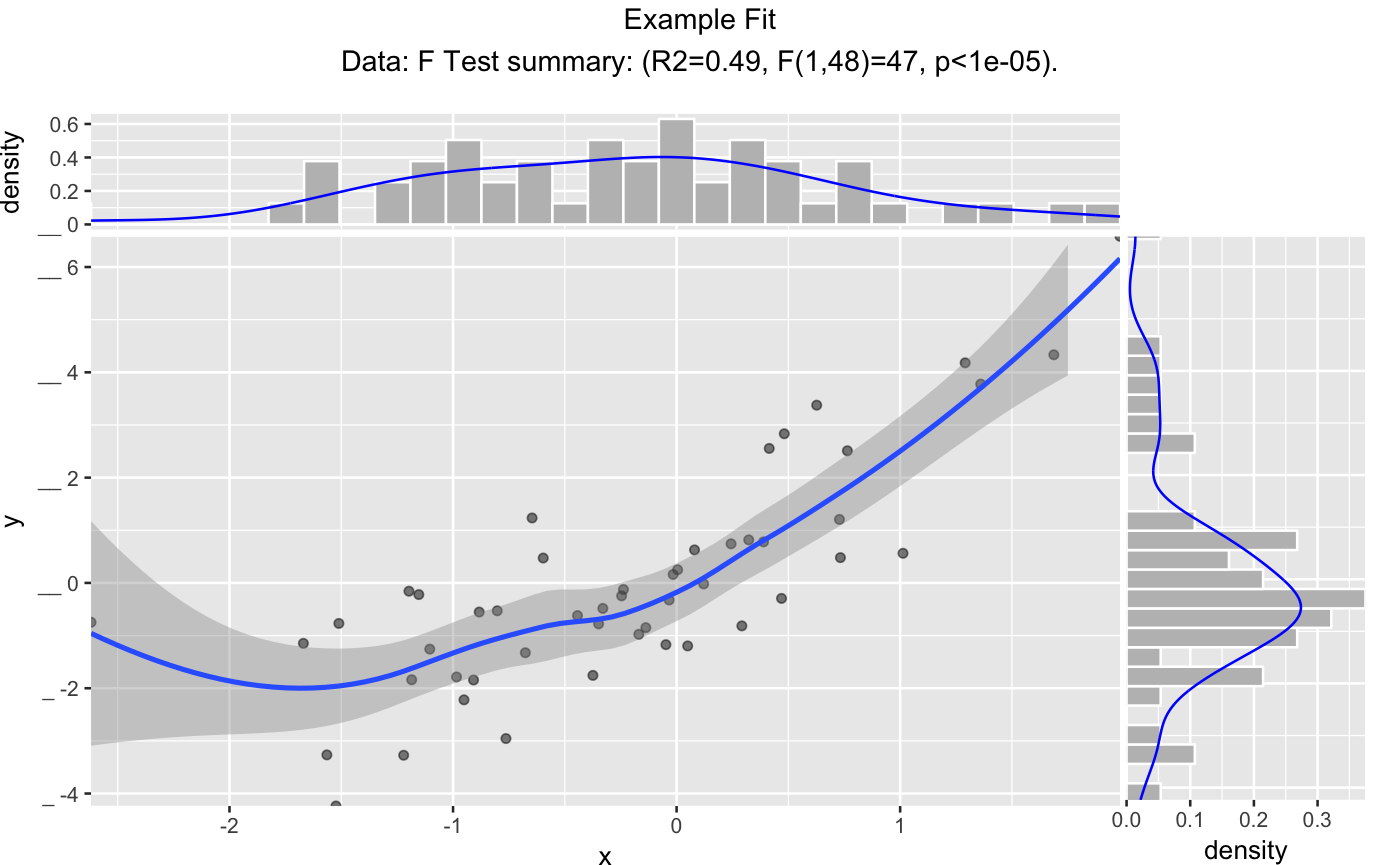
| title | title to place on plot |
| ... | no unnamed argument, added to force named binding of later arguments. |
| smoothmethod | (optional) one of 'auto' (the default), 'loess', 'gam', 'lm', or 'identity'. If smoothmethod is 'auto' or 'lm' a smoothing curve or line (respectively) is added and R-squared of the best linear fit of xvar to yvar is reported. If smoothmethod is 'identity' then the y=x line is added and the R-squared of xvar to yvar (without the linear transform used in the other smoothmethod modes) is reported. |
| annot_size | numeric scale annotation text (if present) |
| minimal_labels | logical drop some annotations |
| binwidth_x | numeric binwidth for x histogram |
| binwidth_y | numeric binwidth for y histogram |
| adjust_x | numeric adjust x density plot |
| adjust_y | numeric adjust y density plot |
Examples
set.seed(34903490) x = rnorm(50) y = 0.5*x^2 + 2*x + rnorm(length(x)) frm = data.frame(x=x,y=y) WVPlots::ScatterHist(frm, "x", "y", title="Example Fit")#>#>