Plot a height scatter plot with marginals. xvar is the independent variable (input or model), and yvar is the dependent variable, and zvar is the condition height.
Plot a height scatter plot with marginals. xvar is the independent variable (input or model), and yvar is the dependent variable, and zvar is the condition height.
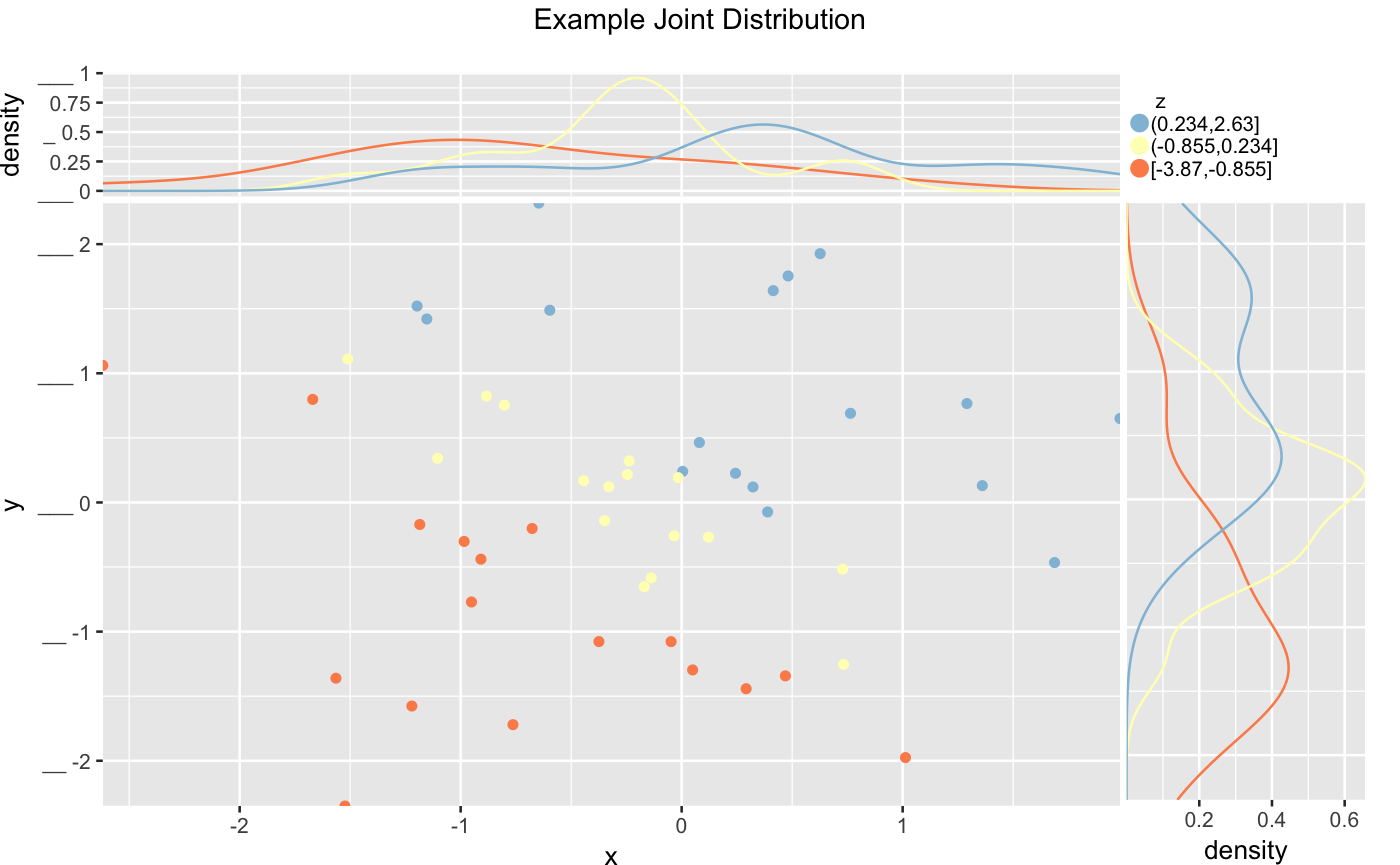
ScatterHistN(frame, xvar, yvar, zvar, title, ..., annot_size = 3,
  colorPalette = "RdYlBu", nclus = 3, adjust_x = 1, adjust_y = 1)
Arguments
| frame | data frame to get values from |
|---|---|
| xvar | name of the independent (input or model) column in frame |
| yvar | name of the dependent (output or result to be modeled) column in frame |
| zvar | name of height variable |
| title | title to place on plot |
| ... | no unnamed argument, added to force named binding of later arguments. |
| annot_size | numeric scale annotation text (if present) |
| colorPalette | name of a Brewer palette (see http://colorbrewer2.org/ ) |
| nclus | scalar number of z-clusters to plot |
| adjust_x | numeric adjust x density plot |
| adjust_y | numeric adjust y density plot |
Examples
set.seed(34903490)
frm = data.frame(x=rnorm(50),y=rnorm(50))
frm$z <- frm$x+frm$y
WVPlots::ScatterHistN(frm, "x", "y", "z", title="Example Joint Distribution")