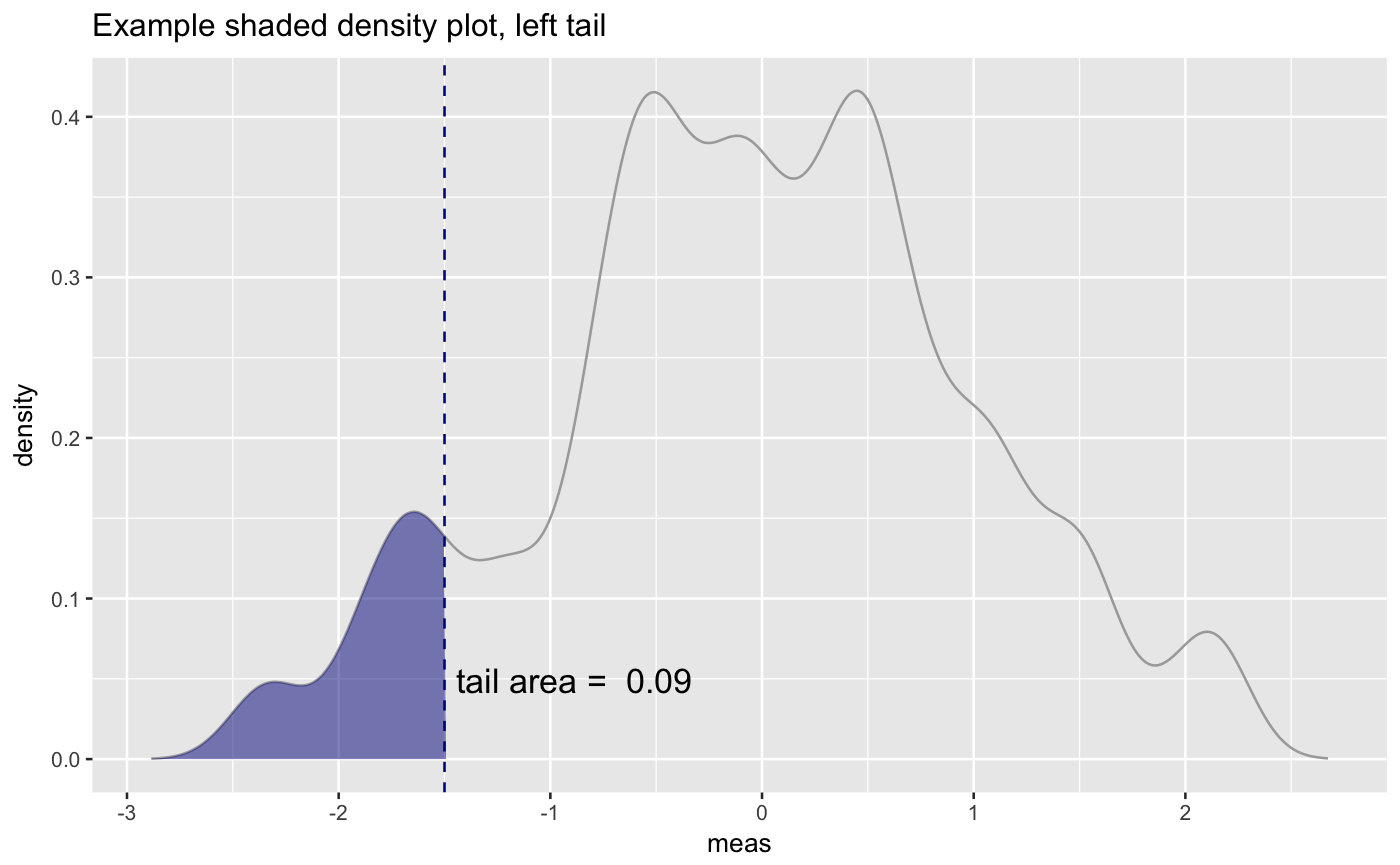
Plot the distribution of a variable with a tail shaded
Plot the distribution of a variable with a tail shaded
ShadedDensity(frame, xvar, threshold, title, ..., tail = "left")
Arguments
| frame | data frame to get values from |
|---|---|
| xvar | name of the variable to be density plotted |
| threshold | boundary value for the tail |
| title | title to place on plot |
| ... | no unnamed argument, added to force named binding of later arguments. |
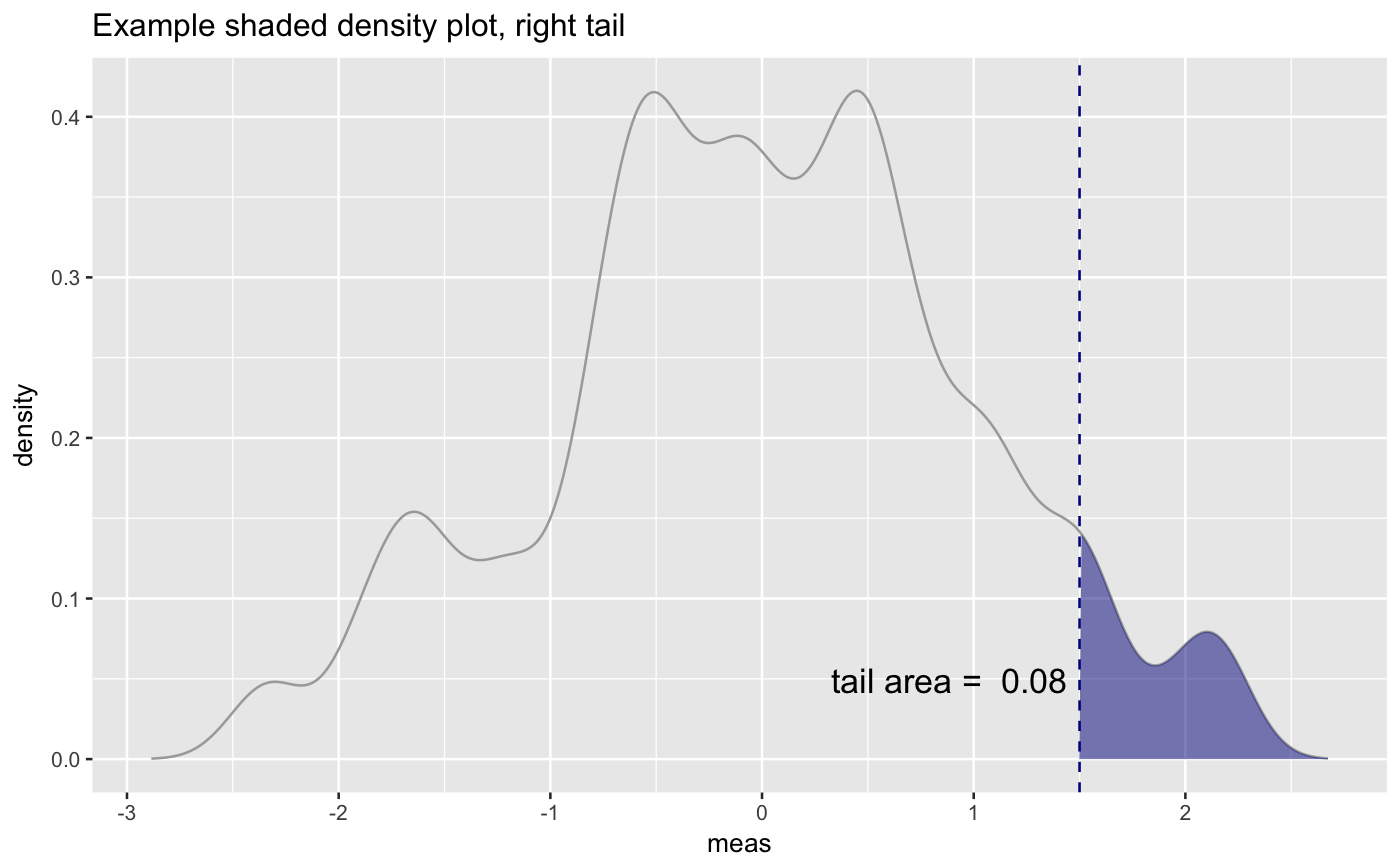
| tail | which tail to shade, 'left' (default) or 'right' |
Examples
set.seed(52523)
d = data.frame(meas=rnorm(100))
threshold = -1.5
WVPlots::ShadedDensity(d, "meas", threshold,
                       title="Example shaded density plot, left tail")WVPlots::ShadedDensity(d, "meas", -threshold, tail="right",
                       title="Example shaded density plot, right tail")