dsh-skill-invocation-monitor
English | 简体中文


> A **read-only** [DeepSeek Harness](https://github.com/deepseek-ai/deepseek-harness) (DSH) plugin that puts
> every skill invocation on one screen: which Agents are running, which Skill each one is calling,
> whether it is running / finished / failed, and how long it has been going — live, in the Web GUI sidebar.
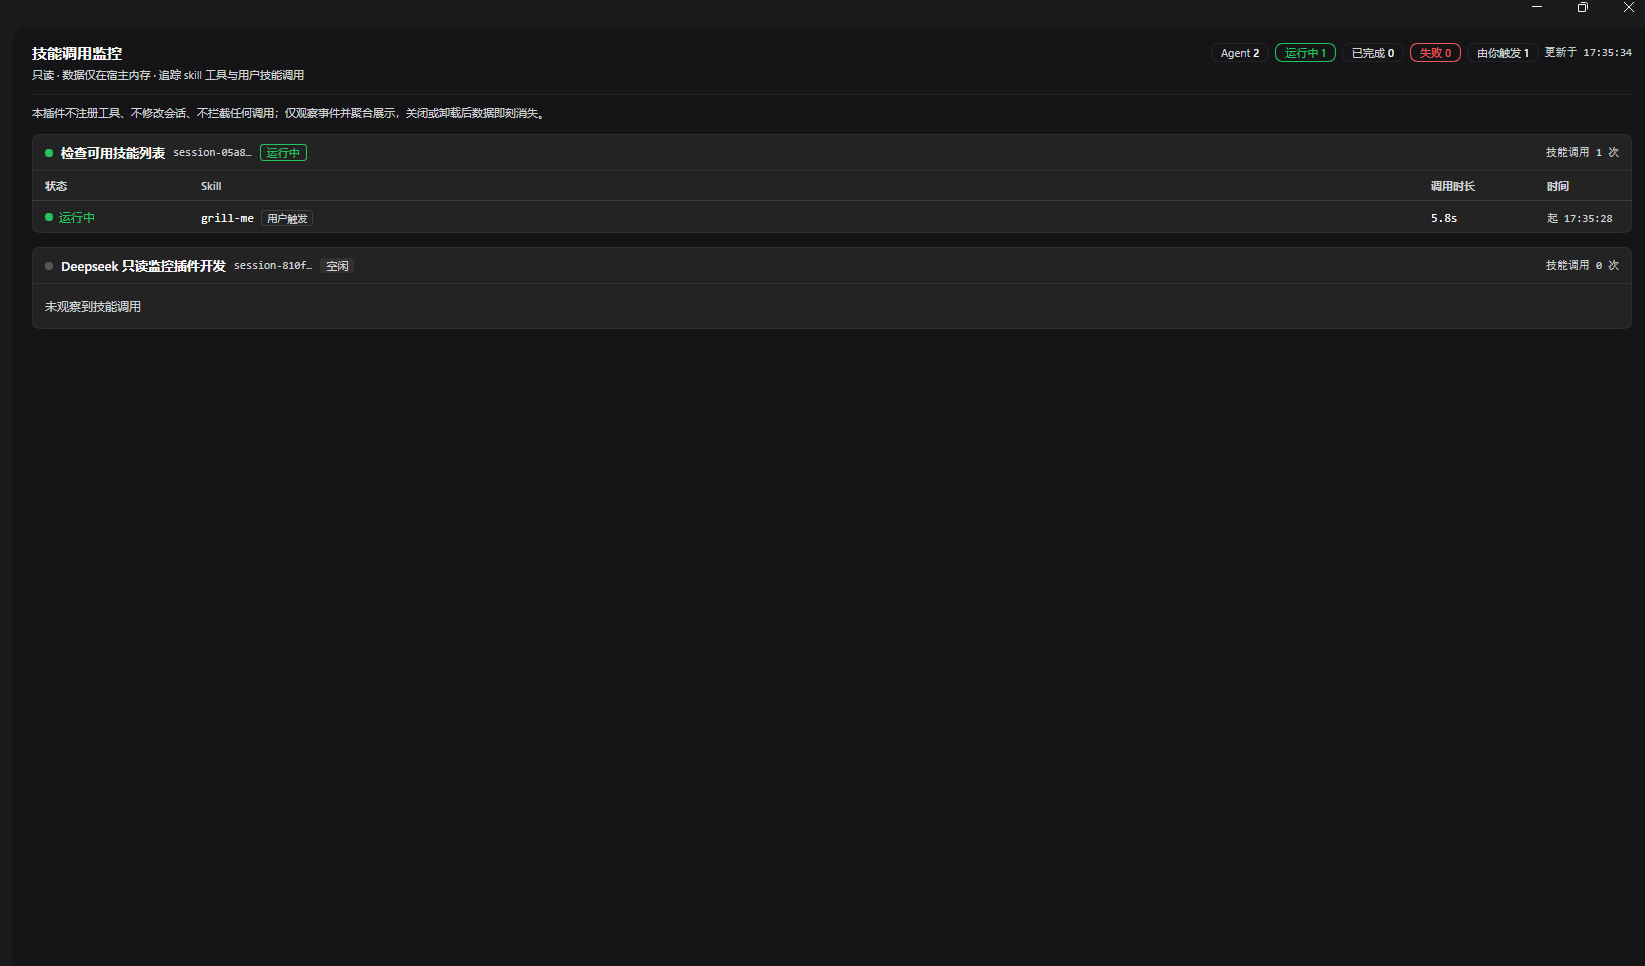
*Captured from the running plugin: the sidebar entry opens a panel listing every Agent, and each row is one
skill call with its status, elapsed time and start clock.*
## What changes after you install it
Skill invocation in DSH is invisible. The model loads a skill, and you see the answer — not the call, not
the timing, not the one that never came back. After installing this plugin:
- the sidebar gains a **技能监控 / Skill Monitor** entry, with a live badge showing how many calls are running;
- the panel lists every live Agent, and under each one every skill call with its **status** and **elapsed time**;
- **both** ways a skill can be reached are covered and told apart — the model calling the `skill` tool, and
**you** triggering a skill yourself, which carries a `用户触发` badge on its row;
- nothing is written anywhere: no tool registered, no session state touched, no call intercepted or delayed.
## Install
```sh
# from npm (recommended — prebuilt, so no build-script permission is needed)
dsh plugin --profile web add @yyc-jnu/dsh-skill-invocation-monitor
# or straight from GitHub (plain ESM JavaScript: no build step, so pnpm never asks for allowBuilds)
dsh plugin --profile web add github:YYC-JNU/dsh-skill-invocation-monitor
```
Then **restart DSH and refresh the page**. Both halves — the host observers plus the read-only route, and the
browser bundle — are scanned during host start-up, so no sidebar entry appears before that restart.
Verify the layer before booting:
```sh
dsh --profile web --dump-config # look for: # == @yyc-jnu/dsh-skill-invocation-monitor
```
If that layer is missing, the package installed as a plain dependency and the plugin never activated.
Uninstall:
```sh
dsh plugin --profile web remove @yyc-jnu/dsh-skill-invocation-monitor
```
## Features
| | |
|---|---|
| Live Agent list | Every live Agent, its session title, and whether it is running or idle |
| Per-call rows | Skill name, status (`运行中` / `已完成` / `失败` / `未观测到结果`), elapsed time, start clock |
| Both invocation paths | The model's `skill` tool call, and a human triggering a skill — marked `用户触发` |
| Ticking durations | The elapsed time updates every second while a call is running |
| Sidebar badge | The running-call count sits on the sidebar entry, so you can see activity without opening the panel |
| Honest failures | A failed call shows a truncated reason, e.g. `skill "…" is unknown or no longer available` |
| Self-check diagnostics | Every response carries counters describing what the plugin observed, so a wrong assumption is visible rather than silent |
| Zero dependencies | Neither half imports a third-party package (the browser half uses only `react` from the host module table) |
## Permissions and data
This plugin exists to observe, and its whole design is built around not participating.
| | |
|---|---|
| Observes (read-only) | Five Cordis events: `tools/pre-execute`, `tools/result`, `session/event`, `agent/status`, `agent/disposed` |
| Reads | The live Agent list, session titles, and the durable session-event feed as it is appended |
| Does **not** write | No session state, no session log, nothing on disk, no config, no tool, no command |
| Does **not** interfere | The `tools/pre-execute` listener returns `next()` unchanged and never denies, cancels, rewrites or delays a call; every observer is wrapped so a bug in this plugin cannot break a dispatch |
| HTTP surface | Exactly one route, `GET /api/plugins/skill-monitor/state` — no body, no mutation, `cache-control: no-store` |
| Network exposure | Loopback only: a non-loopback peer, a cross-site fetch marker or a foreign `Origin` gets `403`; any non-GET method gets `405` |
| Where the data lives | One `Map` in host memory. Records are capped (200 by default) and expire (10 minutes after they settle); restarting DSH clears everything |
| Not collected | Prompt text, model output, file contents, credentials, or anything else the plugin never reads |
## Compatibility
| | |
|---|---|
| DSH | Verified against **0.2.0-rc.2** (the build this plugin was developed and tested on). The seams it uses are documented core surfaces, so other 0.2.x builds are expected to work |
| Node.js | Declared `>=20`. The plugin runs inside the DSH host, so the host's own Node requirement is what matters |
| Surface | Web GUI (`dsh.client.platform: "web"`). Uses only official Slots — `sidebar.panellist` for the entry and `main` for the panel — never DOM injection |
| Skill paths | Uses the durable contracts for both paths: tool calls on `tools/pre-execute` / `tools/result`, and human invocations through the `skill-invocation` message source declared by the skills seam |
## How it works
The two invocation paths — and why the human one is read from a message source
A skill can be reached two structurally different ways in DSH, and the plugin observes both.
| | Model path | User path |
|---|---|---|
| Trigger | The model calls the `skill` tool | You invoke a skill (e.g. `/grill-me`) |
| What DSH does | Runs the tool pipeline and produces a tool result | Appends the skill's instructions to the conversation as a `user/message` — **no tool call and no command event** |
| Pairing key | `callId` | the message `id` |
| Duration measured | `tools/result` − `pre-execute` | `turn/end` − injection (see the note below) |
| Row marker | none | `用户触发` |
The human path is read from the structured source the skills seam itself attaches
(`SkillInvocationSource`, in the persistence catalog):
```json
{ "type": "user/message", "data": {
"source": { "kind": "skill-invocation", "name": "grill-me", "form": "instructions" },
"role": "user", "id": "7c2e0f5a-3b9d-4e18-9a6c-1d2f3a4b5c6d" } }
```
The name comes straight from `source.name`, so no skill-catalog lookup and no text parsing is involved. That
is a measured result, not a guess: an earlier implementation assumed the human path went through
`command/run` / `command/done`, and a real session log disproved it — a human-invoked skill produces no
command event at all, which removed an entire catalog cache and its 60-second TTL.
**One deliberate choice:** a human skill has no result event of its own, so its duration is the *turn window*
(injection until `turn/end`), not the skill's own execution time. That is a stated convention, not a
measurement — if you would rather see an instantaneous event with a duration of 0, only the settling point
changes.
Status semantics
| Status | Meaning |
|---|---|
| `运行中` | A start was observed (a pre-execute or a skill message) and no ending event has arrived; the duration grows live |
| `已完成` | The tool reported `isError === false`, or the turn that carried the skill ended normally |
| `失败` | The tool reported `isError === true`; the row shows a truncated reason |
| `未观测到结果` | No ending event arrived within 15 minutes (the call was denied before dispatch, its parent was cancelled, the host crashed). This is a *derived* status and is never written back into the record |
The read-only contract
This is the plugin's core constraint, and there are tests asserting each row.
| Constraint | How it is implemented |
|---|---|
| Registers no writable tool | Never touches `ctx.tools` — no `register`, `restrict` or `guard`; `apply()` adds no member to `ctx` (asserted by a test) |
| Modifies no session state | Never appends a session event, never writes a session log, never calls a service method; only reads `agents.list()` / `sessions.get()` / `sessionTitle.get()` |
| Intercepts nothing | The `tools/pre-execute` listener returns `next()` untouched and never denies, cancels, rewrites or measures; a hostile arguments Proxy cannot make it block a call (asserted by a test) |
| Writes nothing to disk | All state is one in-memory `Map`, capped and expiring; no history, no persistence, no alerting |
| One read-only route | `GET /api/plugins/skill-monitor/state` only — no POST, no request body, no write path |
| Zero runtime dependencies | Neither half imports a third-party package |
Diagnostics — how a wrong assumption stays visible instead of silent
Every state response carries a `diagnostics` object describing what the plugin actually saw:
| Field | What it tells you |
|---|---|
| `sessionEvents` | The durable event feed did reach the plugin |
| `skillInjections` / `trackedInjections` | Human skill messages were seen and recorded |
| `unmatchedInjections` | A `skill-invocation` message arrived whose name could not be read |
| `turnEnds` / `settledByTurnEnd` | Turn endings arrived, and how many human records they closed |
This is not decoration: it is what caught the disproved command-path assumption in the first place.
Configuration (optional)
```yaml
- id: skill-invocation-monitor
name: '@yyc-jnu/dsh-skill-invocation-monitor'
config:
maxRecords: 200 # in-memory record cap
retentionMs: 600000 # keep settled records for 10 minutes
staleMs: 900000 # no outcome within 15 minutes → 未观测到结果
maxCallsPerAgent: 20 # rows shown per Agent in the panel
```
## Development
Tests, scripts and repository layout — for contributors
```sh
cd dsh-skill-invocation-monitor
npm run verify # node --check on all three entry files
npm test # 72 offline tests: node --test
```
72 offline tests cover three layers: the pure aggregation model (`test/tracker.test.mjs`, 36 — duration
settling for both paths, pairing keys, staleness, eviction and caps, Agent merging, field-name parsing of the
durable payload), the read-only contract itself (`test/host-plugin.test.mjs`, 25 — exactly five events, exactly
one GET route, a pure passthrough pre-execute listener, loopback fencing, disposal), and the browser bundle
(`test/client-bundle.test.mjs`, 11 — loaded the way the shell loads it, asserting the slot registrations and
the rendered output).
The plugin is plain ESM JavaScript: `lib/` **is** the source, there is no build step and no `src/`.
```
dsh-skill-invocation-monitor/
├── package.json # name / exports / dsh.bundle.patch / dsh.client
├── cordis.patch.yml # the one profile row both halves hang off
├── lib/
│ ├── host/
│ │ ├── index.js # host half: 5 read-only observers + 1 GET route
│ │ └── tracker.js # pure aggregation model (no Cordis, no I/O, explicit timestamps)
│ └── client.js # browser half: ModuleLoader bundle, 2 slot registrations
├── docs/
│ ├── screenshot.png # the screenshot above
│ └── skill-monitor-flow.json # archify sequence-diagram source
└── test/ # 72 offline tests
```
## License
[MIT](LICENSE)
## Acknowledgements
The code in this plugin was written with **AI assistance**: the author defined the requirements, reviewed the
results and accepted them, while the AI produced the implementation and the documentation. Every behaviour was
verified against a running DSH instance; session titles, message ids and timestamps in tests and examples are
synthetic and contain no real user data.