# ts-raster
ts-raster is a python package for analyzing time-series characteristics from raster data.
It allows feature extraction, dimension reduction and applications of machine learning techniques for geospatial data.
- input data : historical raster data (e.g. Monthly temperature data (2000-2018)
- extracted features: Mean, minimum, maximum, variance, standard deviation... of the input data
- output: dataframe with features as columns or raster file with features as bands
### Installation
stable version:
pip install tsraster
from github:
git clone https://github.com/mmann1123/ts-raster.git
cd ts-raster
pip install e .
### Input Data Structure
The input raster files from which features will be extracted are organized to allow extraction from files contained multiple folders.
Example data for annual summaries:
temprature
2005
tmx-200501.tif
tmx-200502.tif
tmx-200503.tif ...
2006
tmx-200601.tif
tmx-200602.tif
tmx-200603.tif...
2007
...
Example data for multi-period (5 year) summaries:
temprature
2005-2010
tmx-200501.tif
...
tmx-201012.tif
2011-2015
tmx-201101.tif
...
tmx-201512.tif
...
temprature: *the variable*
- 2005, 2006, 2007: *the years*
- tmx-200501.tif: the image
- tmx : unique identifier of each image
- 200501: year and month
ts-raster will consider the value '200501' as a unique time identifier.
#### Usage:
```python
from tsraster.prep import sRead as tr
from tsraster.calculate import calculateFeatures
#directory
path = "../docs/img/temperature/"
image_name = tr.image_names(path)
print(image_name)
```
['tmx-200601', 'tmx-200603', 'tmx-200602', 'tmx-200703', 'tmx-200702', 'tmx-200701', 'tmx-200501', 'tmx-200502', 'tmx-200503']
Convert each image to array and stack them as bands
```python
rasters = tr.image2array(path)
rasters.shape
```
(1120, 872, 9)
Calculate Features
The number of features one can extract can be customized by choosing from the complete list of the statistical summaries
listed [here](https://tsfresh.readthedocs.io/en/latest/text/list_of_features.html).
The following example, for instance, contains 16 features.
parameters = {
"mean": None,
"maximum": None,
"median":None,
"minimum":None,
"mean_abs_change":None,
"mean_change":None,
"quantile":[{"q": 0.15},{"q": 0.05},{"q": 0.85},{"q": 0.95}],
"longest_strike_above_mean":None,
"longest_strike_below_mean":None,
"number_cwt_peaks":[{"n": 6},{"n": 12}],
"skewness":None,
"sum_values":None
}
```python
ts_features = calculateFeatures(path=path,
parameters=parameters,
reset_df=False,
tiff_output=False)
```
Feature Extraction: 100%|██████████| 50/50 [09:57<00:00, 2.31s/it]
../docs/img/temperature/extracted_features.csv
Set `rest_df` to `True` if the raster files have already been converted to a pandas dataframe.
To save the extracted features as stacked bands in one GeoTiff file, turn `tiff_output`, to`True`.
output option (1): pandas-dataframe
```python
ts_features.describe()
```
variable value__longest_strike_above_mean value__longest_strike_below_mean value__maximum value__mean value__mean_abs_change value__mean_change value__median value__minimum value__number_cwt_peaks__n_12 value__number_cwt_peaks__n_6 value__quantile__q_0.05 value__quantile__q_0.15 value__quantile__q_0.85 value__quantile__q_0.95 value__skewness value__sum_values
count 976640.000000 976640.000000 976640.000000 976640.000000 976640.000000 976640.000000 976640.000000 976640.000000 976640.000000 976640.000000 976640.000000 976640.000000 976640.000000 976640.000000 976640.000000 976640.000000
mean 6.848954 6.842414 12.174632 7.053721 2.441626 0.398589 5.764061 3.676642 0.381241 0.588133 3.836781 4.149142 10.977326 11.764437 0.226742 63.483490
std 2.873678 2.881861 16.604448 9.836145 3.339791 0.560275 8.230023 5.625607 0.529043 0.839891 5.801362 6.174634 15.021573 16.064091 0.310793 88.525303
min 1.000000 2.000000 0.000000 -0.569444 0.000000 0.000000 -4.375000 -7.250000 0.000000 0.000000 -7.100000 -6.800000 0.000000 0.000000 -0.686569 -5.125000
25% 3.000000 3.000000 0.000000 0.000000 0.000000 0.000000 0.000000 0.000000 0.000000 0.000000 0.000000 0.000000 0.000000 0.000000 0.000000 0.000000
50% 9.000000 9.000000 0.000000 0.000000 0.000000 0.000000 0.000000 0.000000 0.000000 0.000000 0.000000 0.000000 0.000000 0.000000 0.000000 0.000000
75% 9.000000 9.000000 31.062500 17.548611 6.531250 1.000000 14.000000 8.687500 1.000000 1.000000 8.962500 9.512500 27.800000 29.975000 0.596130 157.937500
max 9.000000 9.000000 49.000000 30.666667 9.859375 2.000000 27.000000 20.000000 2.000000 3.000000 20.000000 20.200000 45.000000 47.800000 1.558534 276.000000
output option(2): multi-bands image
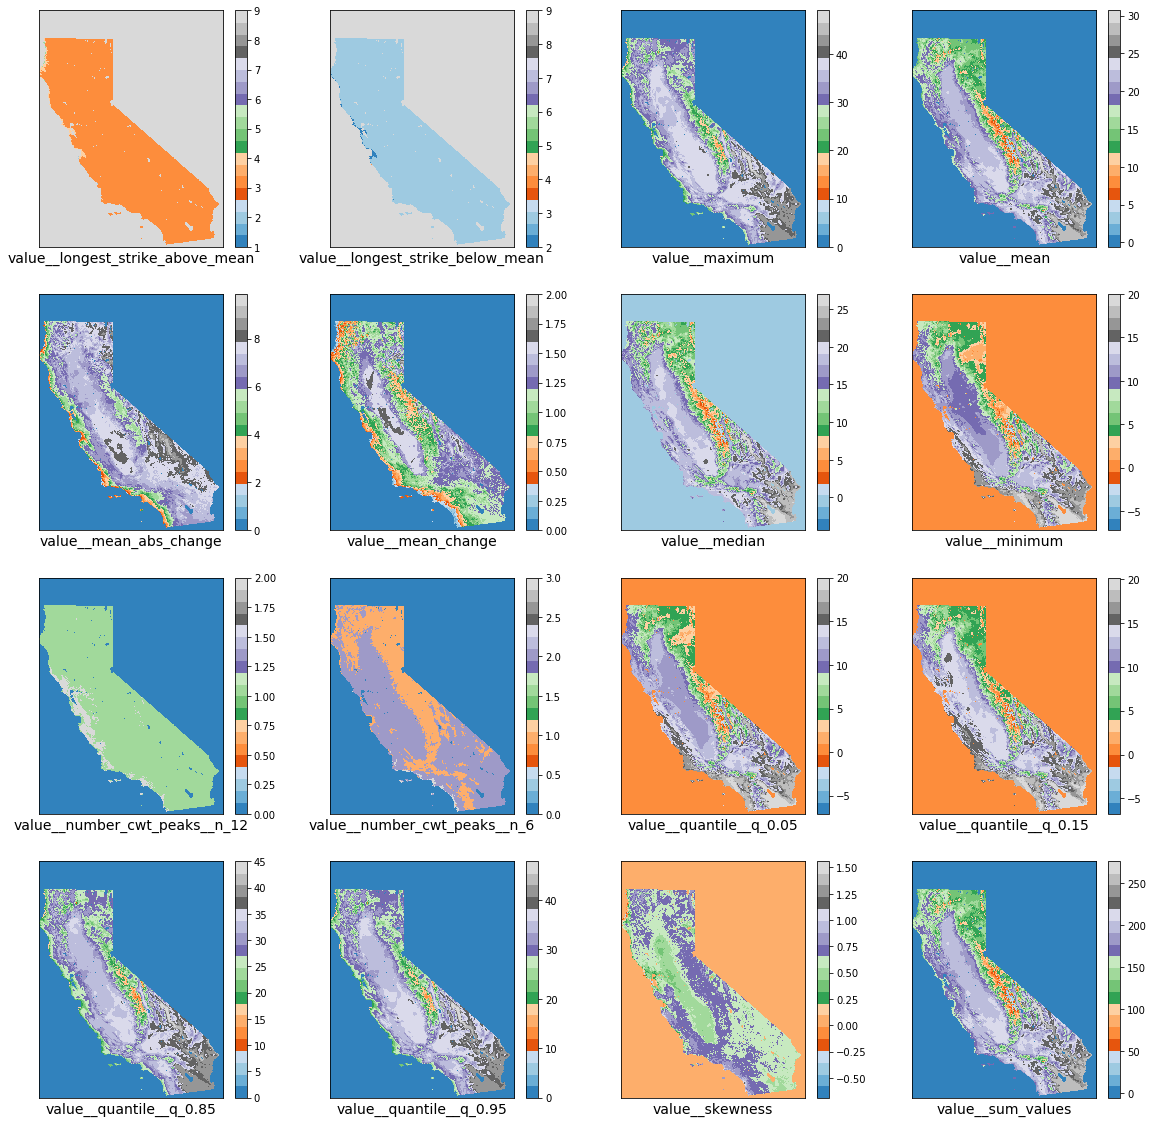
ts-raster also supports:
- identification of relevant features
- dimension reduction through feature selection
- Stratified random sampling from features/raster files
- training and testing machine learning models (random forest, xgboost, elasticnet)
### Acknowledgements
- The feature extraction follows the footsteps of approaches developed in the python package tsfresh.
- All base functionality of this package was coded by [Adane Bedada](https://github.com/adbeda/).
- The package is guided by & developed with Prof. [Mike Mann](https://github.com/mmann1123) of the George Washington University.