{
"metadata": {
"name": "",
"signature": "sha256:1c5ebb89730c3c64ce189e47c46f85bda5aba6b6f46bb20465c33a3b05106385"
},
"nbformat": 3,
"nbformat_minor": 0,
"worksheets": [
{
"cells": [
{
"cell_type": "markdown",
"metadata": {},
"source": [
"##Context:\n",
"\n",
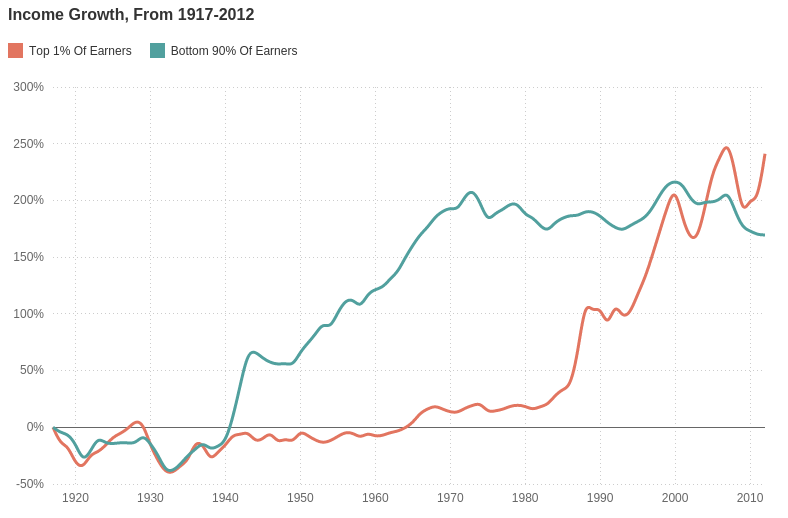
"According to [NPR.org](http://www.npr.org/blogs/money/2015/02/11/384988128/the-fall-and-rise-of-u-s-inequality-in-2-graphs), \"After 1980, only the top 1% saw their incomes rise.\" [Flowing Data](http://flowingdata.com/2015/02/20/top-1-earners-versus-bottom-90/) quoted this figure:\n",
"\n",
"\n",
"\n",
"Another figure:\n",
"\n",
"\n",
"\n",
"Their source came from [World Top Incomes Database](http://topincomes.parisschoolofeconomics.eu/#Database).\n",
"\n",
"I decided to double-check it using a [dataset](https://www.census.gov/hhes/www/income/data/historical/families/2013/f03AR.xls) from census.gov"
]
},
{
"cell_type": "code",
"collapsed": false,
"input": [
"%matplotlib inline\n",
"import pandas as pd\n",
"import seaborn as sns\n",
"sns.set(context=\"poster\", style=\"dark\")\n",
"import mpld3\n",
"import pylab as pl"
],
"language": "python",
"metadata": {},
"outputs": [],
"prompt_number": 43
},
{
"cell_type": "code",
"collapsed": false,
"input": [
"# csv location = https://github.com/aflyax/Python/blob/master/income/income_2013_dollars.csv\n",
"income_df = pd.read_csv(\"income_2013_dollars.csv\", sep='\\t', thousands=',')\n",
"income_df.columns = [\"year\", \"lowest fifth\", \"second fifth\", \"third fifth\", \"fourth fifth\", \"top fifth\", \"top 5%\"]\n",
"income_df.sort(columns=\"year\", inplace=True)\n",
"income_df.head()"
],
"language": "python",
"metadata": {},
"outputs": [
{
"html": [
"\n",
"
\n",
" \n",
" \n",
" | \n",
" year | \n",
" lowest fifth | \n",
" second fifth | \n",
" third fifth | \n",
" fourth fifth | \n",
" top fifth | \n",
" top 5% | \n",
"
\n",
" \n",
" \n",
" \n",
" | 47 | \n",
" 1966 | \n",
" 14747 | \n",
" 32739 | \n",
" 46844 | \n",
" 62710 | \n",
" 107026 | \n",
" 164340 | \n",
"
\n",
" \n",
" | 46 | \n",
" 1967 | \n",
" 14977 | \n",
" 33490 | \n",
" 48138 | \n",
" 64560 | \n",
" 113997 | \n",
" 180362 | \n",
"
\n",
" \n",
" | 45 | \n",
" 1968 | \n",
" 16143 | \n",
" 35208 | \n",
" 50300 | \n",
" 67270 | \n",
" 114947 | \n",
" 177194 | \n",
"
\n",
" \n",
" | 44 | \n",
" 1969 | \n",
" 16656 | \n",
" 36783 | \n",
" 52635 | \n",
" 70510 | \n",
" 120757 | \n",
" 185476 | \n",
"
\n",
" \n",
" | 43 | \n",
" 1970 | \n",
" 16404 | \n",
" 36271 | \n",
" 52445 | \n",
" 70744 | \n",
" 121652 | \n",
" 185243 | \n",
"
\n",
" \n",
"
\n",
"
\n",
"
\n",
" \n",
" \n",
" | \n",
" year | \n",
" lowest fifth | \n",
" second fifth | \n",
" third fifth | \n",
" fourth fifth | \n",
" top fifth | \n",
" top 5% | \n",
"
\n",
" \n",
" \n",
" \n",
" | 4 | \n",
" 2009 | \n",
" 16604 | \n",
" 40232 | \n",
" 65061 | \n",
" 98788 | \n",
" 205788 | \n",
" 352985 | \n",
"
\n",
" \n",
" | 3 | \n",
" 2010 | \n",
" 15944 | \n",
" 39436 | \n",
" 64276 | \n",
" 98064 | \n",
" 199918 | \n",
" 334275 | \n",
"
\n",
" \n",
" | 2 | \n",
" 2011 | \n",
" 15828 | \n",
" 38898 | \n",
" 63212 | \n",
" 96563 | \n",
" 205003 | \n",
" 356839 | \n",
"
\n",
" \n",
" | 1 | \n",
" 2012 | \n",
" 15760 | \n",
" 38739 | \n",
" 63372 | \n",
" 96861 | \n",
" 205503 | \n",
" 357458 | \n",
"
\n",
" \n",
" | 0 | \n",
" 2013 | \n",
" 16109 | \n",
" 39514 | \n",
" 63916 | \n",
" 97207 | \n",
" 206687 | \n",
" 358722 | \n",
"
\n",
" \n",
"
\n",
"
\n",
"
\n",
" \n",
" \n",
" | \n",
" year | \n",
" lowest fifth | \n",
" second fifth | \n",
" third fifth | \n",
" fourth fifth | \n",
" top fifth | \n",
" top 5% | \n",
"
\n",
" \n",
" \n",
" \n",
" | 43 | \n",
" 1970 | \n",
" 16404 | \n",
" 36271 | \n",
" 52445 | \n",
" 70744 | \n",
" 121652 | \n",
" 185243 | \n",
"
\n",
" \n",
" | 13 | \n",
" 2000 | \n",
" 19103 | \n",
" 43678 | \n",
" 68646 | \n",
" 101170 | \n",
" 212266 | \n",
" 376138 | \n",
"
\n",
" \n",
" | 0 | \n",
" 2013 | \n",
" 16109 | \n",
" 39514 | \n",
" 63916 | \n",
" 97207 | \n",
" 206687 | \n",
" 358722 | \n",
"
\n",
" \n",
"
\n",
"