---
title: "Lab 8. Multivariate regression. Dummy variables"
---
```{r setup, include=FALSE}
knitr::opts_chunk$set(echo = TRUE, message = FALSE)
```
## [Assignment sheet](https://github.com/agricolamz/2018-MAG_R_course/blob/master/Lab8_assignment.Rmd)
```{r}
library(tidyverse)
```
## Problem set A
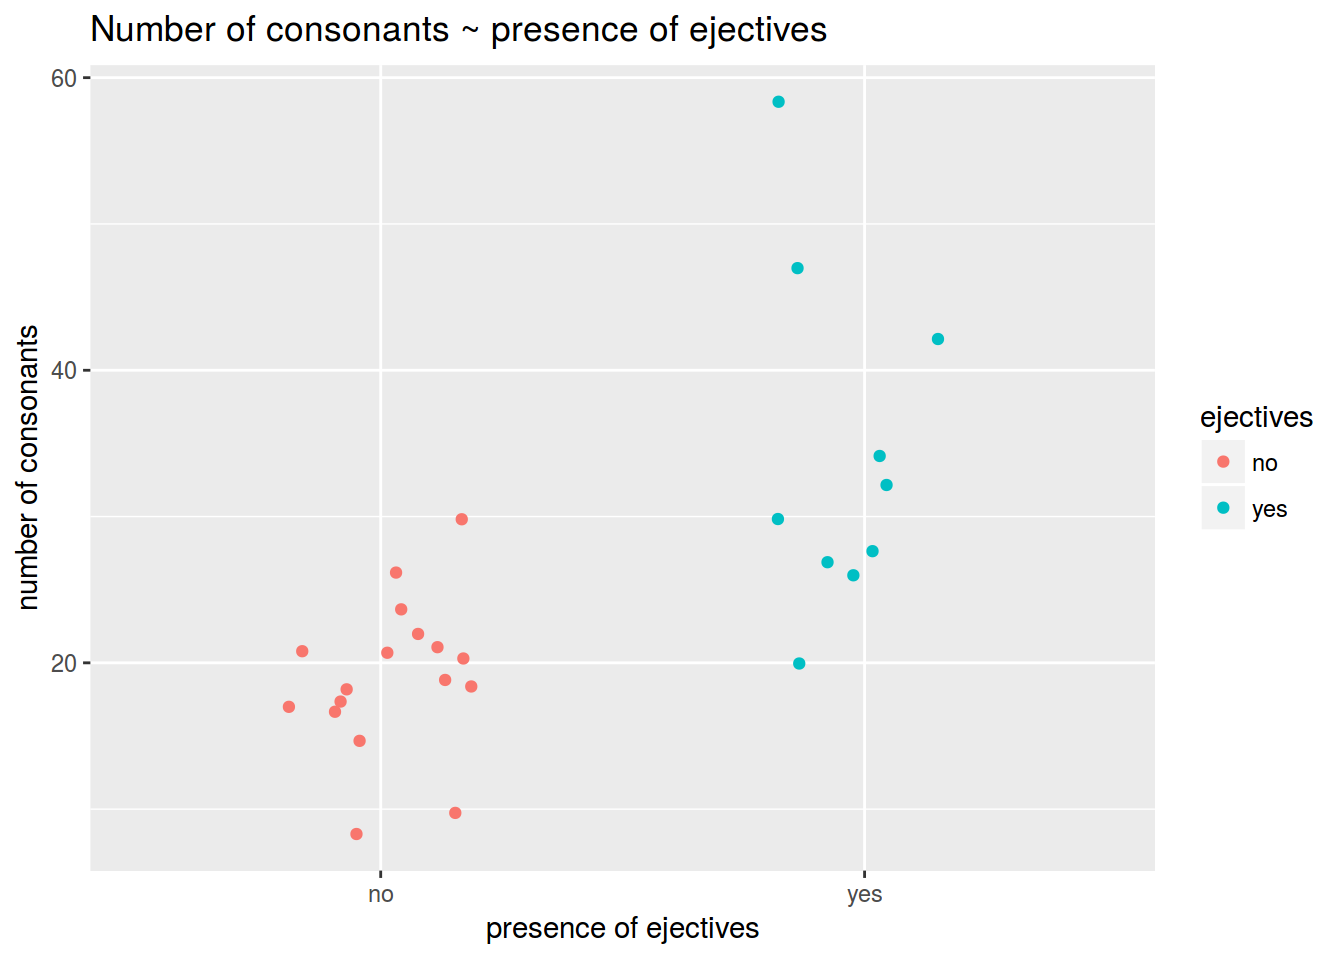
I was interested, whether the languages with ejective sounds have in average more consonants than others. So I collected data from phonological database LAPSyD: [http://goo.gl/0btfKa](http://goo.gl/0btfKa).
### 1.1
Visualise data like this:
 ### 1.2
Calculate the mean number of consonants in languages without ejectives.
```{r}
```
### 1.3
Calculate the mean number of consonants in languages with ejectives.
```{r}
```
### 1.4
Is the mean difference between groups is statistically signifficant?
```{r}
# Your answer:
# Provide the code for statistical testing below:
```
### 1.5
Make a linear regression that predicts the number of consonants by the variable =presence of ejectives=. Write down the formula for the regression line.
```{r}
```
Did you get the point? What is the difference between means values and coefficients of the regression in simple model withe only one dummy-predictor?
## Problem set B
This set is based on (Coretta 2017, https://goo.gl/NrfgJm). This dissertation deals with the relation between vowel duration and aspiration in consonants. Author carried out a data collection with 5 natives speakers of Icelandic. Then he extracted the duration of vowels followed by aspirated versus non-aspirated consonants. Check out whether the vowels before consonants of different places of articulation are signi???cantly different.
Use read.csv("https://goo.gl/7gIjvK") for downloading data.
### 2.1
Create the plot like this.
### 1.2
Calculate the mean number of consonants in languages without ejectives.
```{r}
```
### 1.3
Calculate the mean number of consonants in languages with ejectives.
```{r}
```
### 1.4
Is the mean difference between groups is statistically signifficant?
```{r}
# Your answer:
# Provide the code for statistical testing below:
```
### 1.5
Make a linear regression that predicts the number of consonants by the variable =presence of ejectives=. Write down the formula for the regression line.
```{r}
```
Did you get the point? What is the difference between means values and coefficients of the regression in simple model withe only one dummy-predictor?
## Problem set B
This set is based on (Coretta 2017, https://goo.gl/NrfgJm). This dissertation deals with the relation between vowel duration and aspiration in consonants. Author carried out a data collection with 5 natives speakers of Icelandic. Then he extracted the duration of vowels followed by aspirated versus non-aspirated consonants. Check out whether the vowels before consonants of different places of articulation are signi???cantly different.
Use read.csv("https://goo.gl/7gIjvK") for downloading data.
### 2.1
Create the plot like this.
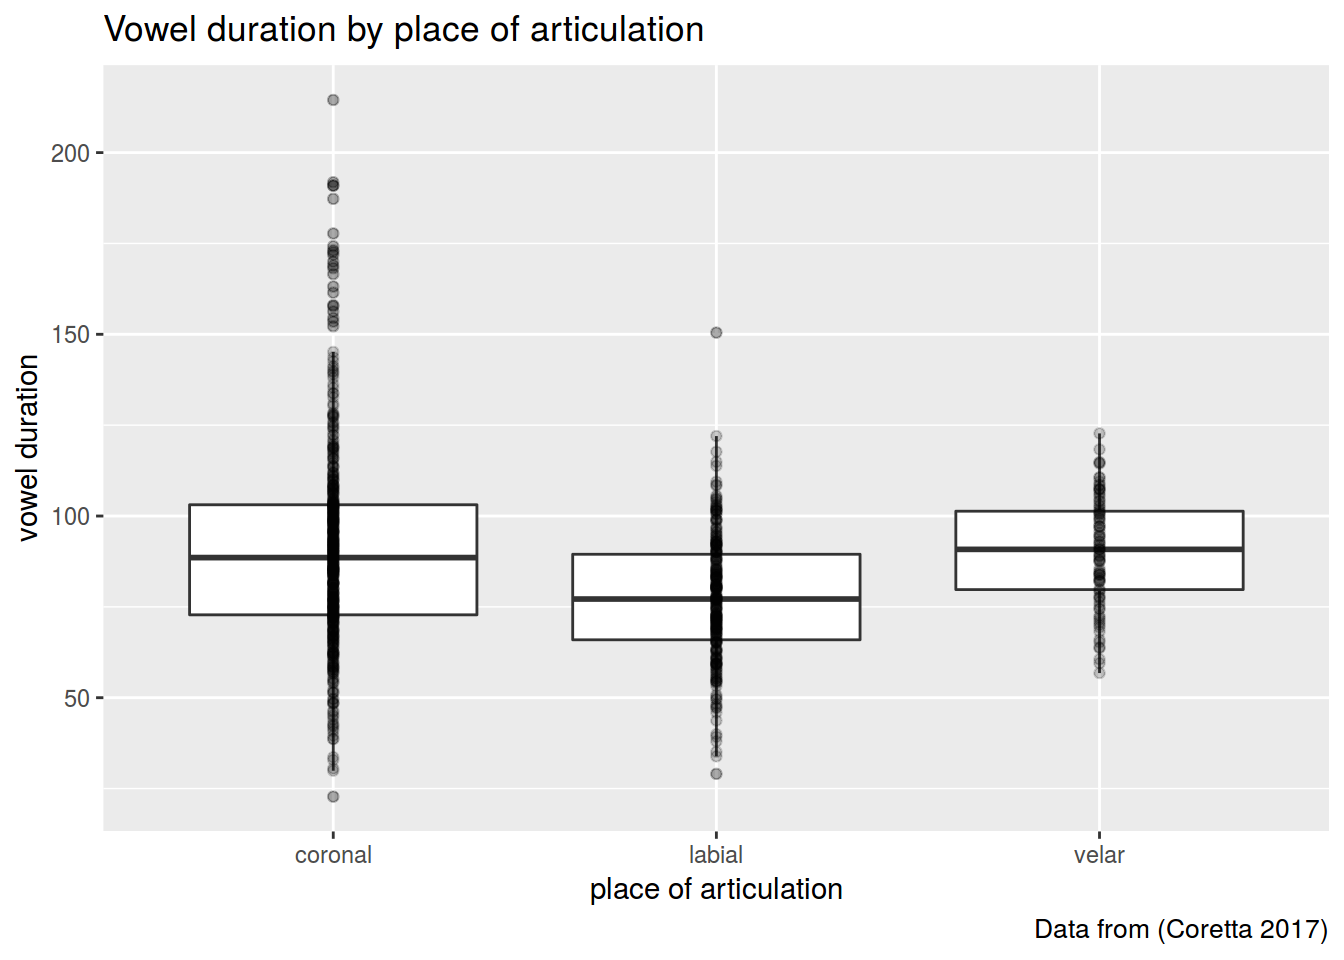 I used alpha and outlier.alpha arguments equal to 0.2.
```{r}
```
### 2.2
Fit a regression model and provide F statistics and p-value for place argument.
```{r}
# Write down the formula:
# F statistics:
# p-value for place:
```
### 2.3
List the model coefficients.
```{r}
#
```
### 2.4
Calculate mean values for vowel duration in each place of articulation group.
```{r}
#
```
Did you get the point? What are the model coefficients?
# Problem set C
The data which we use in this part is a hypothetical study on child language acquisition. We want to investigate the e???ects of amount of time spend in front of TV to two-year-old children???s language development. The response variable in this data set, cdi, is a standard measure of children???s language abilities based on parental reports. The predictor we are mainly interested in is tv.hours, which is the weekly hours of TV time for each child. The data is randomly generated.
The data can be found as an R data file at http://coltekin.net/cagri/R/data/tv.rda.
```{r, eval=FALSE}
load("tv.rda") # you have probably to add a path to your file
head(tv)
summary(tv)
```
### 3.1
Fit a simple regression model where tv.hours is the only predictor of the cdi score. What is the adjusted R???
```{r}
# Provide your code below:
# R^2
```
### 3.2
Fit a simple regression model where mot.education is the only predictor of the cdi score. What is the adjusted R??
```{r}
# Provide your code below:
# R^2
```
### 3.3
Fit a multiple regression model predicting cdi from tv.hours and mot.education. What is the adjusted R???
```{r}
# Provide your code below:
# R^2
```
### 3.4
Fit a multiple regression model predicting cdi from all predictors in a dataset. What is the adjusted R???
```{r}
# Provide your code below:
# R^2
```
### 3.5
Just for training. It would have been nice to be able to do such a graph.
```{r, eval=FALSE}
tv %>%
ggplot(aes(tv.hours, cdi))+
geom_smooth(method="lm")+
geom_point()+
facet_wrap(~tv$book.reading)
```
I used alpha and outlier.alpha arguments equal to 0.2.
```{r}
```
### 2.2
Fit a regression model and provide F statistics and p-value for place argument.
```{r}
# Write down the formula:
# F statistics:
# p-value for place:
```
### 2.3
List the model coefficients.
```{r}
#
```
### 2.4
Calculate mean values for vowel duration in each place of articulation group.
```{r}
#
```
Did you get the point? What are the model coefficients?
# Problem set C
The data which we use in this part is a hypothetical study on child language acquisition. We want to investigate the e???ects of amount of time spend in front of TV to two-year-old children???s language development. The response variable in this data set, cdi, is a standard measure of children???s language abilities based on parental reports. The predictor we are mainly interested in is tv.hours, which is the weekly hours of TV time for each child. The data is randomly generated.
The data can be found as an R data file at http://coltekin.net/cagri/R/data/tv.rda.
```{r, eval=FALSE}
load("tv.rda") # you have probably to add a path to your file
head(tv)
summary(tv)
```
### 3.1
Fit a simple regression model where tv.hours is the only predictor of the cdi score. What is the adjusted R???
```{r}
# Provide your code below:
# R^2
```
### 3.2
Fit a simple regression model where mot.education is the only predictor of the cdi score. What is the adjusted R??
```{r}
# Provide your code below:
# R^2
```
### 3.3
Fit a multiple regression model predicting cdi from tv.hours and mot.education. What is the adjusted R???
```{r}
# Provide your code below:
# R^2
```
### 3.4
Fit a multiple regression model predicting cdi from all predictors in a dataset. What is the adjusted R???
```{r}
# Provide your code below:
# R^2
```
### 3.5
Just for training. It would have been nice to be able to do such a graph.
```{r, eval=FALSE}
tv %>%
ggplot(aes(tv.hours, cdi))+
geom_smooth(method="lm")+
geom_point()+
facet_wrap(~tv$book.reading)
```