Function_Plotter
a Python GUI program that plots an arbitrary user-entered function
## Description
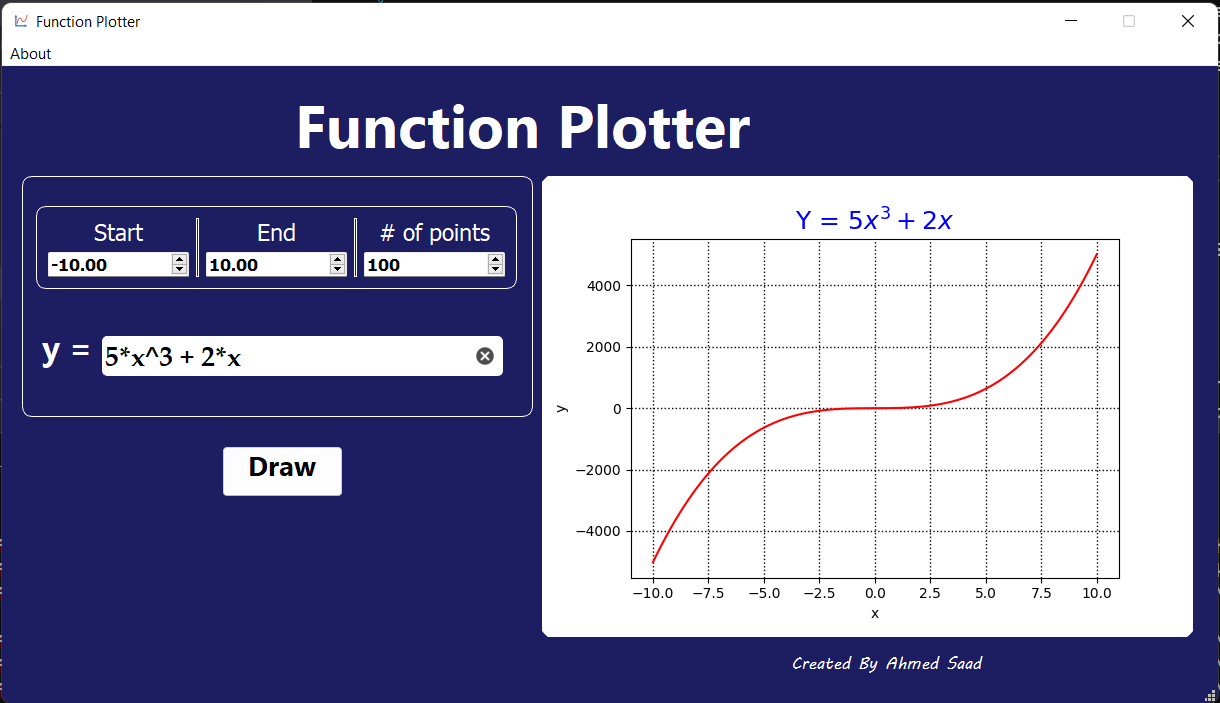
Function Plotter is a Python GUI program that plots an arbitrary user-entered function. The program is written in Python and uses the PySide2 library for the GUI. The program is designed to be user-friendly and easy to use. The user can enter a function in the text box with start , end and number of points then the program will plot it.
## Screenshots
- ### Working Examples
- Function of x
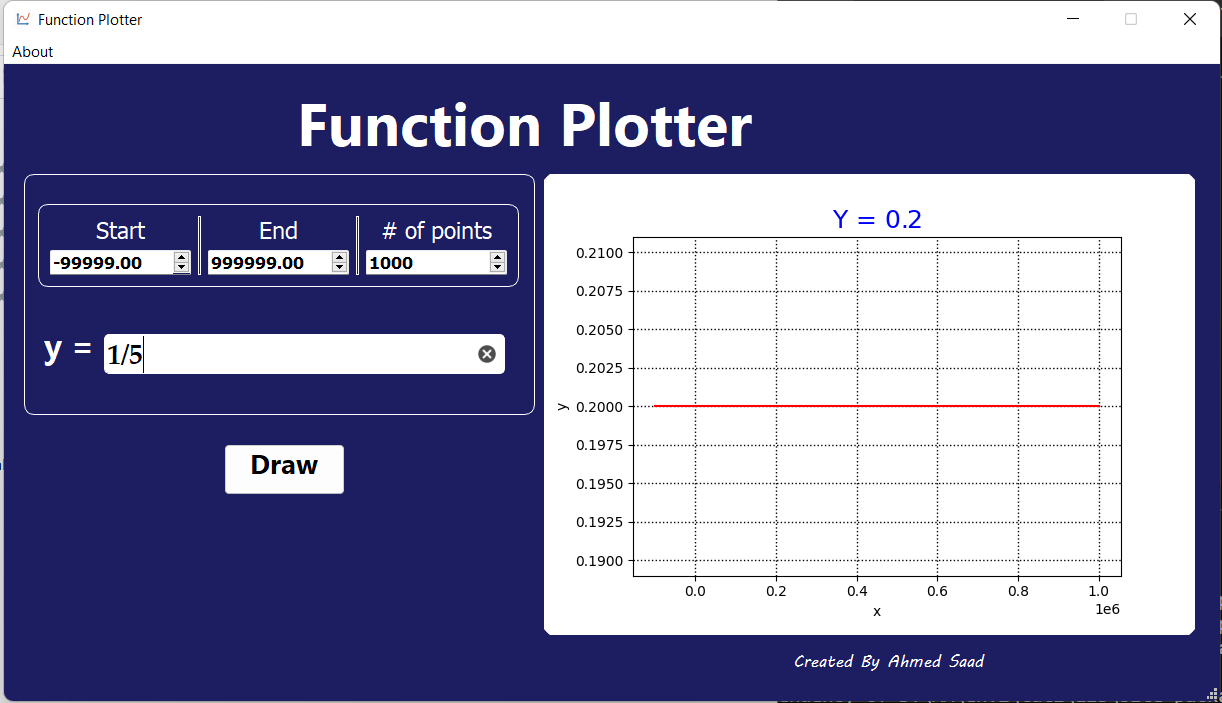
 - Constant
 - ### Errors
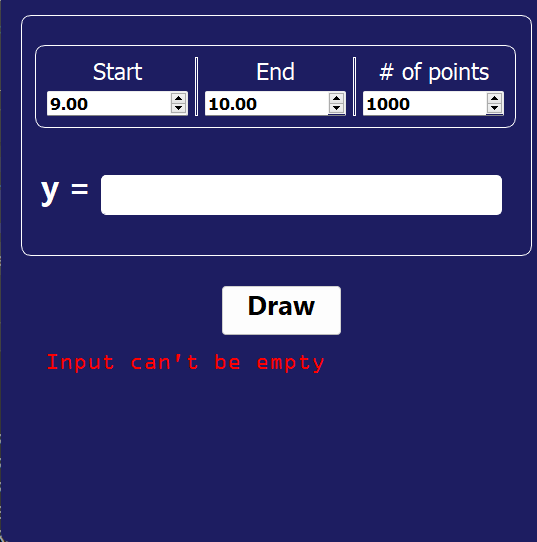
- Empty Text Box
-
- ### Errors
- Empty Text Box
-
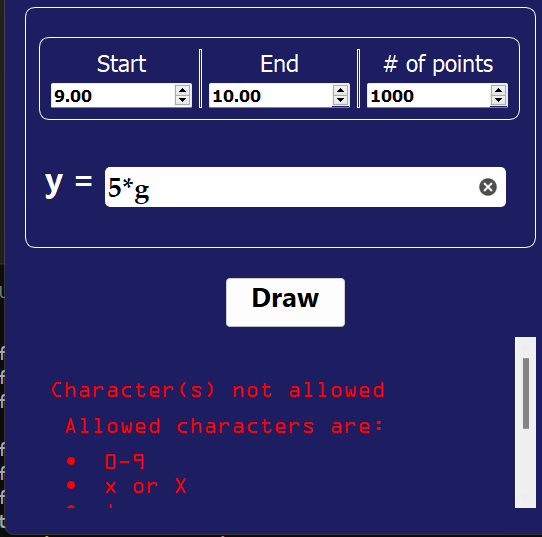
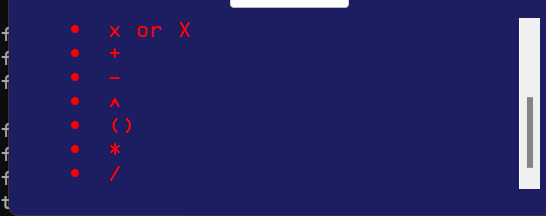
 - Allowed Characters
-
- Allowed Characters
-
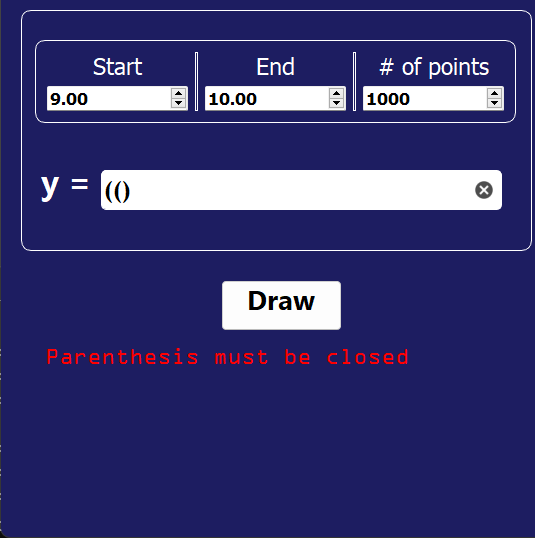
 - Paranthesis Error
-
- Paranthesis Error
-
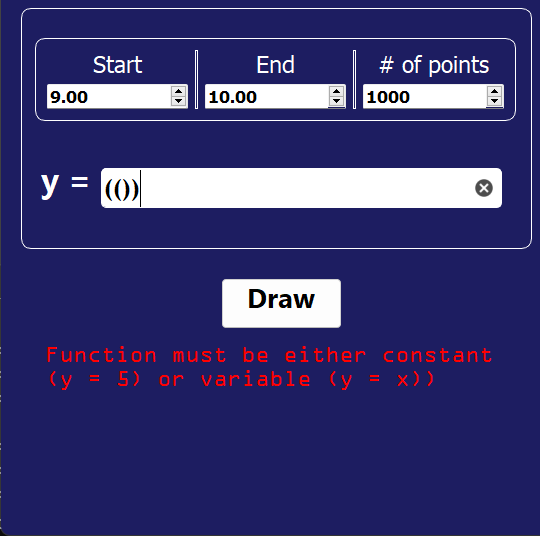
 - Wrong Function
-
- Wrong Function
-
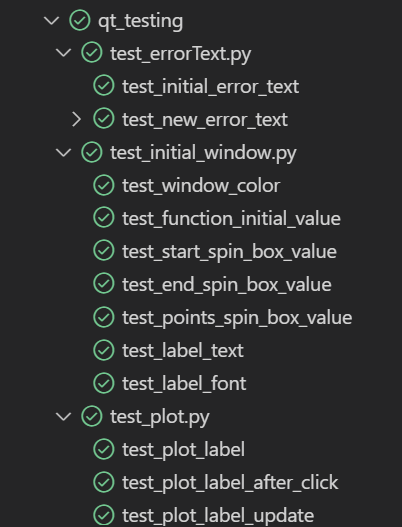
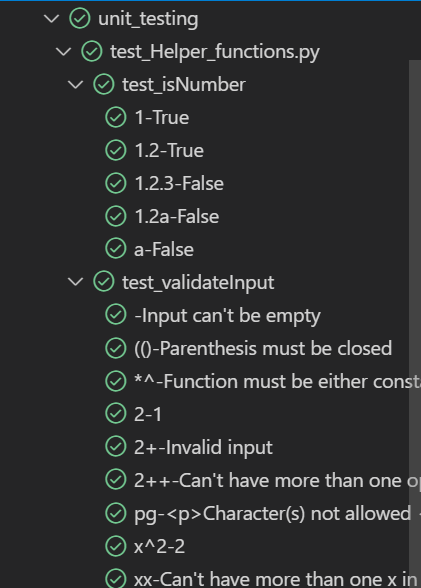
 - ### Testing (31 total tests)
 ## Technologies Used
- Python
- PySide2
- Matplotlib
- Numpy
## Run in command prompt
## Technologies Used
- Python
- PySide2
- Matplotlib
- Numpy
## Run in command prompt
- Clone the repository
```bash
git clone https://github.com/ahmedsaad562000/Master_Micro_Function_Plotter.git
```
- Create Virtual Environment
```bash
python -m venv path/to/new/virtual/environment
```
- Activate Your virtual Environment
- cmd
```bash
path/to/new/virtual/environment/Scripts/activate
```
- powershell
```bash
. path/to/new/virtual/environment/Scripts/Activate.ps1
```
- Install Requirements
```bash
pip install -r requirements.txt
```
- Run the program
```bash
python -m src
```