# grafana-llmops-forge
**Point it at any Grafana. Get a complete AI/LLM observability suite: discovered, generated, deployed, and *visually verified*.**
[](../../actions/workflows/ci.yml)
[](#-security-model)
[](#-security-model)
[](references/grafana_api_compat.md)
[-d2a8ff)](https://agentskills.io)
[](references/eu_ai_act_observability.md)
[](LICENSE)
**English** · [Français](docs/README.fr.md)
---
Your teams ship LLM features. Your CFO asks what they cost. Your board asks about the **EU AI Act**. Your SREs get paged about latency on a system nobody instrumented. And your Grafana, the tool you already trust, shows none of it.
`grafana-llmops-forge` fixes that with **one prerequisite: a reachable Grafana** (URL + service-account token). Everything else is discovered, not assumed.
**Runs anywhere your platform already is.** Prometheus, Thanos, Mimir, VictoriaMetrics, AWS AMP, Grafana Cloud or Kubernetes under the Prometheus Operator: the generated rules ship in both the portable format and a `PrometheusRule` manifest. Dashboards render in English by default, French with `--locale fr`. Governance evidence reads against the **EU AI Act, ISO/IEC 42001 and NIST AI RMF**; `--framework` picks which.
> **Not the same thing as Grafana Cloud AI Observability.** Grafana shipped its own AI/agent observability (public preview, April 2026). It is excellent, but Cloud-only, and it asks you to adopt *their* SDK. This one works on **self-hosted OSS**, on whatever telemetry you already emit, and adds **cost by provider origin** and **EU AI Act evidence**. Provider origin does not establish processing or storage locations. See the [FAQ](#faq).
```bash
export GRAFANA_URL=https://grafana.your-company.com GRAFANA_TOKEN=glsa_...
python3 scripts/discover.py --out capability_map.json # ① what do you actually have?
python3 scripts/forge_dashboards.py \
--capability capability_map.json \
--blueprints auto --deploy --with-alerts # ② forge + deploy + SLO alerts
python3 scripts/visual_audit.py --dashboards generated_dashboards # ③ prove it renders right
```
Multi-org deployments can pin `--org-id 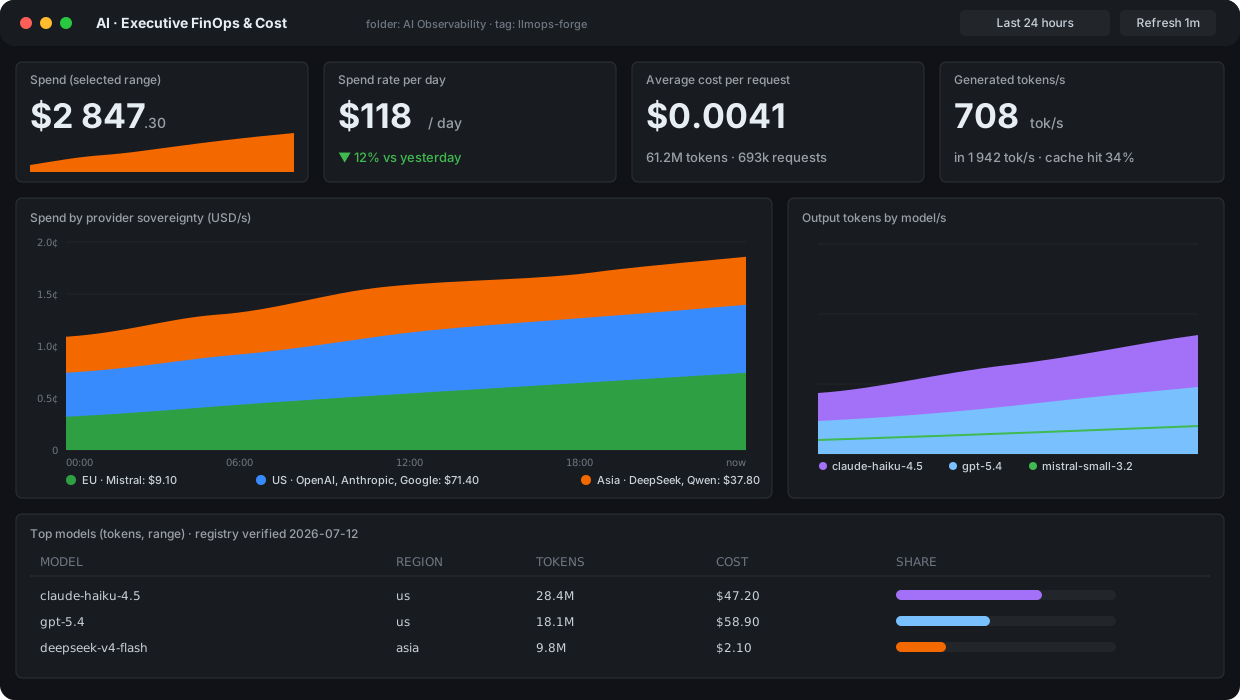 Illustration (hand-drawn SVG, not a screenshot) of the FinOps blueprint: cost composed from a 33-model price registry. Current panels label the regional split as provider origin, which does not establish processing or storage locations. For the real thing on real data, run
 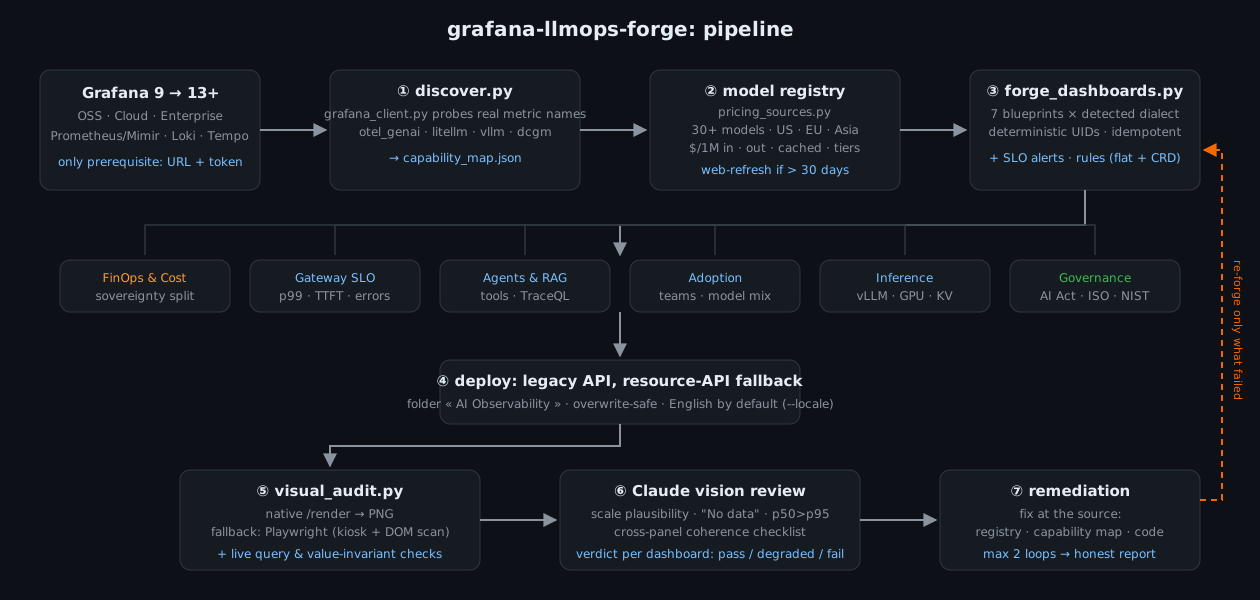 Diagram, not a screenshot. Every box is a script in
 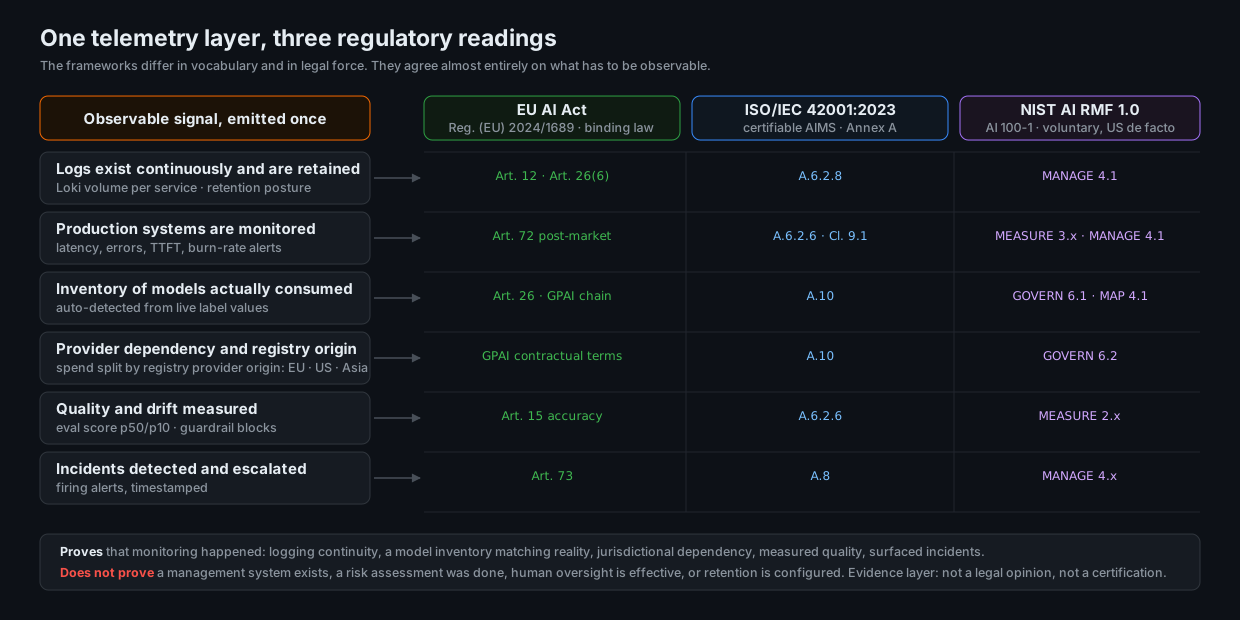 Diagram, not a screenshot. The measured panels are identical whichever framework you select; only the reading changes.
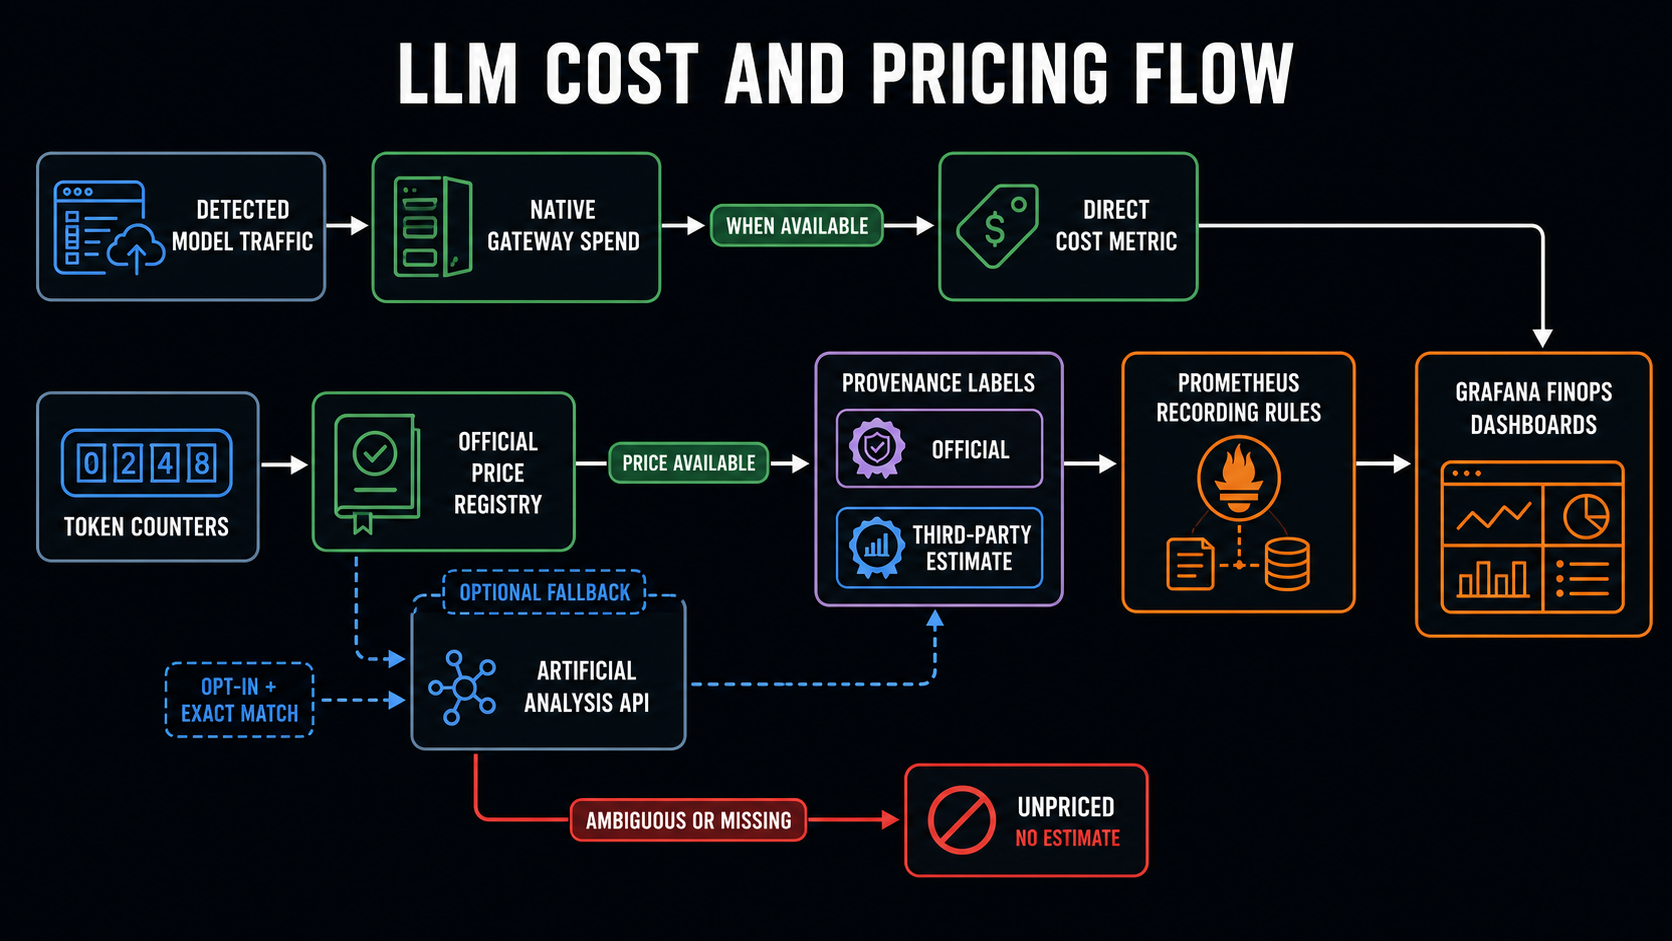 Conceptual cost flow for native gateway spend and OTel GenAI token pricing. Not a Grafana screenshot.