As a reminder, confusion matrices are used in classification problems to help us understand how our models are performing. Let’s start by recalling the confusion matrix for a binary classification problem.
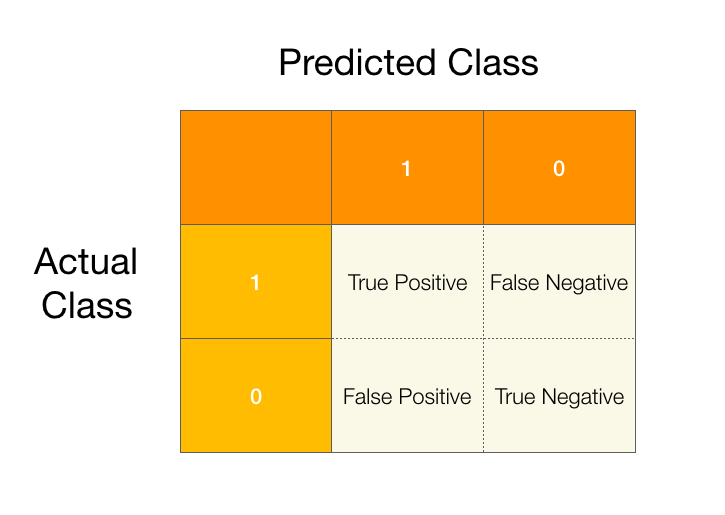
Using the confusion matrix we can describe two new concepts, precision and recall.
Precision is the fraction of positive predictions that were actually positive.
Recall is the fraction of positive data that is predicted to be positive.
This might be a bit abstract without an example so let's use an example to understand how these concepts are helpful in examining our classification models.
Once again, suppose we are looking to predict individuals who have some rare disease and those who don't. Most of our samples are individuals who do not have the disease, and we get the following confusion matrix after fitting our model.
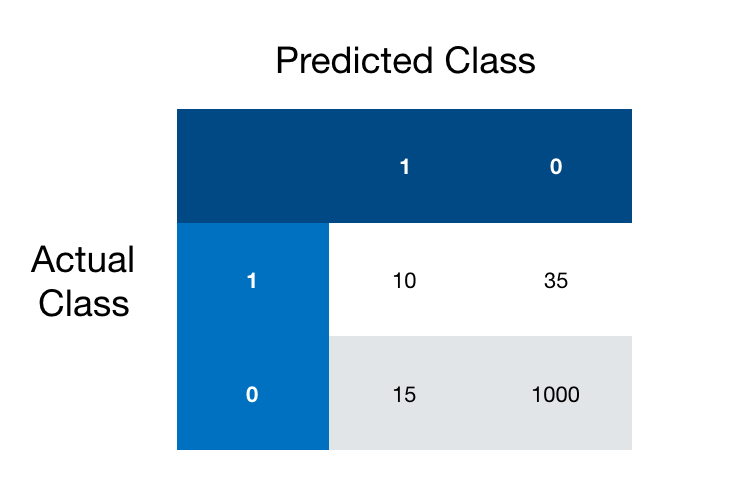
How many data points do we have? 10+15+35+1000 = 1060
How many are false positives? Our false positives are the samples that were predicted to be positive(1) but are actually negative(0), this corresponds to the bottom left matrix entry, so 15.
Okay we know how our confusion matrix works, now how do we make sense of precision and recall?
We know that precision is the fraction of positive predictions that were actually positive. So we just need to find the number of positive prediction that were actually positive and the total number of positive predictions.
The number of positive predictions that were actually positive is simply the number of true positives (TP). Next we look to find all the positive predictions, which we find corresponds with the first column of confusion matrix or the true positives (TP) and false positives (FP), so our total number of positive predictions is TP + FP.
Putting it all together our formula for precision is TP/(TP+FP).
For our above example we get precision 10/25 or 40%.
What this means is that we have predicted 25 people to have the disease but we were only right 40% of the time. That’s less than half of the time that we were right.
We also know that recall is the fraction of positive data that is predicted to be positive. We need to find the number of positive data in our data set and the number of positive predictions that were actually positive. We already found the total number of positive predictions that were actually positive TP. Therefore we only need to find the number of positive data in our set. This corresponds to the first row of our confusion matrix. Our first row contains true positives and false negatives (FN).
So our formula for recall is TP/(TP+FN).
Going back to our example our recall is 10/45 or roughly 22%.
This means that 45 people actually had the disease and we only correctly identified 22% of them.
As you can see precision and recall helps us summarize the performance of our model in a more precise way. Our precision and recall will always fall on the interval [0, 1] with 0 being the worst case and 1 being the best.
We can also plot precision and recall on a precision recall curve. When we do we see that there is a tradeoff between precision and recall. The higher your precision the lower your recall and vice versa. In real life these plots might cross over once or multiple times.
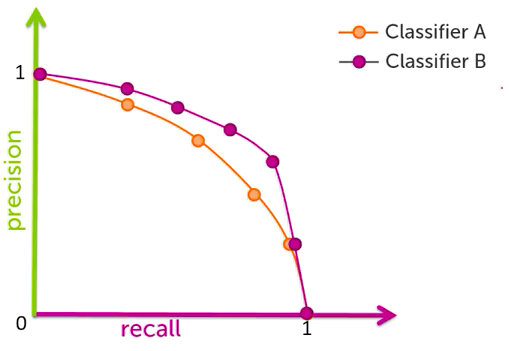
The amount of trade off you are willing to endure depends on what type of problem you are trying to solve. For instance if we are trying to classify cars coming off an assembly line as ‘ready for shipment’ (1) or ‘defective’ (0), we might be tempted to maximize precision as it will allow us to ship the most cars and thus maximize profits. However shipping defective cars can be extremely risky and cost car manufacturers hundreds of millions of dollars in lawsuits and on lost product, not to mention any costs associated with negative image. In this case we’d probably want to maximize recall at the expense of precision. It would be better to give cars that should have been marked ‘ready for shipment’ a second look over, than risk shipping defective product.
This may not be exactly what car manufactures do to prevent shipping defective product, but it is how they think about these kinds of trade offs. A lot of money and effort is put into preventive measures because of the high cost of mistakes.
You should be thinking carefully about what kind of error you are willing to accept. Understanding confusion matrices will help you do this.